. 2022 Oct;41(4):750-760.
doi: 10.14366/usg.21182. Epub 2022 Mar 24.

Ultrasound biomicroscopy for the assessment of early-stage nonalcoholic fatty liver disease induced in rats by a high-fat diet

Affiliations

Ultrasound biomicroscopy for the assessment of early-stage nonalcoholic fatty liver disease induced in rats by a high-fat diet

Antonio Carlos Soares Pantaleão Jr et al. Ultrasonography. 2022 Oct.

Abstract

Purpose: The aim of this study was to assess the ability of ultrasound biomicroscopy (UBM) to diagnose the initial stages of nonalcoholic fatty liver disease (NAFLD) in a rat model.

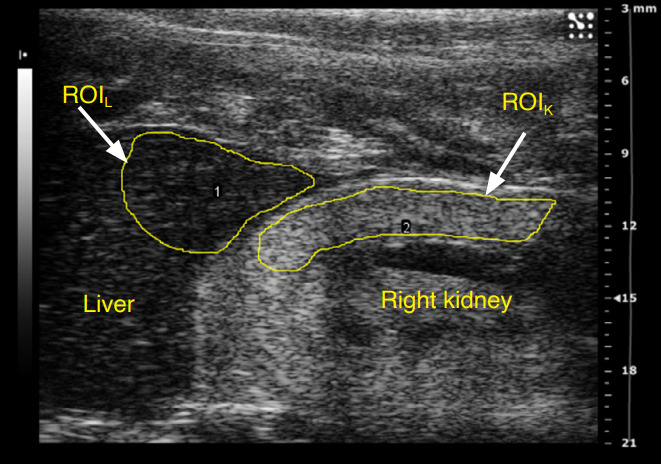
Methods: Eighteen male Wistar rats were allocated to control or experimental groups. A high-fat diet (HFD) with 20% fructose and 2% cholesterol, resembling a common Western diet, was fed to animals in the experimental groups for up to 16 weeks; those in the control group received a regular diet. A 21 MHz UBM system was used to acquire B-mode images at specific times: baseline (T0), 10 weeks (T10), and 16 weeks (T16). The sonographic hepatorenal index (SHRI), based on the average ultrasound image gray-level intensities from the liver parenchyma and right renal cortex, was determined at T0, T10, and T16. The liver specimen histology was classified using the modified Nonalcoholic Steatohepatitis Clinical Research Network NAFLD activity scoring system.

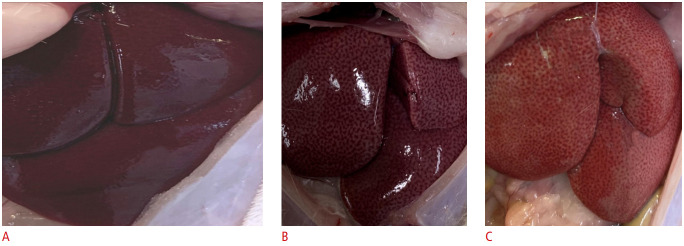
Results: The livers in the animals in the experimental groups progressed from sinusoidal congestion and moderate macro- and micro-vesicular steatosis to moderate steatosis and frequent hepatocyte ballooning. The SHRI obtained in the experimental group animals at T10 and T16 was significantly different from the SHRI of pooled control group. No significant difference existed between the SHRI in animals receiving HFD between T10 and T16.

Conclusion: SHRI measurement using UBM may be a promising noninvasive tool to characterize early-stage NAFLD in rat models.

Keywords: Animal models; Dietary cholesterol; High-fat diet; Nonalcoholic fatty liver disease; Ultrasonography.


Conflict of interest statement

No potential conflict of interest relevant to this article was reported.

Figures

Fig. 1.
Fig. 1.. Imaging setup.
A. Picture displaying the main devices used to acquire the ultrasound biomicroscopy images from the rat liver and kidney, including the Vevo 2100, the animal heated platform and the inhalatory anesthesia system. B. Detail of the ultrasound probe positioned over the rat abdomen.
Fig. 2.
Fig. 2.. Weekly animal weights normalized to the weight at T0.
Plots of the mean (±standard deviation) values for WA/W0, where WA is the weekly weight and W0 is the weight at T0, for the animals in the GCT10, GCT16, GEP10, and GEP16 groups during the feeding period of each group.
Fig. 3.
Fig. 3.. Typical 21-MHz ultrasound biomicroscopy image depicting sections of the rat liver and right kidney.
The regions of interest (ROIL and ROIK) surrounded by a yellow contour were used to calculate the corresponding the average gray-level intensities AIL and AIK for the liver and kidney parenchyma, respectively.
Fig. 4.
Fig. 4.. Boxplot of the sonographic hepatorenal index (SHRI) measured on ultrasound biomicroscopy images of the liver and kidney parenchyma for animals in GCB, GEP10, and GEP16.
The median SHRI was significantly different (P<0.05) for GCB×GEP10 and for GCB×GEP16. No significant difference was found between the SHRI results for the GEP10 and GEP16 groups. SD, standard deviation.
Fig. 5.
Fig. 5.. Photographs of the rat liver immediately after euthanasia.
A. Animal from the control group euthanized at T16 with hepatic parenchyma shows a preserved macroscopic appearance, lobes with regular contours, and a homogeneous brownish color. B. Animal from the experimental group euthanized at T10 following administration of the high-fat diet (HFD) with macroscopic changes to the liver shows heterogeneous coloration due to steatosis and vascular congestion. C. Animal from the experimental group euthanized at T16 following administration of the HFD with macroscopic changes to the liver shows heterogeneous coloration due to steatosis and vascular congestion, as well as lobes with blunt edges.
Fig. 6.
Fig. 6.. Liver weights for animals in the GCT, GEP10, and GEP16 groups.
The liver weight, WL, normalized to the animal weight, WA, measured just prior to euthanasia, is depicted in column plots (A) and boxplots (C). Liver weights in absolute values are shown in column plots (B) and in boxplots (D). The mean normalized weights (%) were significantly different (P<0.001) for GCT×GEP10 and GEP10×GEP16 as well as for GCT×GEP16 (P=0.005). The mean weights, in absolute values, were significantly different (P=0.001) only for GCT×GEP10 and GEP10×GEP16. SD, standard deviation.
Fig. 7.
Fig. 7.. Histology of the hepatic parenchyma from animals of the three groups.
A. An animal from the GCT group at T10, with the liver parenchyma shows the preserved architectural pattern. Note the portal tract with preserved dimensions and without inflammation (*) and the absence of steatosis and other significant histopathological changes in adjacent hepatocytes. B. An animal from the GEP10 group with hepatic parenchyma shows sinusoidal congestion (red arrows) and moderate macro- and micro-vesicular steatosis (black arrows). C. An animal from the GEP16 group with hepatic parenchyma shows sinusoidal congestion (red arrows), moderate steatosis, and frequent hepatocyte ballooning (black arrows) (A-C, H&E, ×40).

References

    1. World Health Organization . World health statistics 2020: monitoring health for the SDGs, sustainable development goals. Geneva: World Health Organization; 2020.
    1. Hruby A, Hu FB. The epidemiology of obesity: a big picture. Pharmacoeconomics. 2015;33:673–689. - PMC - PubMed
    1. Tanaka N, Kimura T, Fujimori N, Nagaya T, Komatsu M, Tanaka E. Current status, problems, and perspectives of non-alcoholic fatty liver disease research. World J Gastroenterol. 2019;25:163–177. - PMC - PubMed
    1. Wong VW, Chan WK, Chitturi S, Chawla Y, Dan YY, Duseja A, et al. Asia-Pacific Working Party on Non-alcoholic Fatty Liver Disease guidelines 2017-Part 1: definition, risk factors and assessment. J Gastroenterol Hepatol. 2018;33:70–85. - PubMed
    1. Mitra S, De A, Chowdhury A. Epidemiology of non-alcoholic and alcoholic fatty liver diseases. Transl Gastroenterol Hepatol. 2020;5:16. - PMC - PubMed