. 2022 Apr 8:2:27.
doi: 10.3310/nihropenres.13265.1.

Numbers, characteristics, and medical complexity of children with life-limiting conditions reaching age of transition to adult care in England: a repeated cross-sectional study [version 1; peer review: 2 approved]

Affiliations

Numbers, characteristics, and medical complexity of children with life-limiting conditions reaching age of transition to adult care in England: a repeated cross-sectional study [version 1; peer review: 2 approved]

Stuart Jarvi et al. NIHR Open Res. .

Abstract

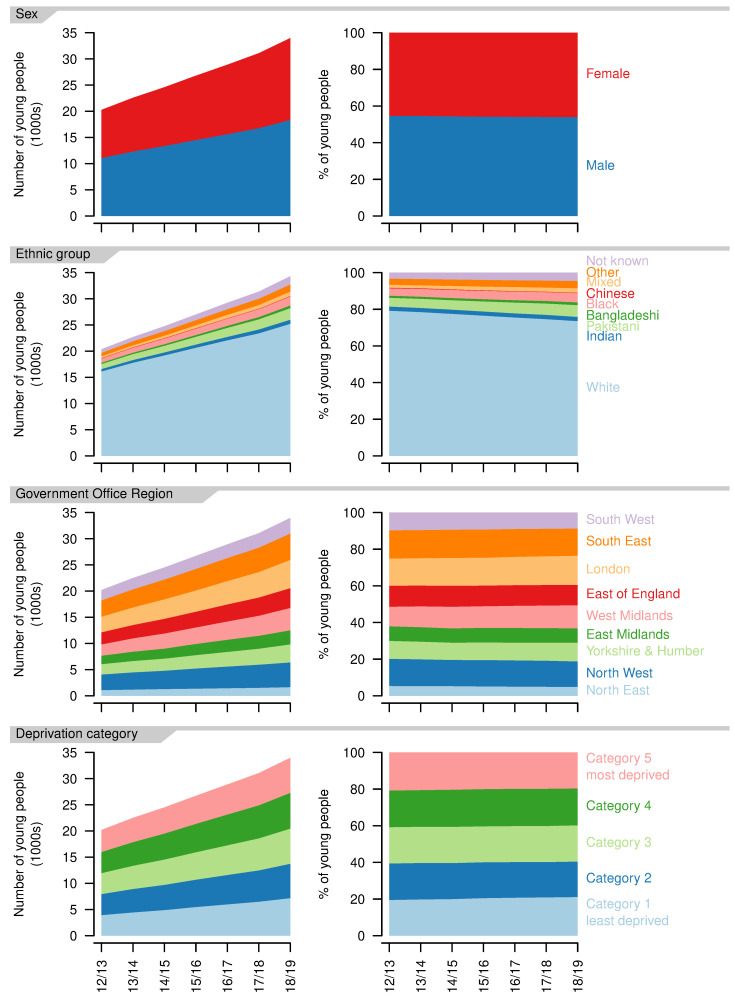
Background: The number of children with life-limiting conditions in England is known to be increasing, which has been attributed in part to increased survival times. Consequently, more of these young people will reach ages at which they start transitioning to adult healthcare (14-19 years). However, no research exists that quantifies the number of young people with life-limiting conditions in England reaching transition ages or their medical complexity, both essential data for good service planning.

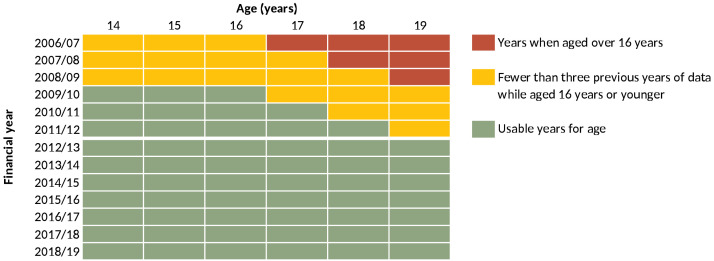
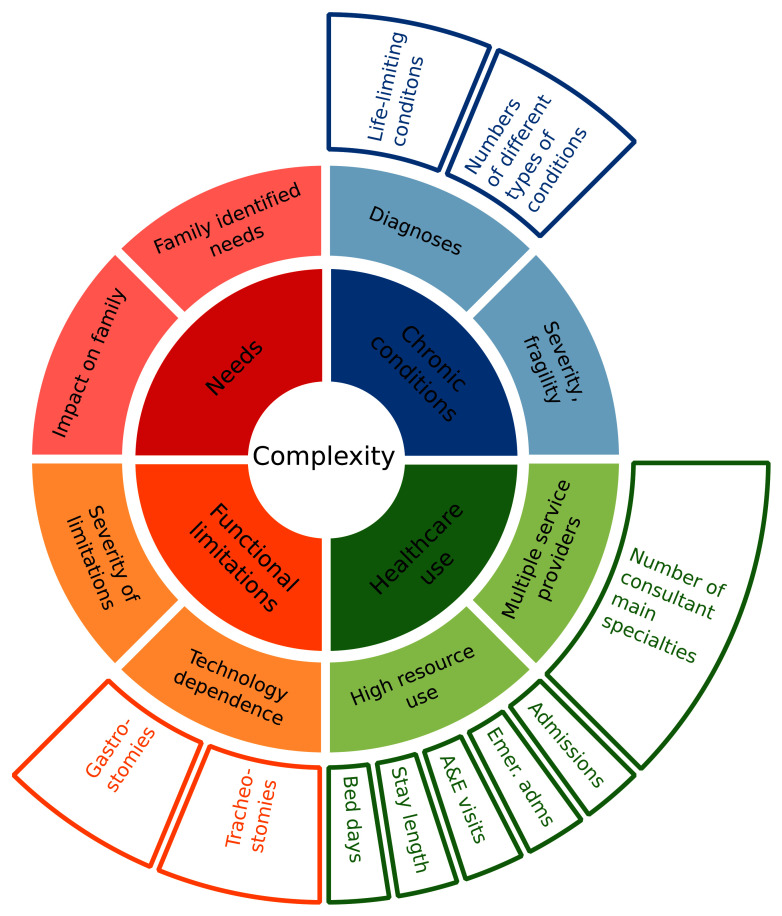
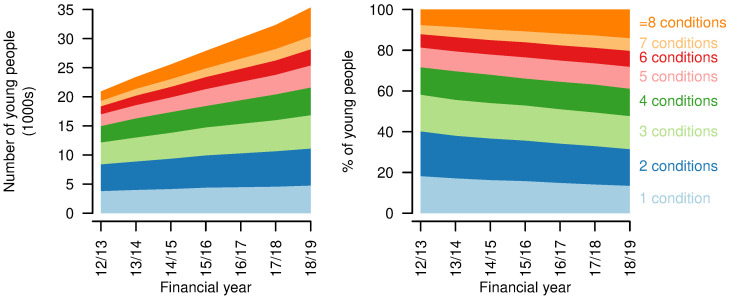
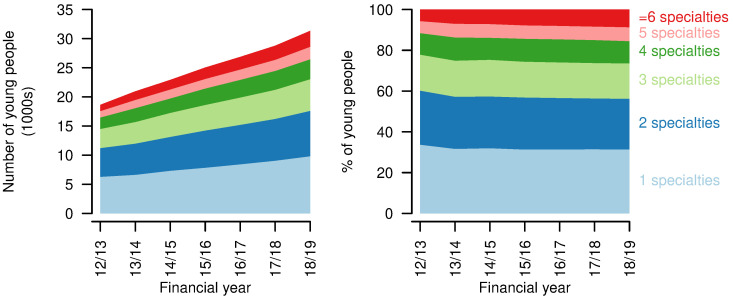
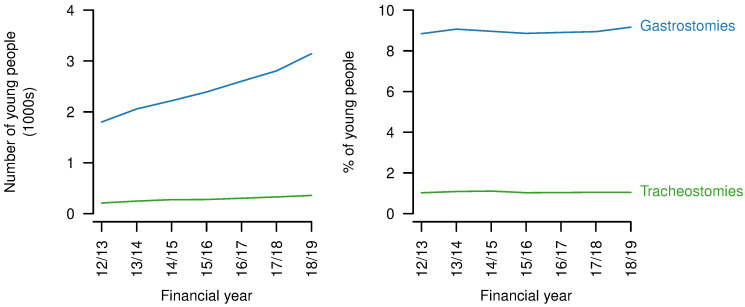
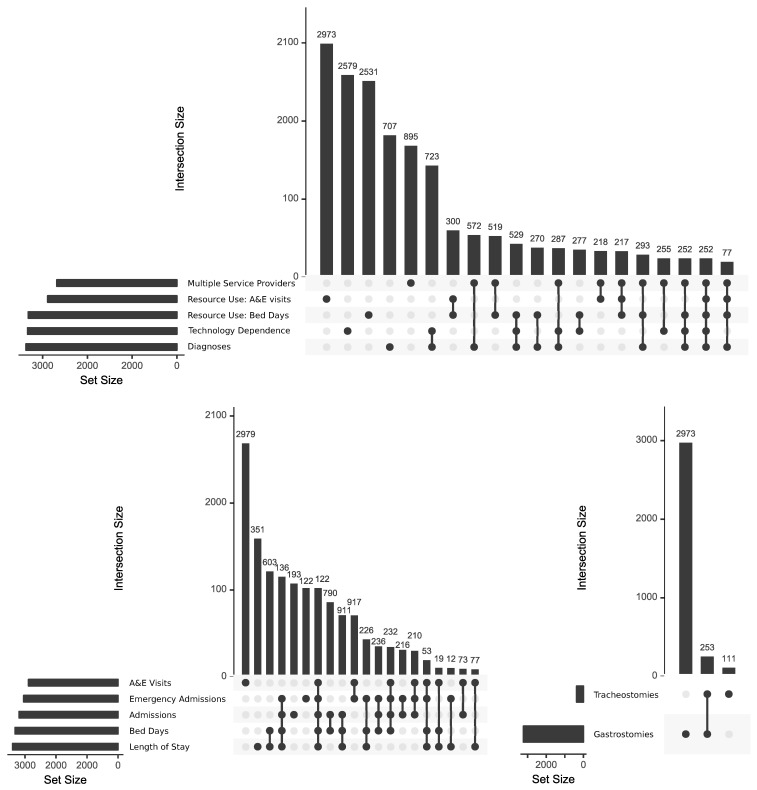
Methods: National hospital data in England (Hospital Episode Statistics) from NHS Digital were used to identify the number of young people aged 14-19 years from 2012/13 to 2018/19 with life-limiting conditions diagnosed in childhood. The data were assessed for indicators of medical complexity: number of conditions, number of main specialties of consultants involved, number of hospital admissions and Accident & Emergency Department visits, length of stay, bed days and technology dependence (gastrostomies, tracheostomies). Overlap between measures of complexity was assessed.

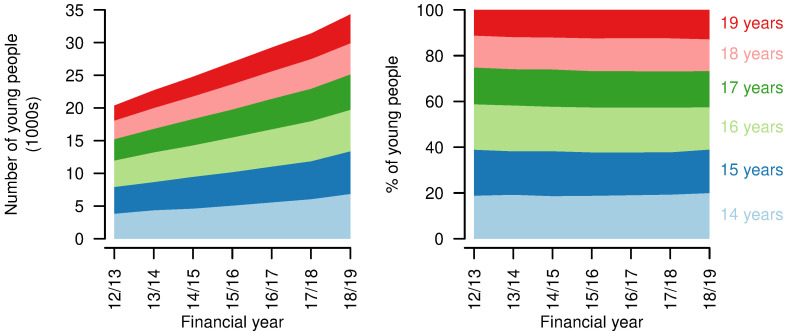
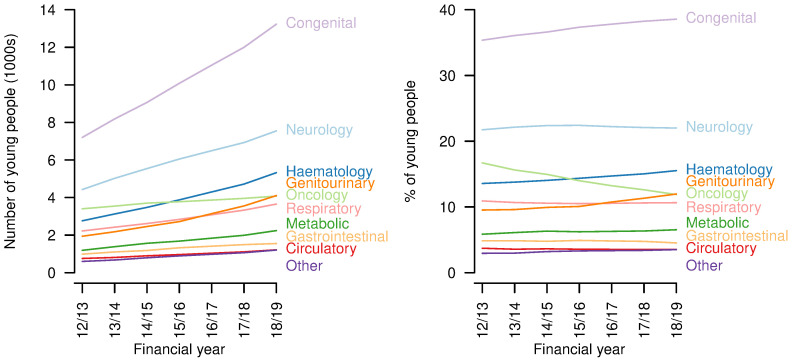
Results: The number of young people with life-limiting conditions has increased rapidly over the study period, from 20363 in 2012/13 to 34307 in 2018/19. There was evidence for increased complexity regarding the number of conditions and number of distinct main specialties of consultants involved in care, but limited evidence of increases in average healthcare use per person or increased technology dependence. The increasing size of the group meant that healthcare use increased overall. There was limited overlap between measures of medical complexity.

Conclusions: The number of young people with life-limiting conditions reaching ages at which transition to adult healthcare should take place is increasing rapidly. Healthcare providers will need to allocate resources to deal with increasing healthcare demands and greater complexity. The transition to adult healthcare must be managed well to limit impacts on healthcare resource use and improve experiences for young people and their families.

Keywords: Healthcare use; Life-limiting conditions; Medical complexity; Palliative care; Transition to adult care.


Conflict of interest statement

Competing interests: No competing interests were disclosed.

Figures

Figure 1.
Figure 1.. Years of data that could be used in the analysis.
Years of available data showing the years in which, for each age in that year, there were data for at least three earlier years while a young person of that age was aged 16 years or younger.
Figure 2.
Figure 2.. Conceptualisation of complexity and relevant data.
Inner two rings, adapted from earlier work , show conceptualisation of complexity. Outer ring shows relevant measures in the data.
Figure 3.
Figure 3.. Numbers and ages of young people aged 14–19 years with life limiting conditions.
Numbers (left) and proportions (right) of young people aged 14–19 years with a life-limiting condition, by age, by year.
Figure 4.
Figure 4.. Categories of conditions of young people aged 14–19 years with life limiting conditions.
Numbers (left) and proportions (right) of young people aged 14–19 years with a life-limiting condition with each category of condition, by year.
Figure 5.
Figure 5.. Demographics of young people aged 14–19 years with a life-limiting condition.
Numbers (left) and proportions (right) for each recorded sex, ethnic group, Government Office Region of residence and deprivation category, by year.
Figure 6.
Figure 6.. Numbers of chronic conditions for young people aged 14–19 years with a life-limiting condition.
Numbers (left) and proportions (right) of young people aged 14–19 years with a life-limiting condition having different numbers of chronic condition categories recorded, by year.
Figure 7.
Figure 7.. Numbers of main consultant specialties for young people aged 14–19 years with a life-limiting condition.
Numbers (left) and proportions (right) of young people aged 14–19 years with a life-limiting condition receiving treatment from consultants under different numbers of consultant main specialties in each year.
Figure 8.
Figure 8.. Indicators of high resource use for young people aged 14–19 years with a life-limiting condition.
First four rows: numbers (left) and proportions (right) of young people having different numbers of Accident & Emergency visits, inpatient admissions, emergency inpatient admissions, bed days in each year. Final row: numbers (left) and proportions (right) of inpatient admissions of differing lengths in each year.
Figure 9.
Figure 9.. Technology dependence for young people aged 14–19 years with a life-limiting condition.
Numbers (left) and proportions (right) of young people aged 14–9 years with a life-limiting condition also having a gastrostomy or tracheostomy present in each year.
Figure 10.
Figure 10.. UpSet graphs showing relations between measures of complexity.
Intersections between (top) those in approximately the top 10% for each of five indicators of complexity; (bottom left) those in approximately the top 10% in each of the five indicators of high resource use; (bottom right) those with technology dependence. For simplicity, only the largest 20 intersections are shown.

Similar articles

Cited by

References

    1. Fraser LK, Gibson-Smith D, Jarvis S, et al. : Estimating the current and future prevalence of life-limiting conditions in children in England. Palliat Med. 2021;35(9):1641–1651. 10.1177/0269216320975308 - DOI - PMC - PubMed
    1. Fraser LK, Miller M, Hain R, et al. : Rising national prevalence of life-limiting conditions in children in England. Pediatrics. 2012;129(4):e923–9. 10.1542/peds.2011-2846 - DOI - PubMed
    1. Chambers L: A guide to children’s palliative care.4 ed. Bristol: Together for Short Lives;2018. Reference Source
    1. Jarvis S, Parslow RC, Carragher P, et al. : How many children and young people with life-limiting conditions are clinically unstable? A national data linkage study. Arch Dis Child. 2017;102(2):131–138. 10.1136/archdischild-2016-310800 - DOI - PubMed
    1. Norman P, Fraser L: Prevalence of life-limiting conditions in children and young people in England: Time trends by area type. Health Place. 2014;26:171–9. 10.1016/j.healthplace.2014.01.002 - DOI - PubMed