Effects of Coix Seed Extract, Bifidobacterium BPL1, and Their Combination on the Glycolipid Metabolism in Obese Mice
- PMID: 35923203
- PMCID: PMC9341295
- DOI: 10.3389/fnut.2022.939423
Effects of Coix Seed Extract, Bifidobacterium BPL1, and Their Combination on the Glycolipid Metabolism in Obese Mice
Abstract
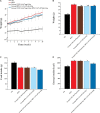
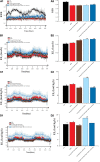
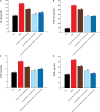
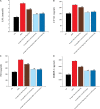
Coix seed extract (CSE) and probiotics have been reported to regulate glycolipid metabolism via different modes of action. We tested the effects of CSE, Bifidobacterium BPL1, and their combination to determine their effects on glycolipid metabolism in obese mice. Male C57BL/6J mice were fed a high-fat diet for 8 weeks to establish an obesity model. Obese mice were selected and divided into four groups: the model control group and three intervention groups. After 10 weeks of continuous gavage intervention, the mice in the intervention groups exhibited lower body weight (lower about 2.31 g, vs. HFD mice 42.23 g) and epididymal (lower about 0.37 g, vs. HFD mice 2.5 g) and perirenal fat content (lower about 0.47 g, vs. HFD mice 0.884 g); decreased fasting blood glucose, total cholesterol, triglycerides, and VLDL; and increased HLDL, respiratory exchange ratio, energy expenditure, and amount of exercise performed. CSE, BPL1 and their combination can effectively control the weight gain in obese mice, reduce fat content, and regulate blood lipids and abnormal blood sugar. These results may be related to reduce the chronic inflammatory states, improve energy metabolism, exercise, relieve insulin sensitivity, and reduce lipid synthesis via the intervention of CSE, BPL1 and their combination. Compared with the single use of CSE alone, the combination of CSE + BPL1 can better exert the regulation function of intestinal flora, and change in the abundance of bacteria that could improve the level of inflammatory factors, such as increasing Bifidobacterium, reducing Lactococcus. Compared with the use of BPL1 alone, the combination of CSE and BPL1 can better regulate pancreatic islet and improve blood sugar. CSE may act directly on body tissues to exert anti-inflammatory effects. BPL1 and CSE + BPL1 may improve the structure and function of the intestinal flora, and reduce tissue inflammation.
Keywords: Bifidobacterium BPL1; Coix seed extract; glycolipid metabolism; gut flora; inflammation; obesity.
Copyright © 2022 Zhang, Jia, Xu, Xie, Zhu, Zhang, Zhao, Hao, Li, Du, Liu, Liu, Ma, Hung, Feng and Li.
Conflict of interest statement
XJ, ZZ, JH, HaL, JD, YL, W-HL, XM, WH, and HF Inner Mongolia Dairy Technology Research Institute Co., Ltd., and Inner Mongolia Yili Industrial Group Co., Ltd. The remaining authors declare that the research was conducted in the absence of any commercial or financial relationships that could be construed as a potential conflict of interest.
Figures


Similar articles
-
Effects of Coix seed extract, Lactobacillus paracasei K56, and their combination on the glycolipid metabolism in obese mice.J Food Sci. 2023 Mar;88(3):1197-1213. doi: 10.1111/1750-3841.16474. Epub 2023 Jan 30. J Food Sci. 2023. PMID: 36717373
-
The effects of Ascophyllum nodosum, Camellia sinensis-leaf extract, and their joint interventions on glycolipid and energy metabolism in obese mice.Front Nutr. 2023 Aug 24;10:1242157. doi: 10.3389/fnut.2023.1242157. eCollection 2023. Front Nutr. 2023. PMID: 37693249 Free PMC article.
-
Coix Seed Extract Attenuates Glycolipid Metabolism Disorder in Hyperlipidemia Mice Through PPAR Signaling Pathway Based on Metabolomics and Network Pharmacology.Foods. 2025 Feb 24;14(5):770. doi: 10.3390/foods14050770. Foods. 2025. PMID: 40077474 Free PMC article.
-
Defatted safflower seed extract inhibits adipogenesis in 3T3-L1 preadipocytes and improves lipid profiles in C57BL/6J ob/ob mice fed a high-fat diet.Nutr Res. 2016 Sep;36(9):995-1003. doi: 10.1016/j.nutres.2016.07.004. Epub 2016 Jul 25. Nutr Res. 2016. PMID: 27632920
-
In vitro Cholesterol Assimilation by Bifidobacterium animalis subsp. lactis (BPL1) Probiotic Bacteria Under Intestinal Conditions.Endocr Metab Immune Disord Drug Targets. 2022;22(4):433-439. doi: 10.2174/1871530321666210908124848. Endocr Metab Immune Disord Drug Targets. 2022. PMID: 34496737 Review.
Cited by
-
Cardiovascular protection of YiyiFuzi powder and the potential mechanisms through modulating mitochondria-endoplasmic reticulum interactions.Front Pharmacol. 2024 Jun 24;15:1405545. doi: 10.3389/fphar.2024.1405545. eCollection 2024. Front Pharmacol. 2024. PMID: 38978978 Free PMC article. Review.
-
Adlay, an ancient functional plant with nutritional quality, improves human health.Front Nutr. 2022 Dec 22;9:1019375. doi: 10.3389/fnut.2022.1019375. eCollection 2022. Front Nutr. 2022. PMID: 36618703 Free PMC article. Review.
-
Research Progress on the Mechanism for Improving Glucose and Lipid Metabolism Disorders Using Phenolic Acid Components from Medicinal and Edible Homologous Plants.Molecules. 2024 Oct 10;29(20):4790. doi: 10.3390/molecules29204790. Molecules. 2024. PMID: 39459158 Free PMC article. Review.
-
Maternal obesity and the impact of associated early-life inflammation on long-term health of offspring.Front Cell Infect Microbiol. 2022 Sep 16;12:940937. doi: 10.3389/fcimb.2022.940937. eCollection 2022. Front Cell Infect Microbiol. 2022. PMID: 36189369 Free PMC article. Review.
-
Potential herb‒drug interactions between anti-COVID-19 drugs and traditional Chinese medicine.Acta Pharm Sin B. 2023 Jun 5;13(9):3598-637. doi: 10.1016/j.apsb.2023.06.001. Online ahead of print. Acta Pharm Sin B. 2023. PMID: 37360014 Free PMC article. Review.
References
-
- World Health Organization. (2017) Obesity Data and Statistics. Available online at: http://www.euro.who.int/en/health-topics/noncommunicable-diseases/obesit... (accessed June 14, 2021).
-
- Li X, Gu K, Liang M, Zhang Y, Wang Y, Li Y. Research progress on chemical constituents and pharmacological effects of coix seeds. Chin Herb Med. (2020) 51:5645–57.
-
- Bi T, Yang G, Ma H. Research progress on chemical constituents and pharmacological activities of coix seed. Strait Pharm. (2019) 31:52–6.
-
- Peng Y, Wang J, Xiong K, Li X. Research progress on safety and functional evaluation of coix seed, a health food raw material. Strait J Prev Med. (2020) 26:16–8.
LinkOut - more resources
Full Text Sources

