. 2022 Jul 18:9:867727.
doi: 10.3389/fnut.2022.867727. eCollection 2022.

Head circumference as an epigenetic risk factor for maternal nutrition

Affiliations

Head circumference as an epigenetic risk factor for maternal nutrition

Maria J Miele et al. Front Nutr. .

Abstract

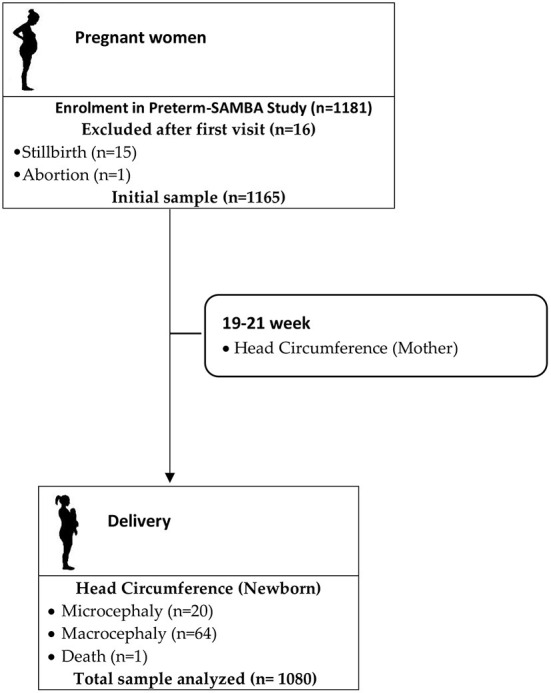
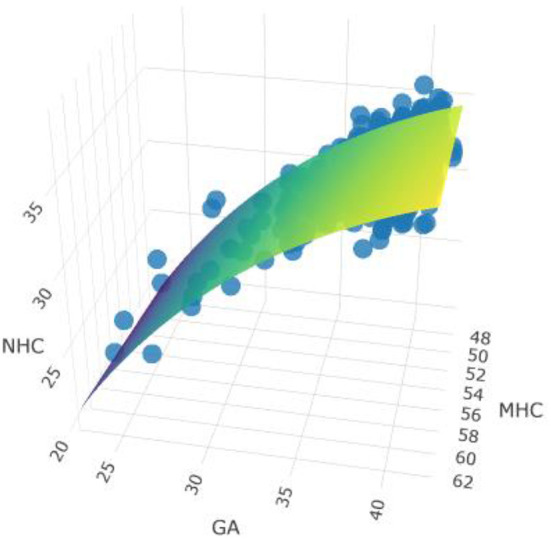
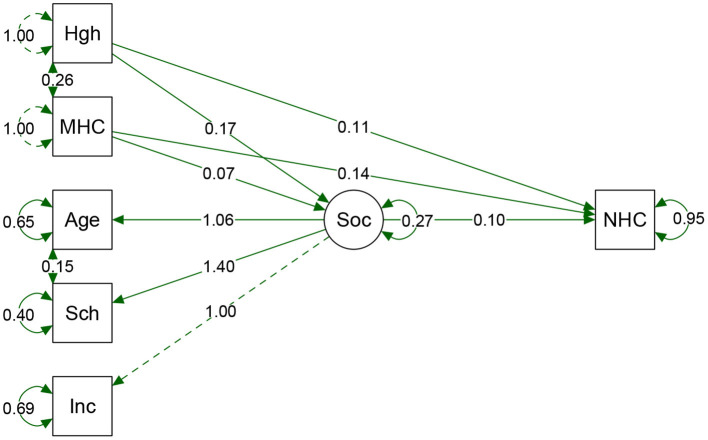
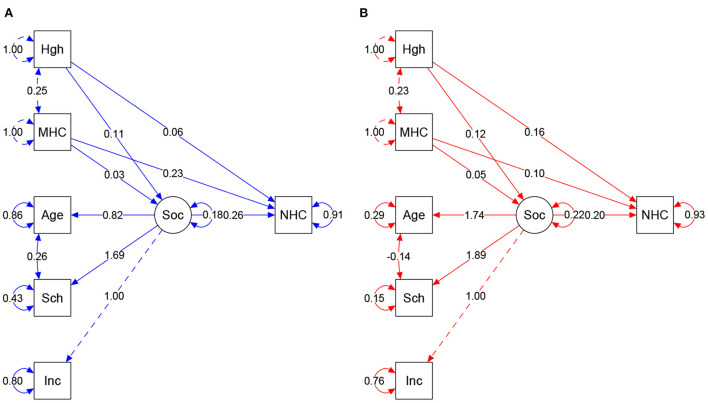
Nutrition indicators for malnutrition can be screened by many signs such as stunting, underweight or obesity, muscle wasting, and low caloric and nutrients intake. Those deficiencies are also associated with low socioeconomic status. Anthropometry can assess nutritional status by maternal weight measurements during pregnancy. However, most studies have focused primarily on identifying changes in weight or Body Mass Index (BMI), and their effects on neonatal measures at present time. Whereas head circumference (HC) has been associated with nutrition in the past. When the mother was exposed to poor nutrition and unfavorable social conditions during fetal life, it was hypothesized that the intergenerational cycle was potentially mediated by epigenetic mechanisms. To investigate this theory, maternal head circumference (MHC) was associated with neonatal head circumference (NHC) in pregnant women without preexisting chronic conditions, differentiated by sociodemographic characteristics. A multiple linear regression model showed that each 1 cm-increase in MHC correlated with a 0.11 cm increase in NHC (β95% CI 0.07 to 0.15). Notwithstanding, associations between maternal and neonatal anthropometrics according to gestational age at birth have been extensively explained. Path analysis showed the influence of social status and the latent variable was socioeconomic status. A model of maternal height and head circumference was tested with effects on neonatal HC. The social variable lacked significance to predict neonatal HC in the total sample (p = 0.212) and in the South/Southeast (p = 0.095), in contrast to the Northeast (p = 0.047). This study highlights the potential intergenerational influence of maternal nutrition on HC, suggesting that maternal nutrition may be more relevant in families with major social vulnerability.

Keywords: anthropometry; maternal nutrition; newborn; pregnancy; socioeconomic factors.


Figures

Figure 1
Figure 1
Flowchart of study population.
Figure 2
Figure 2
Model adjusted for gestational age and MHC and NHC measurements. Link to see model: https://rpubs.com/MariaMiele/899285. Observations 812, F-statistic, F statistics p-value <0.001. Adjusted R2/R2ajusted: 0.145/0.143.
Figure 3
Figure 3
Result from path analyses of the total sample. Hgh, height; MHC, Maternal HC; Sch, Schooling. Inc, Income; Soc, Socio (latent variable); NHC, Neonatal HC. Arrow direction indicates direct and indirect effects of variables that predict NHC. The direction of Socio arrows for the three predecessor variables shows the contribution of each indicator value. As far as we could verify; schooling had a greater weight on Socio variable. Circles show the standard error of a parameter. Model fits: p-value = <0.0001. Chi-square (X2) = 0.340, Degree of Freedom (df) = 5. X2/df = 0.068. CFI = 0.999, TLI = 0.997. RMSEA = 0.013 (95%CI 0.000–0.052). Adjustment parameters suggested that the model is acceptable, indicating that the composition of these variables could explain the effects on the proportion of NHC.
Figure 4
Figure 4
(A,B) Result of structural equation model according to regions. Colors = Blue: South/Southeast, Red: Northeast. Arrow direction indicates direct and indirect effects of variables in the prediction of NHC. Values show regression and covariances among variables. Circles show standardized parameter values. MHC, Maternal HC; Sch, Schooling; Inc, Income; Soc, Socio (latent variable); NHC, Neonate HC. Model fits: South/Southeast: p-value = <0.0001. Chi-square (X2) = 0.109, Degree of Freedom (df) = 5. X2/df = 0.0218. CFI = 0.981. TLI = 0.946. RMSEA = 0.047 (95%CI 0.000–0.096). Northeast: p-value = <0.0001. Chi-square (X2) = 0.130. df = 5. X2/df = 0.026. CFI = 0.991. TLI = 0.976. RMSEA = 0.039 (IC 95% 0.000–0.083). Plausibility indexes were considered capable of showing the influence of variable interaction, explaining the proportion of NHC.

Similar articles

Cited by

References

    1. Roseboom T, de Rooij S, Painter R. The Dutch famine and its long-term consequences for adult health. Early Hum Dev. (2006) 82:485–91. 10.1016/j.earlhumdev.2006.07.001 - DOI - PubMed
    1. Chen X, Zhao D, Mao X, Xia Y, Baker PN, Zhang H. maternal dietary patterns and pregnancy outcome. Nutrients. (2016) 8:351. 10.3390/nu8060351 - DOI - PMC - PubMed
    1. Stephenson J, Heslehurst N, Hall J, Schoenaker DAJM, Hutchinson J, Cade JE, et al. . Before the beginning: nutrition and lifestyle in the preconception period and its importance for future health. Lancet. (2018) 391:1830–41. 10.1016/S0140-6736(18)30311-8 - DOI - PMC - PubMed
    1. Colón-Ramos U, Racette SB, Ganiban J, Nguyen TG, Kocak M, Carroll KN, et al. . Association between dietary patterns during pregnancy and birth size measures in a diverse population in Southern US. Nutr. (2015) 7:1318–32. 10.3390/nu7021318 - DOI - PMC - PubMed
    1. Goldstein RF, Abell SK, Ranasinha S, Misso ML, Boyle JA, Harrison CL, et al. . Gestational weight gain across continents and ethnicity: systematic review and meta-analysis of maternal and infant outcomes in more than one million women. BMC Med. (2018) 16:153. 10.1186/s12916-018-1128-1 - DOI - PMC - PubMed