

Early Prediction of Hemodynamic Shock in Pediatric Intensive Care Units With Deep Learning on Thermal Videos
- PMID: 35923238
- PMCID: PMC9340772
- DOI: 10.3389/fphys.2022.862411
Early Prediction of Hemodynamic Shock in Pediatric Intensive Care Units With Deep Learning on Thermal Videos
Abstract
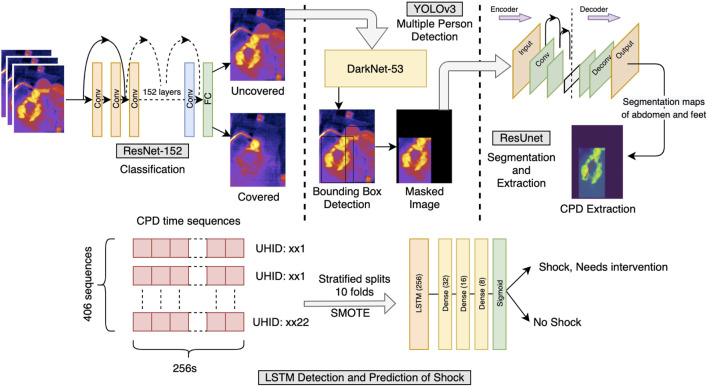
Shock is one of the major killers in intensive care units, and early interventions can potentially reverse it. In this study, we advance a noncontact thermal imaging modality for continuous monitoring of hemodynamic shock working on 1,03,936 frames from 406 videos recorded longitudinally upon 22 pediatric patients. Deep learning was used to preprocess and extract the Center-to-Peripheral Difference (CPD) in temperature values from the videos. This time-series data along with the heart rate was finally analyzed using Long-Short Term Memory models to predict the shock status up to the next 6 h. Our models achieved the best area under the receiver operating characteristic curve of 0.81 ± 0.06 and area under the precision-recall curve of 0.78 ± 0.05 at 5 h, providing sufficient time to stabilize the patient. Our approach, thus, provides a reliable shock prediction using an automated decision pipeline that can provide better care and save lives.
Keywords: ICU—intensive care unit; artificial intelligence; computer vision; deep learning; hemodynamic shock; thermal imaging.
Copyright © 2022 Vats, Nagori, Singh, Dutt, Bandhey, Wason, Lodha and Sethi.
Conflict of interest statement
The authors declare that the research was conducted in the absence of any commercial or financial relationships that could be construed as a potential conflict of interest.
Figures


Similar articles
-
Predicting Hemodynamic Shock from Thermal Images using Machine Learning.Sci Rep. 2019 Jan 14;9(1):91. doi: 10.1038/s41598-018-36586-8. Sci Rep. 2019. PMID: 30643187 Free PMC article.
-
Development of a Deep Learning Network to Classify Inferior Vena Cava Collapse to Predict Fluid Responsiveness.J Ultrasound Med. 2021 Aug;40(8):1495-1504. doi: 10.1002/jum.15527. Epub 2020 Oct 10. J Ultrasound Med. 2021. PMID: 33038035
-
External validation of a machine learning model to predict hemodynamic instability in intensive care unit.Crit Care. 2022 Jul 14;26(1):215. doi: 10.1186/s13054-022-04088-9. Crit Care. 2022. PMID: 35836294 Free PMC article.
-
State of the Art of Machine Learning-Enabled Clinical Decision Support in Intensive Care Units: Literature Review.JMIR Med Inform. 2022 Mar 3;10(3):e28781. doi: 10.2196/28781. JMIR Med Inform. 2022. PMID: 35238790 Free PMC article. Review.
-
Diagnostic Accuracy of Artificial Intelligence Based on Imaging Data for Preoperative Prediction of Microvascular Invasion in Hepatocellular Carcinoma: A Systematic Review and Meta-Analysis.Front Oncol. 2022 Feb 24;12:763842. doi: 10.3389/fonc.2022.763842. eCollection 2022. Front Oncol. 2022. PMID: 35280776 Free PMC article.
Cited by
-
Uses of infrared thermography in acute illness: a systematic review.Front Med (Lausanne). 2024 Jun 24;11:1412854. doi: 10.3389/fmed.2024.1412854. eCollection 2024. Front Med (Lausanne). 2024. PMID: 38983367 Free PMC article.
-
Machine learning techniques for predicting neurodevelopmental impairments in premature infants: a systematic review.Front Artif Intell. 2025 Jan 20;8:1481338. doi: 10.3389/frai.2025.1481338. eCollection 2025. Front Artif Intell. 2025. PMID: 39906903 Free PMC article.
-
Comparative survey among paediatricians, nurses and health information technicians on ethics implementation knowledge of and attitude towards social experiments based on medical artificial intelligence at children's hospitals in Shanghai: a cross-sectional study.BMJ Open. 2023 Nov 21;13(11):e071288. doi: 10.1136/bmjopen-2022-071288. BMJ Open. 2023. PMID: 37989373 Free PMC article.
References
-
- Balakrishnan G., Durand F., Guttag J. (2013). “Detecting Pulse from Head Motions in Video,” in IEEE Conference on Computer Vision and Pattern Recognition, 3430–3437. 10.1109/CVPR.2013.440 - DOI
LinkOut - more resources
Full Text Sources