Impact of Automated Genotyping and Increased Breeding Oversight on Overall Mouse Breeding Colony Productivity
- PMID: 35923239
- PMCID: PMC9340497
- DOI: 10.3389/fphys.2022.925784
Impact of Automated Genotyping and Increased Breeding Oversight on Overall Mouse Breeding Colony Productivity
Abstract
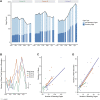
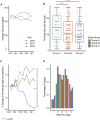
Mice have become increasingly popular as genetic tools, facilitated by the production of advanced genetically engineered mouse models (GEMMs). GEMMs often require in-house breeding and production by research groups, which can be quite complex depending on the design of the GEMM. Identification of methods to increase the efficiency of breeding practices offers opportunities to optimize and reduce the number of animals bred for research while maintaining similar research output. We investigated the use of commercial automated genotyping and centralized breeding management on overall breeding colony productivity in a colony of multiple GEMM lines. This study involved a three-group study design, where the first group continued their standard breeding practices (group A), the second utilized standard breeding practices but outsourced genotyping in place of inhouse genotyping (group B), and a third group outsourced genotyping and had assistance with routine breeding practices from the laboratory animal care team (group C). Compared to standard practice (group A), groups B and C produced more cages and mice over time, which appeared to be driven primarily by an increase in the number of breeding cages in each colony. Higher numbers of breeders correlated with an increased number of litters and generation of new cages. The increases in colony productivity measures were further enhanced in group C compared to group B. The overall cost associated with producing new animals was lowest in group B, followed by groups A and C. Although, by the end of the study, cost to produce new mice was comparable between all three groups. These data suggest that by optimizing breeding practices and management, fewer animals could be utilized to produce the same amount of progeny and reduce overall animal usage and production.
Keywords: 3Rs (replace; breeding; genetically engineered (GE) animals; genotyping; mouse model; reduce; refine).
Copyright © 2022 VanDenBerg, Oravecz-Wilson, Krolikowski, Hill, Reddy and Freeman.
Conflict of interest statement
The authors declare that the research was conducted in the absence of any commercial or financial relationships that could be construed as a potential conflict of interest.
Figures


References
-
- Anderson L. C., Otto G., Pritchett-Corning K. R., Whary M. T. (2015). Laboratory Animal Medicine. Amsterdam, Netherlands: Elsevier.
-
- Barnett S. A., Manly B. M., Pontecorvo G. (1959). Effects of Low Environmental Temperature on the Breeding Performance of Mice. Proc. R. Soc. Lond. Ser. B. Biol. Sci. 151, 87–105.
LinkOut - more resources
Full Text Sources

