

Alterations in brain structure associated with trigeminal nerve anatomy in episodic migraine
- PMID: 35923273
- PMCID: PMC9341524
- DOI: 10.3389/fpain.2022.951581
Alterations in brain structure associated with trigeminal nerve anatomy in episodic migraine
Abstract
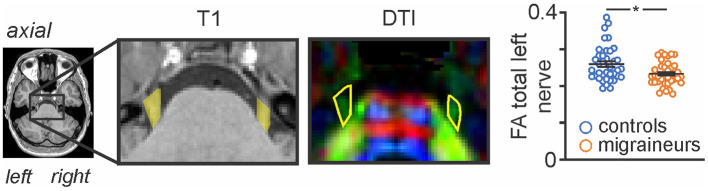
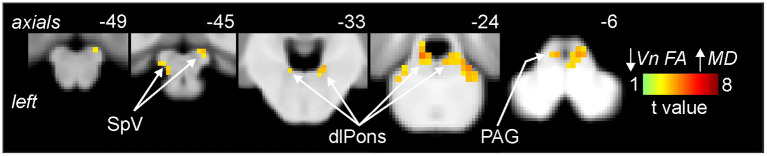
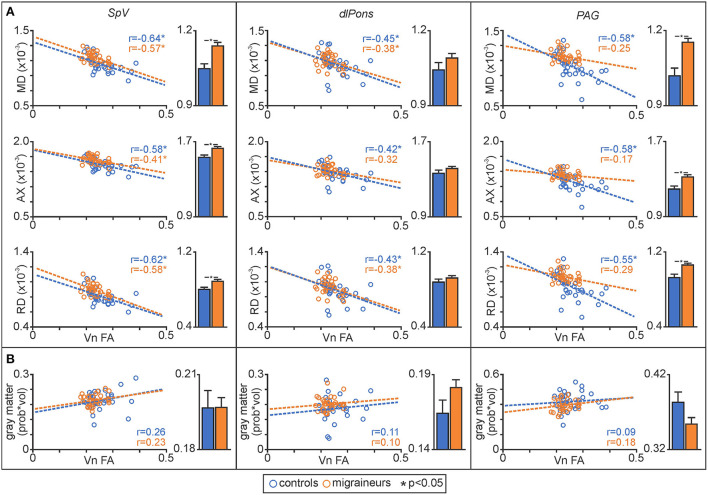
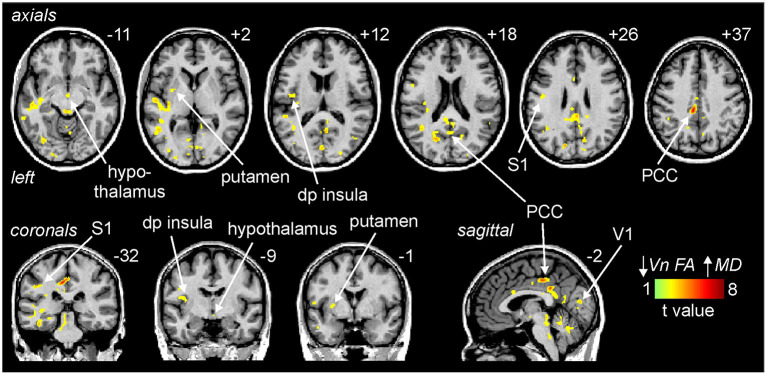
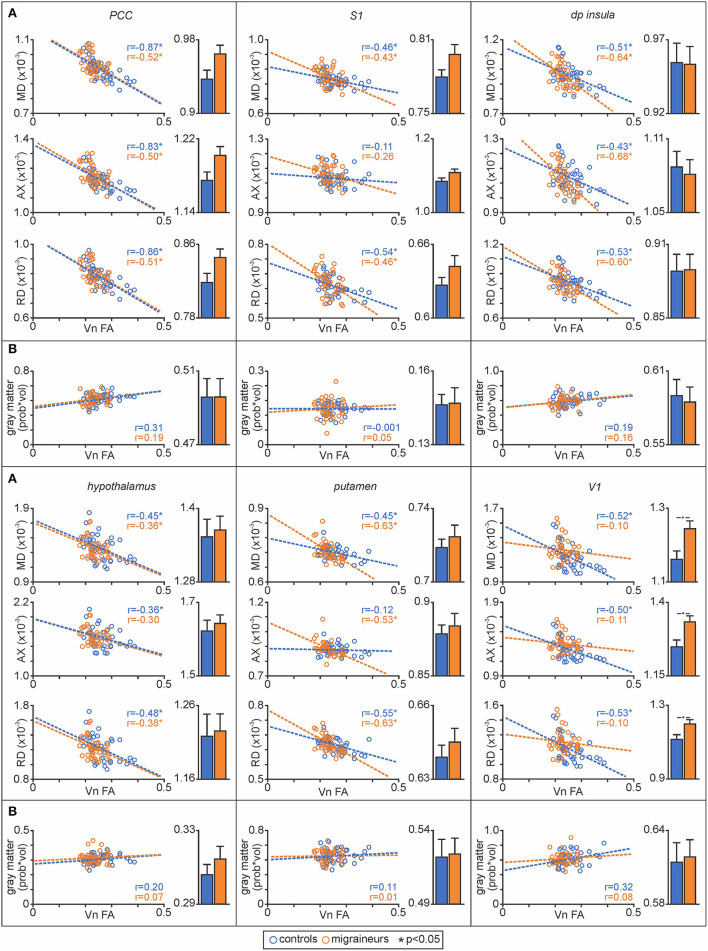
The pathophysiology of migraine remains to be elucidated. We have recently shown that interictal migraineurs exhibit reduced fractional anisotropy (FA) in the root entry zone of the trigeminal nerve when compared to controls, but it is not known if this altered nerve anatomy is associated with changes within the brainstem or higher cortical brain regions. Diffusion tensor imaging of the brain was used to calculate regional measures of structure, including mean diffusivity (MD), axial diffusivity (AX) and radial diffusivity (RD) in addition to voxel-based morphometry of T1-weighted anatomical images. Linear relationships between trigeminal nerve anatomy (FA) and MD throughout the brainstem and/or higher cortical regions were determined in both controls (n = 31, brainstem; n = 38, wholebrain) and interictal migraineurs (n = 32, brainstem; n = 38, wholebrain). Additionally, within the same brain areas, relationships of AX and RD with nerve FA were determined. We found that in both interictal migraine and control participants, decreasing trigeminal nerve FA was associated with significantly increased MD in brainstem regions including the spinal trigeminal nucleus and midbrain periaqueductal gray matter (PAG), and in higher brain regions such as the hypothalamus, insula, posterior cingulate, primary somatosensory and primary visual (V1) cortices. Whereas, both control and migraineur groups individually displayed significant inverse correlations between nerve FA and MD, in migraineurs this pattern was disrupted in the areas of the PAG and V1, with only the control group displaying a significant linear relationship (PAG controls r = -0.58, p = 0.003; migraineurs r = -0.25, p = 0.17 and V1 controls r = -0.52, p = 0.002; migraineurs r = -0.10, p = 0.55). Contrastingly, we found no gray matter volume changes in brainstem or wholebrain areas. These data show that overall, trigeminal nerve anatomy is significantly related to regional brain structure in both controls and migraineurs. Importantly, the PAG showed a disruption of this relationship in migraineurs suggesting that the anatomy and possibly the function of the PAG is uniquely altered in episodic migraine, which may contribute to altered orofacial pain processing in migraine.
Keywords: MRI; PAG; brain imaging; diffusion tensor imaging; fractional anisotropy; mean diffusivity.
Copyright © 2022 Mungoven, Meylakh, Macefield, Macey and Henderson.
Figures
Similar articles
-
Functional MRI and Diffusion Tensor Imaging in Migraine: A Review of Migraine Functional and White Matter Microstructural Changes.J Cent Nerv Syst Dis. 2023 Oct 27;15:11795735231205413. doi: 10.1177/11795735231205413. eCollection 2023. J Cent Nerv Syst Dis. 2023. PMID: 37900908 Free PMC article. Review.
-
Fluctuating Regional Brainstem Diffusion Imaging Measures of Microstructure across the Migraine Cycle.eNeuro. 2019 Jul 25;6(4):ENEURO.0005-19.2019. doi: 10.1523/ENEURO.0005-19.2019. Print 2019 Jul/Aug. eNeuro. 2019. PMID: 31300542 Free PMC article.
-
Microstructural changes in the trigeminal nerve of patients with episodic migraine assessed using magnetic resonance imaging.J Headache Pain. 2020 May 29;21(1):59. doi: 10.1186/s10194-020-01126-1. J Headache Pain. 2020. PMID: 32471359 Free PMC article.
-
Altered brainstem anatomy in migraine.Cephalalgia. 2018 Mar;38(3):476-486. doi: 10.1177/0333102417694884. Epub 2017 Feb 20. Cephalalgia. 2018. PMID: 28952339
-
Is Migraine Associated to Brain Anatomical Alterations? New Data and Coordinate-Based Meta-analysis.Brain Topogr. 2021 May;34(3):384-401. doi: 10.1007/s10548-021-00824-6. Epub 2021 Feb 19. Brain Topogr. 2021. PMID: 33606142
Cited by
-
Inhibition of endocannabinoid hydrolases MAGL, FAAH and ABHD6 by AKU-005 reduces ex vivo cortical spreading depression.J Headache Pain. 2025 Apr 23;26(1):85. doi: 10.1186/s10194-025-02030-2. J Headache Pain. 2025. PMID: 40269679 Free PMC article.
-
Functional MRI and Diffusion Tensor Imaging in Migraine: A Review of Migraine Functional and White Matter Microstructural Changes.J Cent Nerv Syst Dis. 2023 Oct 27;15:11795735231205413. doi: 10.1177/11795735231205413. eCollection 2023. J Cent Nerv Syst Dis. 2023. PMID: 37900908 Free PMC article. Review.
References
LinkOut - more resources
Full Text Sources
Miscellaneous