[Preprint]. 2022 Jul 27:rs.3.rs-1840065.
doi: 10.21203/rs.3.rs-1840065/v1.

Contact tracing reveals community transmission of COVID-19 in New York City

Affiliations

Contact tracing reveals community transmission of COVID-19 in New York City

Sen Pei et al. Res Sq. .

Update in

Abstract

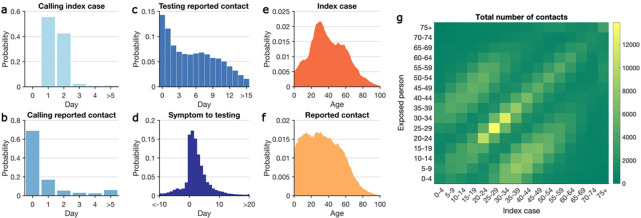
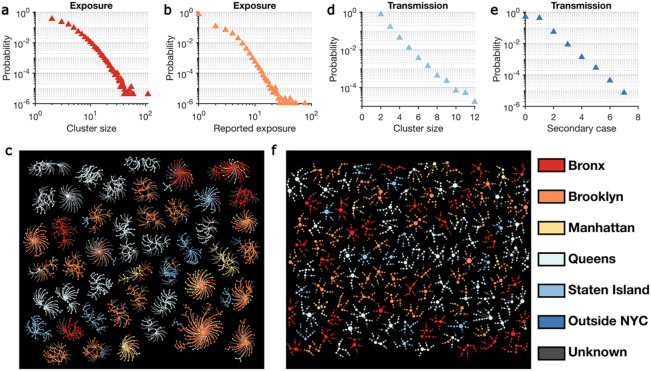
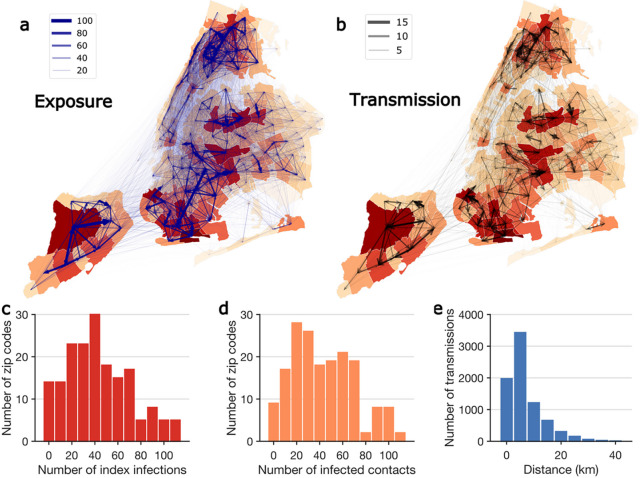
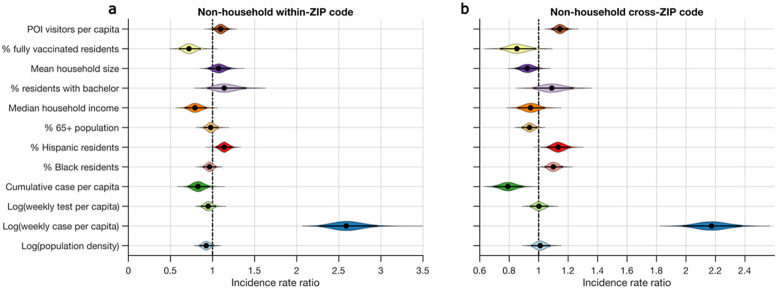
Understanding SARS-CoV-2 transmission within and among communities is critical for tailoring public health policies to local context. However, analysis of community transmission is challenging due to a lack of high-resolution surveillance and testing data. Here, using contact tracing records for 644,029 cases and their contacts in New York City during the second pandemic wave, we provide a detailed characterization of the operational performance of contact tracing and reconstruct exposure and transmission networks at individual and ZIP code scales. We find considerable heterogeneity in reported close contacts and secondary infections and evidence of extensive transmission across ZIP code areas. Our analysis reveals the spatial pattern of SARS-CoV-2 spread and communities that are tightly interconnected by exposure and transmission. We find that higher vaccination coverage and reduced numbers of visitors to points-of-interest are associated with fewer within- and cross-ZIP code transmission events, highlighting potential measures for curtailing SARS-CoV-2 spread in urban settings.


Conflict of interest statement

Competing Interest: J.S. and Columbia University disclose partial ownership of SK Analytics. J.S. discloses consulting for BNI. All other authors declare no competing interests.

Figures

Figure 1
Figure 1
Key statistics of contact tracing in NYC. Panels (a-d) show the distributions of: (a) time between reporting date for index cases and being called by contact tracers; (b) time between calling index cases and notifying exposed persons; (c) time between notifying exposed persons and specimen sampling of notified individuals who were tested; (d) time from symptom onset to specimen sampling for symptomatic COVID infections. A negative value implies that testing preceded symptom onset. Age distributions of index cases (e) and self-reported contacts (f). The contact mixing matrix (g) shows the total number of exposures among age groups reported during the study period.
Figure 2
Figure 2
Structure of exposure and transmission networks. (a) and (b) show the distributions of cluster size and number of close contacts reported by each index case in the exposure network. Exposure clusters with more than 35 individuals are visualized in (c). The exposure network is undirected. Index cases and reported close contacts are connected. Node size is proportional to the number of connected individuals. Colors indicate the home location of each person (five boroughs in NYC, outside NYC, and unknown). The distributions of cluster size and the number of secondary cases in the transmission network are shown in (d) and (e), respectively. Panel (f) visualizes transmission clusters with more than six infected individuals. Node size represents the number of secondary cases. Arrows indicate the direction of transmission.
Figure 3
Figure 3
Spatial transmission of SARS-CoV-2 in NYC. (a) and (b) show the exposures and transmission events across ZIP codes in NYC identified from contact tracing data. Arrows indicate direction of exposure (from index cases to reported close contacts) and transmission (from index infections to infected contacts). Arrow thickness indicates the number of exposures and transmission events. ZIP code area color represents the cumulative number of confirmed cases during the study period (yellow to red – low to high). For cross-ZIP code transmission events, the distributions of index infections and infected contacts across ZIP code areas are presented in (c) and (d). Panel (e) shows the distribution of distance between home ZIP codes of index infections and infected contacts in cross-ZIP code transmission events. The population weighted centroids for ZIP code areas were used to compute the distance.
Figure 4
Figure 4
Effects of various features on the transmission of SARS-CoV-2 in NYC. Incidence rate ratios (exponentiated coefficients) for non-household within-ZIP code transmission and cross-ZIP code transmission are shown for 12 covariates in (a) and (b), respectively (Deviance information criterion, DIC=6,342 for a and DIC=12,644 for b). Coefficients were estimated using a Poisson generalized linear mixed model controlling for spatial-temporal autocorrelations. We used the log-transformed population as the offset in the regression model. Covariates were standardized and are shown on the y-axis. The incidence rate ratio quantifies the multiplicative change in the number of transmission events per each covariate increase of one standard deviation, controlling for other covariates. The violin plots show the distributions of incidence rate ratios. Black dots and horizontal black lines highlight the median estimates and 95% CIs.

References

    1. Chang S. et al. Mobility network models of COVID-19 explain inequities and inform reopening. Nature 589, 82–87 (2021). - PubMed
    1. Brauner J. M. et al. Inferring the effectiveness of government interventions against COVID-19. Science 371, (2021). - PMC - PubMed
    1. Lamb M. R., Kandula S. & Shaman J. Differential COVID-19 case positivity in New York City neighborhoods: Socioeconomic factors and mobility. Influenza Other Respir. Viruses 15, 209–217 (2021). - PMC - PubMed
    1. Lee E. C., Wada N. I., Grabowski M. K., Gurley E. S. & Lessler J. The engines of SARS-CoV-2 spread. Science 370, 406–407 (2020). - PubMed
    1. Davis J. T. et al. Cryptic transmission of SARS-CoV-2 and the first COVID-19 wave. Nature 600, 127–132 (2021). - PMC - PubMed

Publication types

LinkOut - more resources