

This is a preprint.
Projecting COVID-19 Cases and Subsequent Hospital Burden in Ohio
- PMID: 35923319
- PMCID: PMC9347277
- DOI: 10.1101/2022.07.27.22278117
Projecting COVID-19 Cases and Subsequent Hospital Burden in Ohio
Update in
-
Projecting COVID-19 cases and hospital burden in Ohio.J Theor Biol. 2023 Mar 21;561:111404. doi: 10.1016/j.jtbi.2022.111404. Epub 2023 Jan 7. J Theor Biol. 2023. PMID: 36627078 Free PMC article.
Abstract
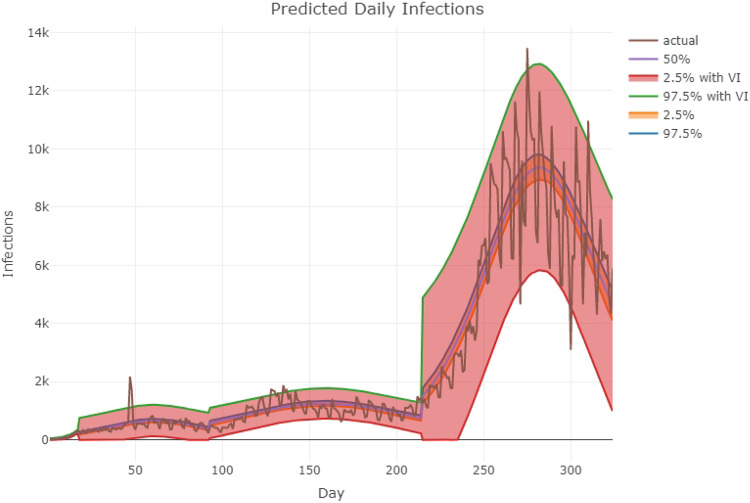
As the Coronavirus 2019 (COVID-19) disease started to spread rapidly in the state of Ohio, the Ecology, Epidemiology and Population Health (EEPH) program within the Infectious Diseases Institute (IDI) at the Ohio State University (OSU) took the initiative to offer epidemic modeling and decision analytics support to the Ohio Department of Health (ODH). This paper describes the methodology used by the OSU/IDI response modeling team to predict statewide cases of new infections as well as potential hospital burden in the state. The methodology has two components: 1) A Dynamic Survival Analysis (DSA)-based statistical method to perform parameter inference, statewide prediction and uncertainty quantification. 2) A geographic component that down-projects statewide predicted counts to potential hospital burden across the state. We demonstrate the overall methodology with publicly available data. A Python implementation of the methodology has been made available publicly.
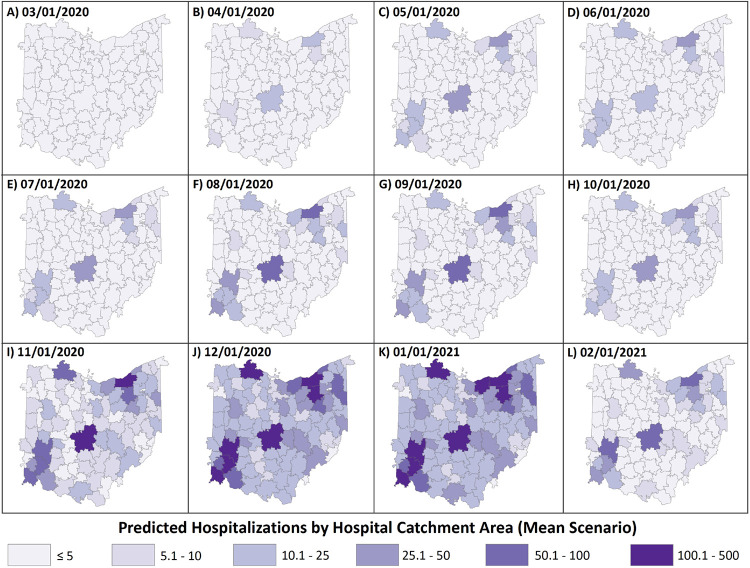
Highlights: We present a novel statistical approach called Dynamic Survival Analysis (DSA) to model an epidemic curve with incomplete data. The DSA approach is advantageous over standard statistical methods primarily because it does not require prior knowledge of the size of the susceptible population, the overall prevalence of the disease, and also the shape of the epidemic curve.The principal motivation behind the study was to obtain predictions of case counts of COVID-19 and the resulting hospital burden in the state of Ohio during the early phase of the pandemic.The proposed methodology was applied to the COVID-19 incidence data in the state of Ohio to support the Ohio Department of Health (ODH) and the Ohio Hospital Association (OHA) with predictions of hospital burden in each of the Hospital Catchment Areas (HCAs) of the state.
Figures
References
-
- , . The Dartmouth Atlas of Healthcare. URL: https://www.dartmouthatlas.org/faq/#research-methods-faq. https://www.dartmouthatlas.org/faq/#research-methods-faq.
-
- Ball F., Neal P., 2008. Network epidemic models with two levels of mixing. Mathematical Biosciences 212, 69–87. - PubMed
-
- Bartlett M.S., 1960. Stochastic population models in ecology and epidemiology. Methuen.
-
- Bastian C.D., KhudaBukhsh W.R., 2020. Python Code for Fitting DSA Analysis. https://github.com/wasiur/dynamic_survival_analysis.
-
- Bastian C.D., KhudaBukhsh W.R., Pan Y., Kenah E., Rempala G.A., . Predicting the size and duration of the outbreaks of covid-19 under minimal assumptions. Technical Report, The Ohio State University College of Public Health, April 2020.
Publication types
Grants and funding
LinkOut - more resources
Full Text Sources
Research Materials