

The Response of Fecal Microbiota and Host Metabolome in Dairy Cows Following Rumen Fluid Transplantation
- PMID: 35923396
- PMCID: PMC9343124
- DOI: 10.3389/fmicb.2022.940158
The Response of Fecal Microbiota and Host Metabolome in Dairy Cows Following Rumen Fluid Transplantation
Abstract
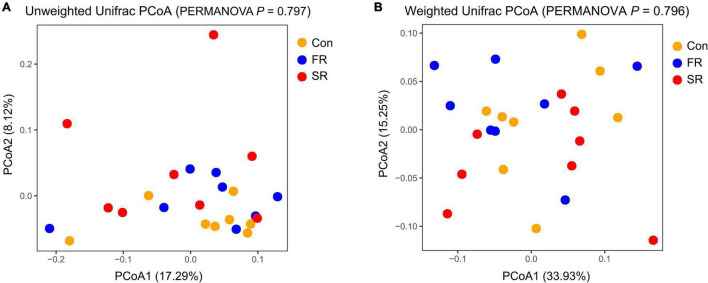
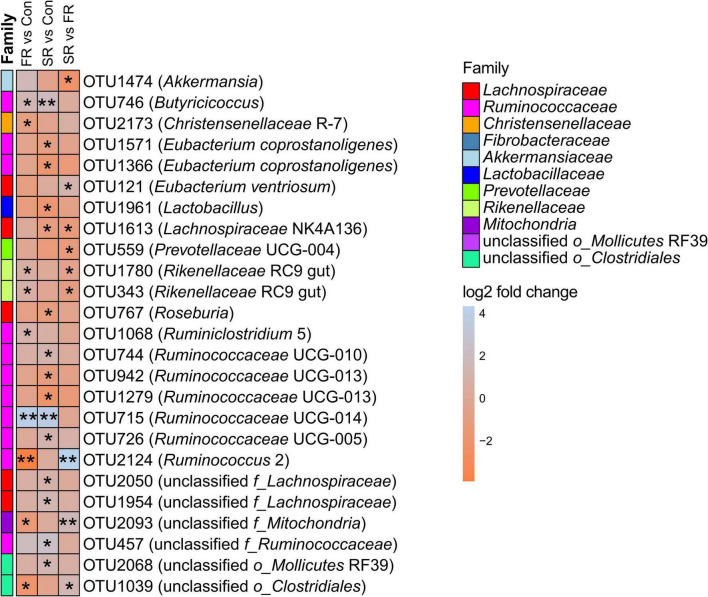
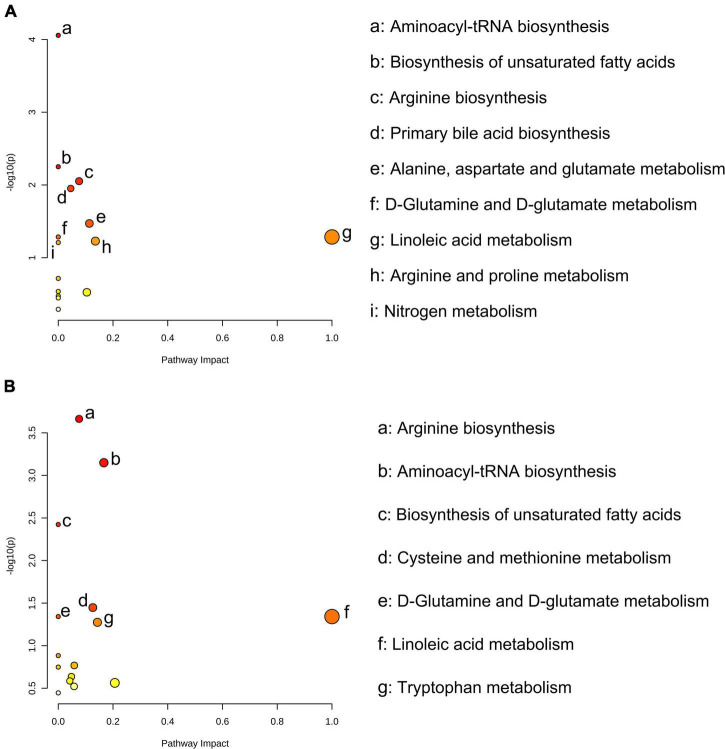
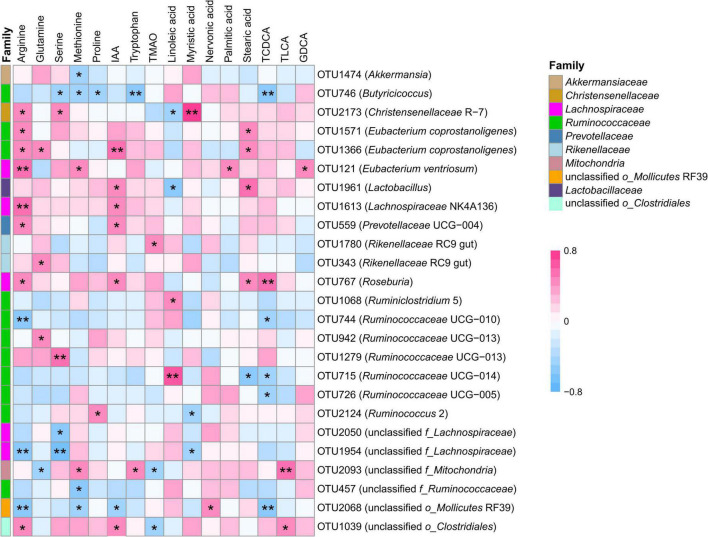
Rumen fluid transplantation (RFT) has been used to rebuild rumen bacterial homeostasis, reshape rumen function, and restore rumen fermentation, whereas the effect of RFT on fecal microbiota and host metabolism in cows remains poorly understood. In our study, a combination of 16S rRNA sequencing and serum non-targeted metabolomics was performed to investigate the response of fecal microbiota and serum metabolome in dairy cows following RFT. Twenty-four prepartum dairy cows were randomly assigned to 3 groups (n = 8) for infusion of either saline (Con), fresh rumen fluid (FR), or sterilized rumen fluid (SR) after calving. Fourteen days after calving, fecal microbiota and serum metabolome were analyzed. The sequencing data of fecal samples revealed no changes in alpha diversity and relative abundance of dominant genera such as Ruminococcaceae UCG-005, Rikenellaceae RC9 gut and Eubacterium coprostanoligenes. However, the other genus level taxa, such as Eubacterium oxidoreducens, Anaerorhabdus furcosa, Bacillus and Selenomonas, showed distinct changes following RFT. Serum metabolome analysis showed that FR or SR infusion affected amino acids metabolism, bile acids metabolism and fatty acids metabolism (including linoleic acid, oleic acid and palmitic acid). Furthermore, correlation analysis showed that taxa from genera Clostridiales were positively correlated with metabolites involved in tryptophan and bile acid metabolisms, such as OTU1039 from genera unclassified o_Clostridiales was positively correlated to indoleacetic acid and taurolithocholic acid. These results suggest that RFT altered the composition of the fecal microbiota and modulated microbial metabolic pathways, which is vital for the development and safety assessment of rumen microbial intervention strategies.
Keywords: dairy cows; fecal microbiota; rumen microbiota transplantation; sequencing; serum metabolome.
Copyright © 2022 Huang, Zheng, Men, Wang and Li.
Conflict of interest statement
The authors declare that the research was conducted in the absence of any commercial or financial relationships that could be construed as a potential conflict of interest.
Figures
References
-
- Benjamini Y., Hochberg Y. (1995). Controlling the false discovery rate: a practical and powerful approach to multiple testing. J. Royal. Statis. Soc. 57 289–300. 10.1111/j.2517-6161.1995.tb02031.x - DOI
LinkOut - more resources
Full Text Sources
Research Materials