

Bioinformatics Analysis Identifies Potential Related Genes in the Pathogenesis of Intrauterine Fetal Growth Retardation
- PMID: 35923419
- PMCID: PMC9340335
- DOI: 10.1177/11769343221112780
Bioinformatics Analysis Identifies Potential Related Genes in the Pathogenesis of Intrauterine Fetal Growth Retardation
Abstract
Background: Intrauterine growth retardation (IUGR) affects approximately 10% to 15% of all pregnancies worldwide. IUGR is not only associated with stillbirth and newborn death, but also the delay of cognition in childhood and the promotion of metabolic and vascular disorders in adulthood. Figuring out the mechanism of IUGR is rather meaningful and valuable.
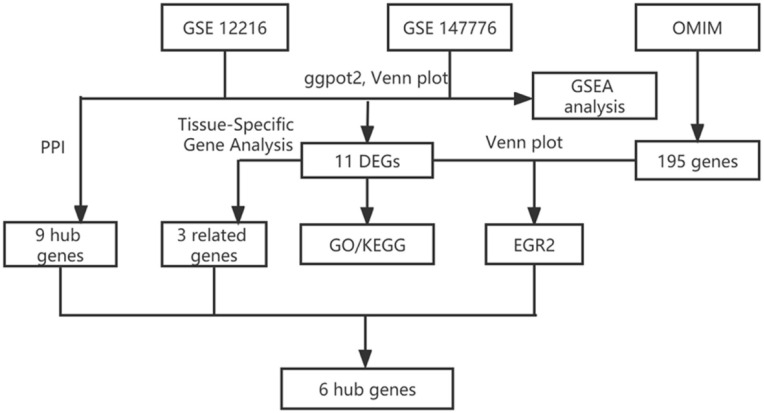
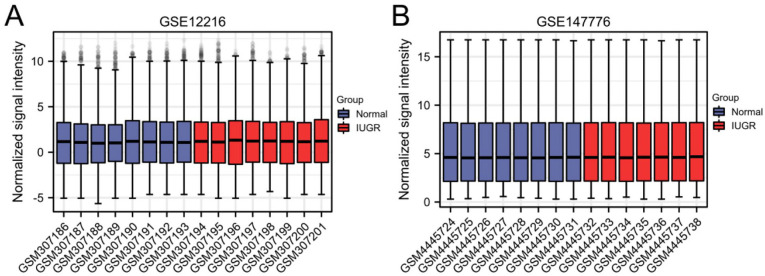
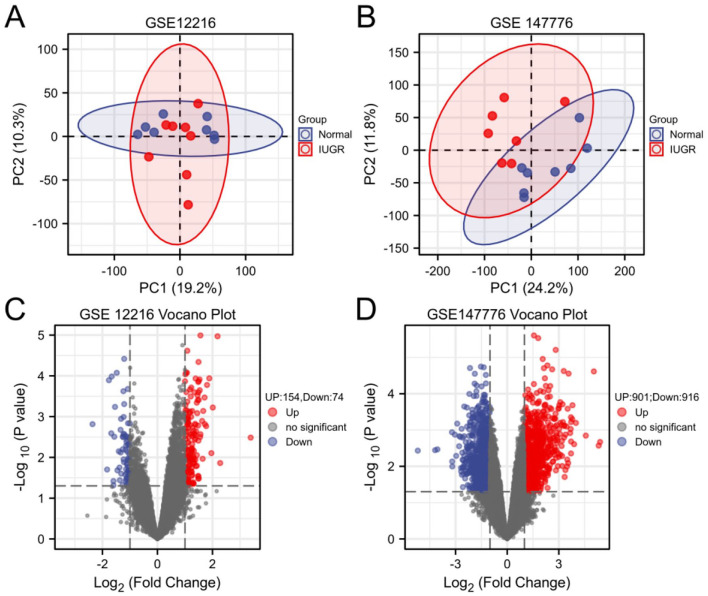
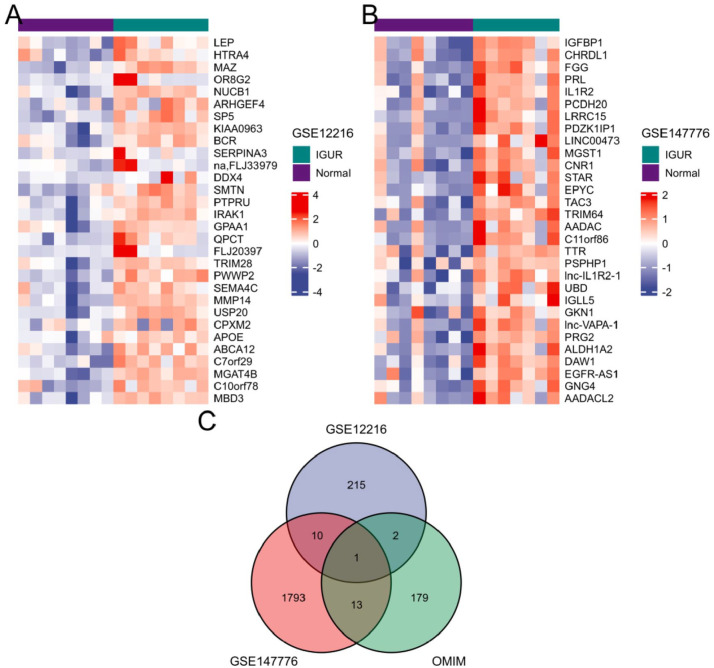
Methods: Datasets related to IUGR were searched in the Gene Expression Omnibus website. Principal component analysis (PCA) was used for normalization. Differential expressed genes (DEGs) were screened out using the ggpot2 tool. DEGs were used to conduct Gene Ontology (GO) terms, Kyoto Encyclopedia of Genes and Genomes (KEGG) pathways enrichment analyses, and protein-protein interaction (PPI) analysis. IUGR related genes were searched in the OMIM website to look for the intersection with the DEGs. The DEGs were analyzed for tissue-specific expression by the online resource BioGPS. The results were displayed through volcano map, Venn map, box plot, heat map, and GSEA enrichment plots drawn by R language packages.
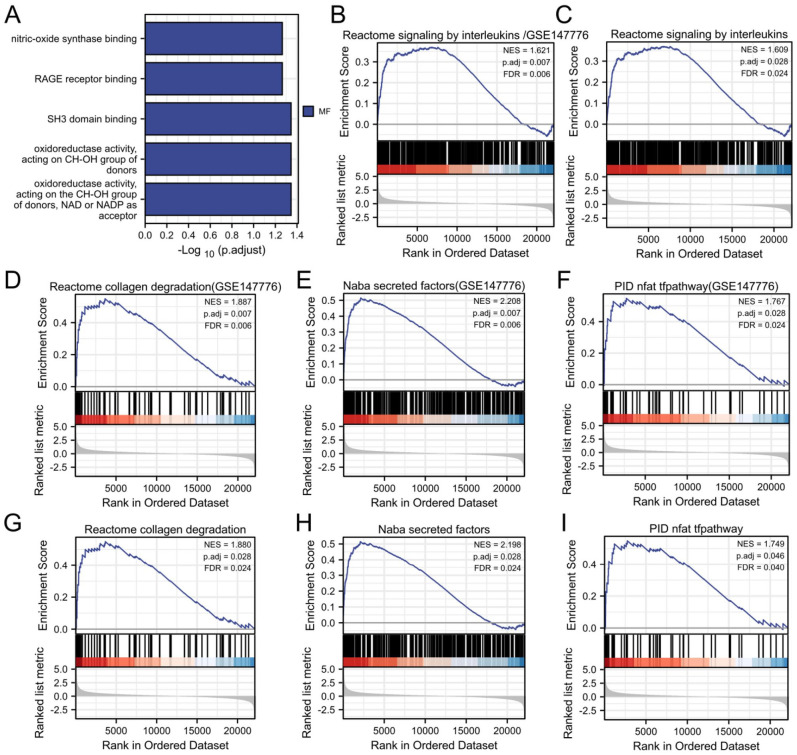
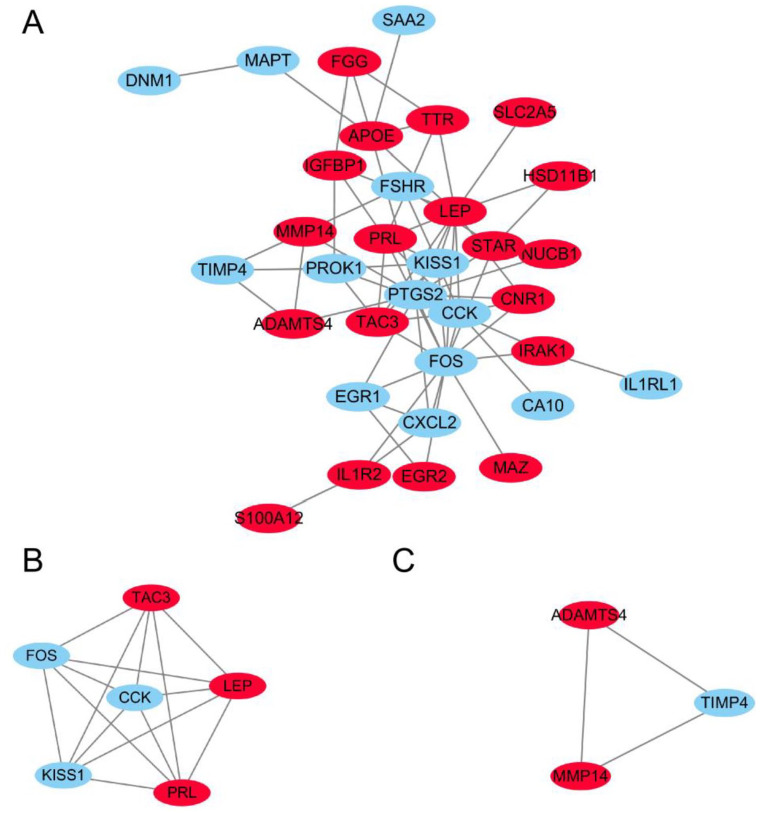
Results: Eleven DEGs were screened out of 2 datasets. One hundred ninety-five genes related to IUGR in OMIM were retrieved. EGR2 was the only intersection gene that was found in both groups. Genes associated with placental tissue expression include COL17A1, HSD11B1, and LGALS14. Molecular functions of the DEGs are related to the oxidoreductase activity. The following 4 signaling pathways, reactome signaling by interleukins, reactome collagen degradation, Naba secreted factors, and PID NFAT tfpathway, were enriched by GSEA. Two critical modules comprising 5 up-regulated genes (LEP, PRL, TAC3, MMP14, and ADAMTS4) and 4 down-regulated genes (TIMP4, FOS, CCK, and KISS1) were identified by PPI analysis. Finally, we identified 6 genes (PRL, LGALS14, EGR2, TAC3, LEP, and KISS1) that are potentially relevant to the pathophysiology of IUGR.
Conclusion: The candidate down-regulated genes LGALS14 and KISS1, as well as the up-regulated genes PRL, EGR2, TAC3, and LEP, were found to be closely related to IUGR by bioinformatics analysis. These hub genes are related to hypoxia and oxidoreductase activities in placental development. We provide useful and novel information to explore the potential mechanism of IUGR and make efforts to the prevention of IUGR.
Keywords: IUGR; Intrauterine fetal growth retardation; bioinformatics analysis; differentially expressed genes; microarray expression profiling dataset.
© The Author(s) 2022.
Conflict of interest statement
Declaration of Conflicting Interests: The author(s) declared no potential conflicts of interest with respect to the research, authorship, and/or publication of this article.
Figures
Similar articles
-
Identification of key genes in pathogenesis of placental insufficiency intrauterine growth restriction.BMC Pregnancy Childbirth. 2022 Jan 28;22(1):77. doi: 10.1186/s12884-022-04399-3. BMC Pregnancy Childbirth. 2022. PMID: 35090410 Free PMC article.
-
The identification of key genes and pathways in hepatocellular carcinoma by bioinformatics analysis of high-throughput data.Med Oncol. 2017 Jun;34(6):101. doi: 10.1007/s12032-017-0963-9. Epub 2017 Apr 21. Med Oncol. 2017. PMID: 28432618 Free PMC article.
-
Bioinformatics Analysis and Identification of Genes and Pathways in Ischemic Cardiomyopathy.Int J Gen Med. 2021 Sep 21;14:5927-5937. doi: 10.2147/IJGM.S329980. eCollection 2021. Int J Gen Med. 2021. PMID: 34584445 Free PMC article.
-
Identification of differentially expressed genes regulated by molecular signature in breast cancer-associated fibroblasts by bioinformatics analysis.Arch Gynecol Obstet. 2018 Jan;297(1):161-183. doi: 10.1007/s00404-017-4562-y. Epub 2017 Oct 23. Arch Gynecol Obstet. 2018. PMID: 29063236
-
Screening for biomarkers of tuberous sclerosis complex-associated epilepsy: a bioinformatics analysis.Transl Pediatr. 2024 Jul 31;13(7):1190-1200. doi: 10.21037/tp-24-211. Epub 2024 Jul 29. Transl Pediatr. 2024. PMID: 39144436 Free PMC article.
Cited by
-
Impact of weight variation on the microbiome of yak dams and calves.Front Microbiol. 2024 Sep 18;15:1465992. doi: 10.3389/fmicb.2024.1465992. eCollection 2024. Front Microbiol. 2024. PMID: 39360324 Free PMC article.
References
-
- Martins JG, Biggio JR, Abuhamad A. Society for Maternal-Fetal Medicine Consult Series #52: diagnosis and management of fetal growth restriction. Am J Obstet Gynecol. 2020;223:B2-B17. - PubMed
-
- Bukowski R. Stillbirth and fetal growth restriction. Clin Obstet Gynecol. 2010;53:673-680. - PubMed
-
- Page JM, Blue NR, Silver RM. Fetal growth and stillbirth. Obstet Gynecol Clin North Am. 2021;48:297-310. - PubMed
-
- Crispi F, Miranda J, Gratacós E. Long-term cardiovascular consequences of fetal growth restriction: biology, clinical implications, and opportunities for prevention of adult disease. Am J Obstet Gynecol. 2018;218:S869-S879. - PubMed
LinkOut - more resources
Full Text Sources
Miscellaneous
