

Development and Comparison of Predictive Models Based on Different Types of Influencing Factors to Select the Best One for the Prediction of OSAHS Prevalence
- PMID: 35923456
- PMCID: PMC9340571
- DOI: 10.3389/fpsyt.2022.892737
Development and Comparison of Predictive Models Based on Different Types of Influencing Factors to Select the Best One for the Prediction of OSAHS Prevalence
Abstract
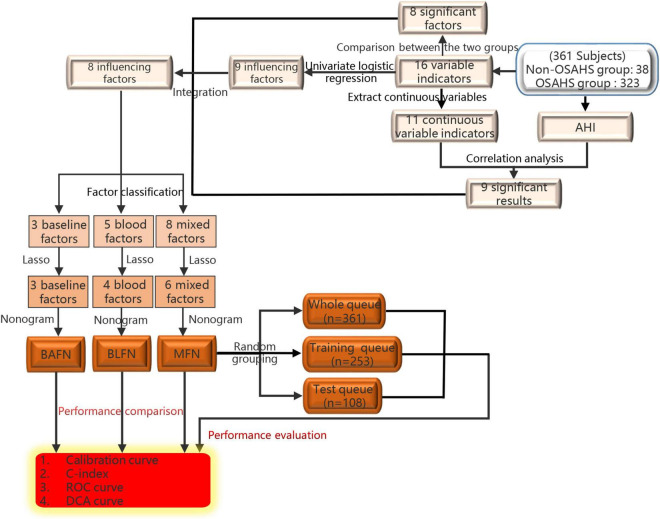
Objective: This study aims to retrospectively analyze numerous related clinical data to identify three types of potential influencing factors of obstructive sleep apnea-hypopnea syndrome (OSAHS) for establishing three predictive nomograms, respectively. The best performing one was screened to guide further clinical decision-making.
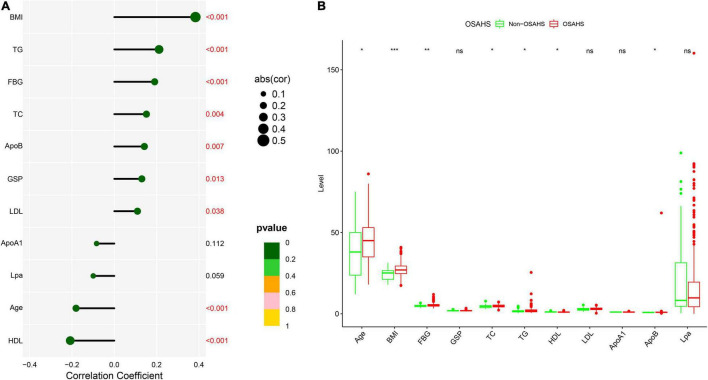
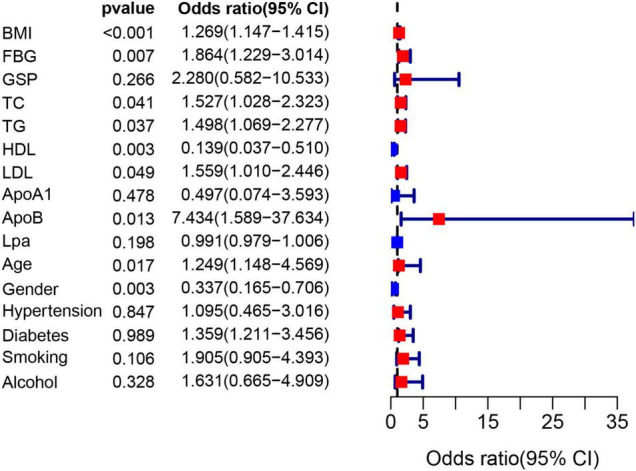
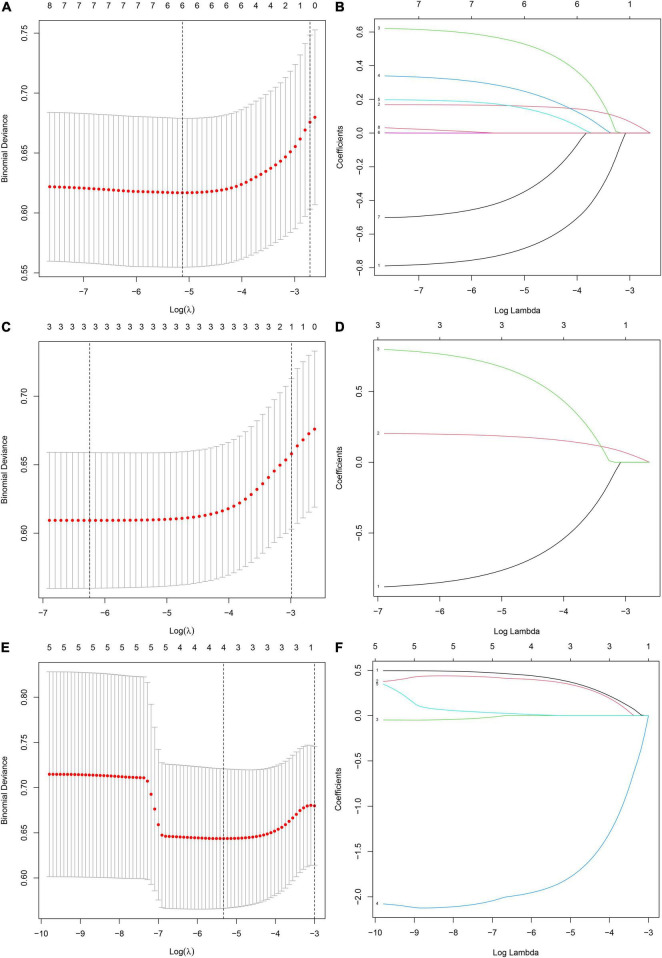
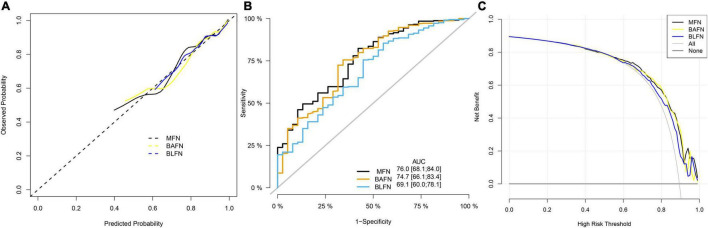
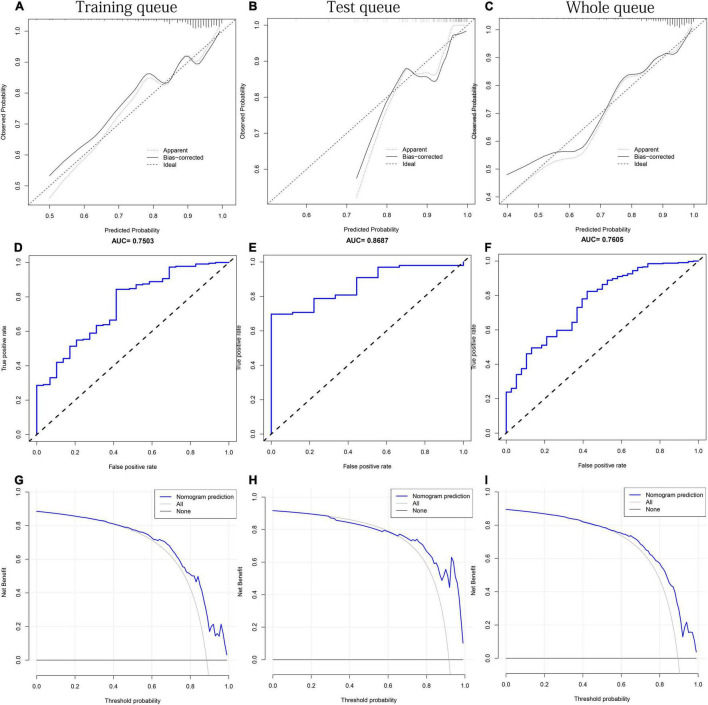
Methods: Correlation, difference and univariate logistic regression analysis were used to identify the influencing factors of OSAHS. Then these factors are divided into three different types according to the characteristics of the data. Lasso regression was used to filter out three types of factors to construct three nomograms, respectively. Compare the performance of the three nomograms evaluated by C-index, ROC curve and Decision Curve Analysis to select the best one. Two queues were obtained by randomly splitting the whole queue, and similar methods are used to verify the performance of the best nomogram.
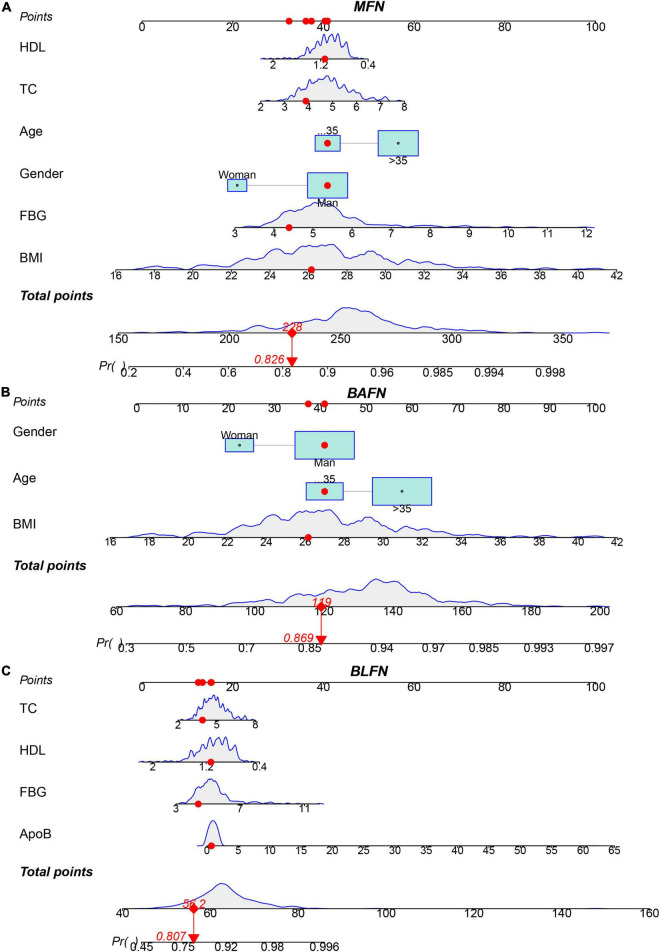
Results: In total, 8 influencing factors of OSAHS have been identified and divided into three types. Lasso regression finally determined 6, 3 and 4 factors to construct mixed factors nomogram (MFN), baseline factors nomogram (BAFN) and blood factors nomogram (BLFN), respectively. MFN performed best among the three and also performed well in multiple queues.
Conclusion: Compared with BAFN and BLFN constructed by single-type factors, MFN constructed by six mixed-type factors shows better performance in predicting the risk of OSAHS.
Keywords: blood glucose; blood lipid; nomogram; obstructive sleep apnea-hypopnea syndrome; risk prediction.
Copyright © 2022 Fan, He, Tong, Nie, Zhong and Lu.
Conflict of interest statement
The authors declare that the research was conducted in the absence of any commercial or financial relationships that could be construed as a potential conflict of interest.
Figures
Similar articles
-
A machine learning model to predict the risk of depression in US adults with obstructive sleep apnea hypopnea syndrome: a cross-sectional study.Front Public Health. 2024 Jan 8;11:1348803. doi: 10.3389/fpubh.2023.1348803. eCollection 2023. Front Public Health. 2024. PMID: 38259742 Free PMC article.
-
Development and validation of a clinical model to predict hypertension in consecutive patients with obstructive sleep apnea hypopnea syndrome: a hospital-based study and nomogram analysis.Am J Transl Res. 2022 Feb 15;14(2):819-830. eCollection 2022. Am J Transl Res. 2022. PMID: 35273687 Free PMC article.
-
[Analysis of influencing factors on circadian blood pressure of hypertensive patients with obstructive sleep apnea-hypopnea syndrome].Zhonghua Xin Xue Guan Bing Za Zhi. 2013 Sep;41(9):751-5. Zhonghua Xin Xue Guan Bing Za Zhi. 2013. PMID: 24331803 Chinese.
-
[Analysis of clinical characteristics and risk factors of obstructive sleep apnea hypopnea syndrome with hypertension].Zhonghua Yi Xue Za Zhi. 2016 Mar 1;96(8):605-9. doi: 10.3760/cma.j.issn.0376-2491.2016.08.005. Zhonghua Yi Xue Za Zhi. 2016. PMID: 26932852 Chinese.
-
Correlation between obstructive sleep apnea hypopnea syndrome and hypertension: a systematic review and meta-analysis.Ann Palliat Med. 2021 Dec;10(12):12251-12261. doi: 10.21037/apm-21-3302. Ann Palliat Med. 2021. PMID: 35016417
References
-
- Senaratna CV, Perret JL, Lodge CJ, Lowe AJ, Campbell BE, Matheson MC, et al. Prevalence of obstructive sleep apnea in the general population: a systematic review. Sleep Med Rev. (2017) 34:70–81. - PubMed
LinkOut - more resources
Full Text Sources