

Screening of the Key Genes and Signalling Pathways for Diabetic Nephropathy Using Bioinformatics Analysis
- PMID: 35923621
- PMCID: PMC9340545
- DOI: 10.3389/fendo.2022.864407
Screening of the Key Genes and Signalling Pathways for Diabetic Nephropathy Using Bioinformatics Analysis
Abstract
Background: This study aimed to identify biological markers for diabetic nephropathy (DN) and explore their underlying mechanisms.
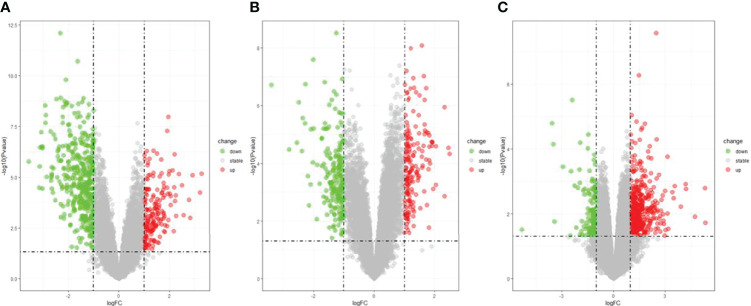
Methods: Four datasets, GSE30528, GSE47183, GSE104948, and GSE96804, were downloaded from the Gene Expression Omnibus (GEO) database. The differentially expressed genes (DEGs) were identified using the "limma" package, and the "RobustRankAggreg" package was used to screen the overlapping DEGs. The hub genes were identified using cytoHubba of Cytoscape. Logistic regression analysis was used to further analyse the hub genes, followed by receiver operating characteristic (ROC) curve analysis to predict the diagnostic effectiveness of the hub genes. Correlation analysis and enrichment analysis of the hub genes were performed to identify the potential functions of the hub genes involved in DN.
Results: In total, 55 DEGs, including 38 upregulated and 17 downregulated genes, were identified from the three datasets. Four hub genes (FN1, CD44, C1QB, and C1QA) were screened out by the "UpSetR" package, and FN1 was identified as a key gene for DN by logistic regression analysis. Correlation analysis and enrichment analysis showed that FN1 was positively correlated with four genes (COL6A3, COL1A2, THBS2, and CD44) and with the development of DN through the extracellular matrix (ECM)-receptor interaction pathway.
Conclusions: We identified four candidate genes: FN1, C1QA, C1QB, and CD44. On further investigating the biological functions of FN1, we showed that FN1 was positively correlated with THBS2, COL1A2, COL6A3, and CD44 and involved in the development of DN through the ECM-receptor interaction pathway. THBS2, COL1A2, COL6A3, and CD44 may be novel biomarkers and target therapeutic candidates for DN.
Keywords: FN1; bioinformatic analysis; biomarkers; diabetic nephropathy; differentially expressed genes.
Copyright © 2022 Li, Feng, Zhong, Lu, Gao and Zhang.
Conflict of interest statement
The authors declare that the research was conducted in the absence of any commercial or financial relationships that could be construed as a potential conflict of interest.
Figures


Similar articles
-
Investigation of the Mechanism of Complement System in Diabetic Nephropathy via Bioinformatics Analysis.J Diabetes Res. 2021 May 24;2021:5546199. doi: 10.1155/2021/5546199. eCollection 2021. J Diabetes Res. 2021. PMID: 34124269 Free PMC article.
-
Integrating bioinformatics and machine learning to identify glomerular injury genes and predict drug targets in diabetic nephropathy.Sci Rep. 2025 May 15;15(1):16868. doi: 10.1038/s41598-025-01628-5. Sci Rep. 2025. PMID: 40374840 Free PMC article.
-
Identifying C1QB, ITGAM, and ITGB2 as potential diagnostic candidate genes for diabetic nephropathy using bioinformatics analysis.PeerJ. 2023 May 25;11:e15437. doi: 10.7717/peerj.15437. eCollection 2023. PeerJ. 2023. PMID: 37250717 Free PMC article.
-
Seven basement membrane-specific expressed genes are considered potential biomarkers for the diagnosis and treatment of diabetic nephropathy.Acta Diabetol. 2023 Apr;60(4):493-505. doi: 10.1007/s00592-022-02027-2. Epub 2023 Jan 11. Acta Diabetol. 2023. PMID: 36627452
-
Integrated Bioinformatics and Clinical Correlation Analysis of Key Genes, Pathways, and Potential Therapeutic Agents Related to Diabetic Nephropathy.Dis Markers. 2022 May 21;2022:9204201. doi: 10.1155/2022/9204201. eCollection 2022. Dis Markers. 2022. PMID: 35637650 Free PMC article.
Cited by
-
Single-cell RNA and transcriptome sequencing profiles identify immune-associated key genes in the development of diabetic kidney disease.Front Immunol. 2023 Mar 29;14:1030198. doi: 10.3389/fimmu.2023.1030198. eCollection 2023. Front Immunol. 2023. PMID: 37063851 Free PMC article.
-
A Multi-omics approach to identify and validate shared genetic architecture in rheumatoid arthritis, multiple sclerosis, and type 1 diabetes: integrating GWAS, GEO, MSigDB, and scRNA-seq data.Funct Integr Genomics. 2025 Apr 21;25(1):91. doi: 10.1007/s10142-025-01598-x. Funct Integr Genomics. 2025. PMID: 40254686 Free PMC article.
-
Integrative analyses of biomarkers and pathways for diabetic nephropathy.Front Genet. 2023 Apr 11;14:1128136. doi: 10.3389/fgene.2023.1128136. eCollection 2023. Front Genet. 2023. PMID: 37113991 Free PMC article.
-
To Develop Biomarkers for Diabetic Nephropathy Based on Genes Related to Fibrosis and Propionate Metabolism and Their Functional Validation.J Diabetes Res. 2024 Oct 16;2024:9066326. doi: 10.1155/2024/9066326. eCollection 2024. J Diabetes Res. 2024. PMID: 39444490 Free PMC article.
-
Identification of pyroptosis-related genes and potential drugs in diabetic nephropathy.J Transl Med. 2023 Jul 21;21(1):490. doi: 10.1186/s12967-023-04350-w. J Transl Med. 2023. PMID: 37480090 Free PMC article.
References
Publication types
MeSH terms
Substances
LinkOut - more resources
Full Text Sources
Medical
Miscellaneous