. 2022 Jul 18:13:905751.
doi: 10.3389/fgene.2022.905751. eCollection 2022.

Prognostic Model and Nomogram Construction and Validation With an Autophagy-Related Gene Signature in Low-Grade Gliomas

Affiliations

Prognostic Model and Nomogram Construction and Validation With an Autophagy-Related Gene Signature in Low-Grade Gliomas

Xinrui Li et al. Front Genet. .

Abstract

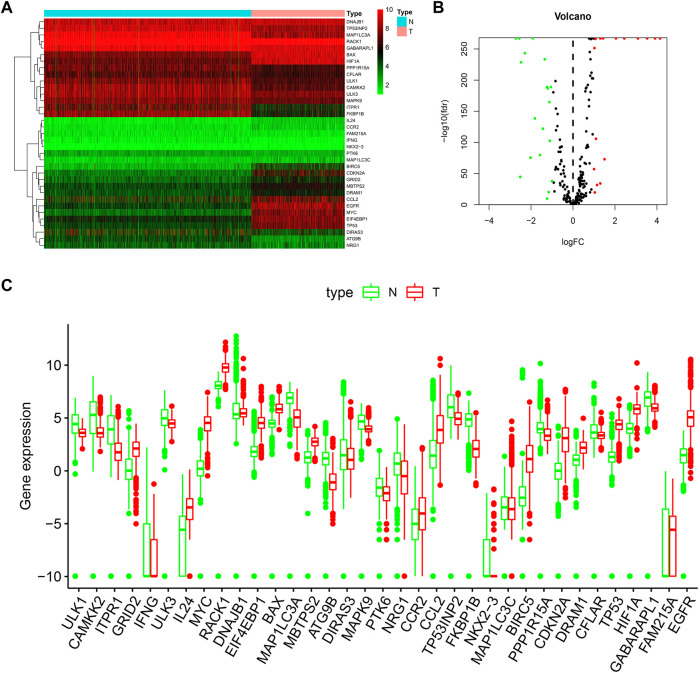
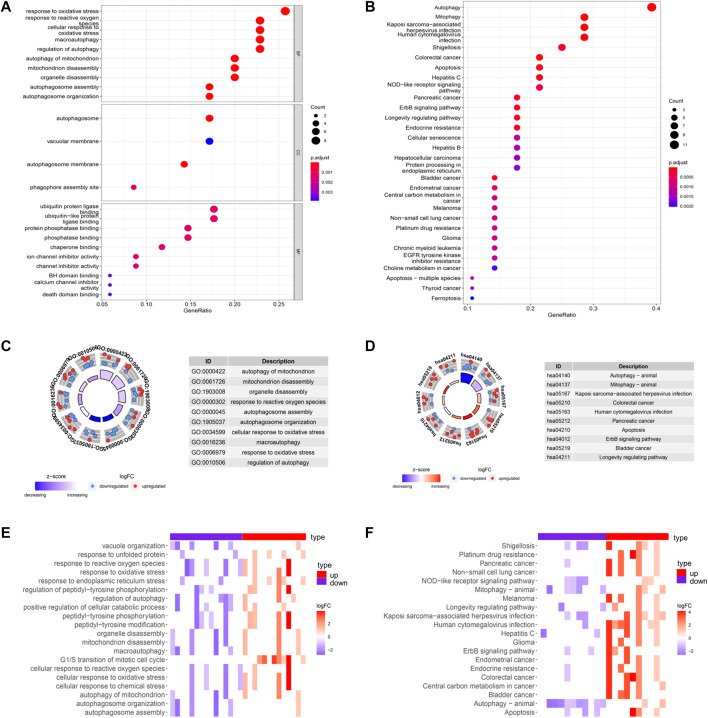
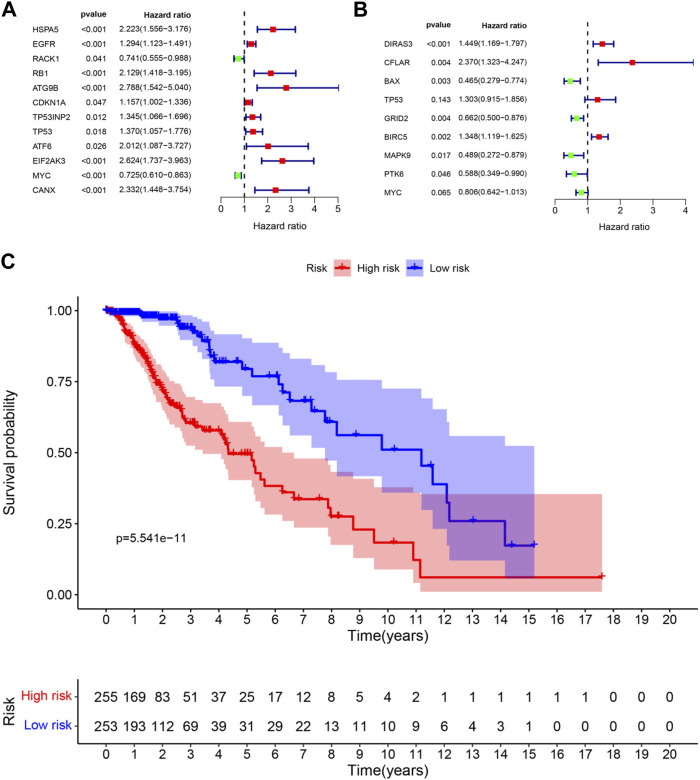
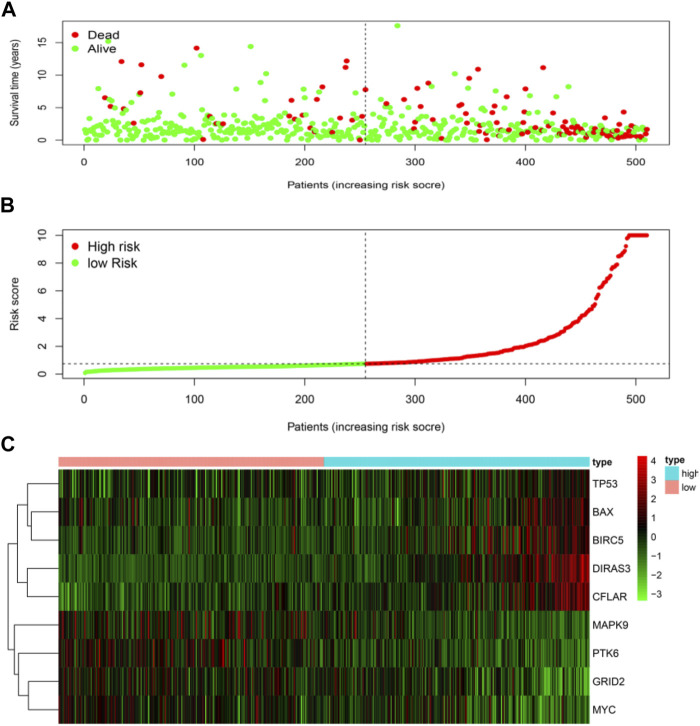
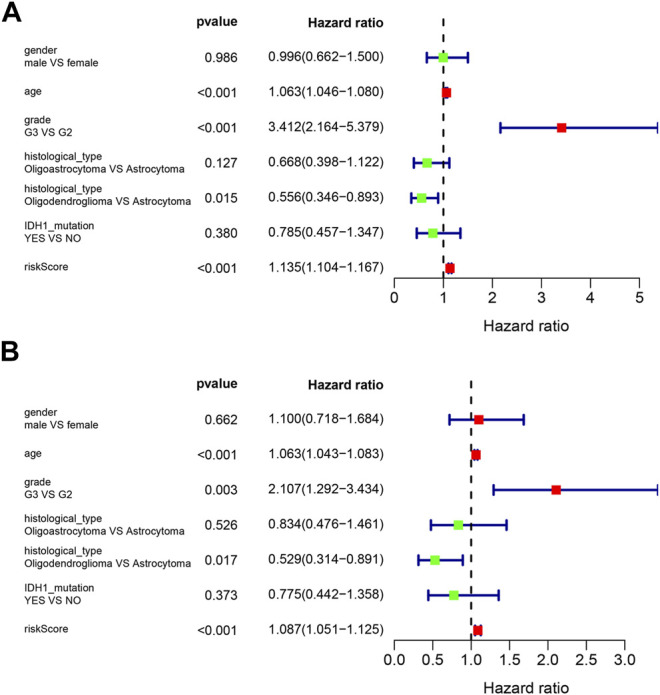
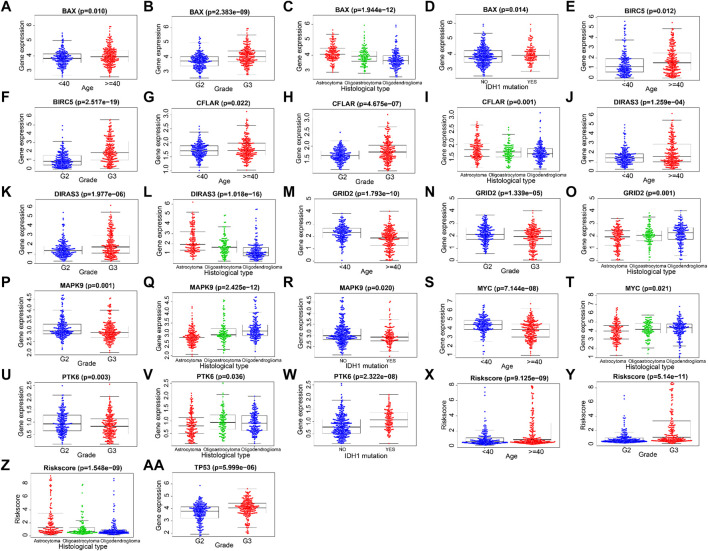
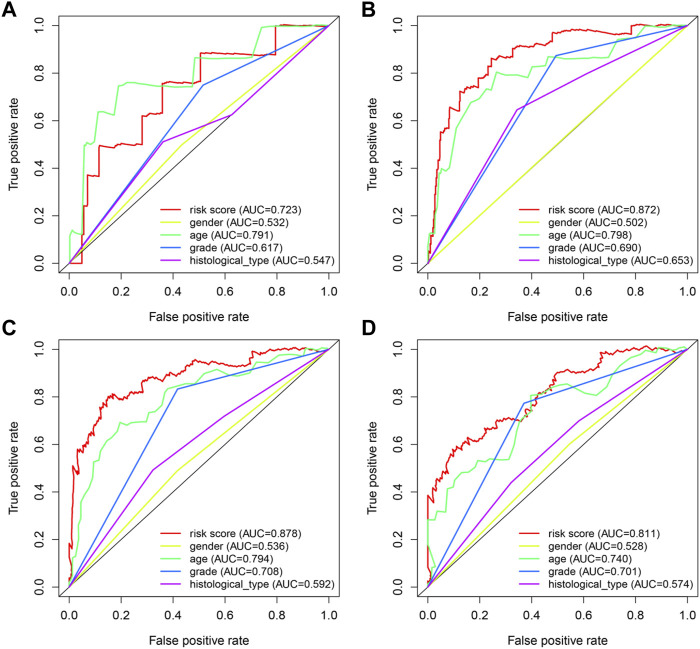
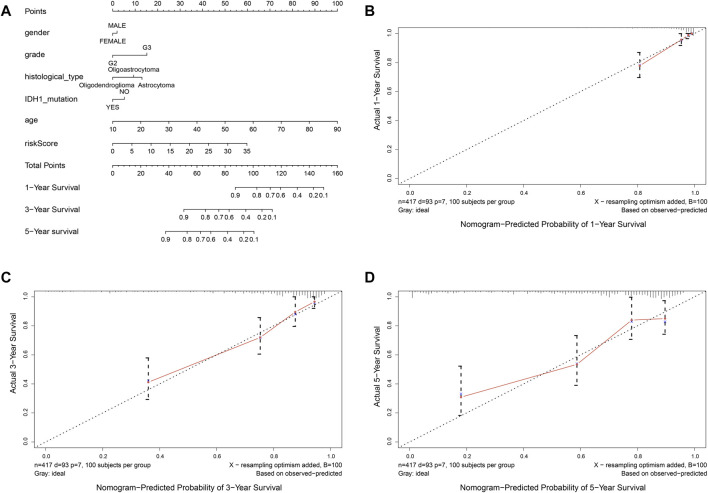
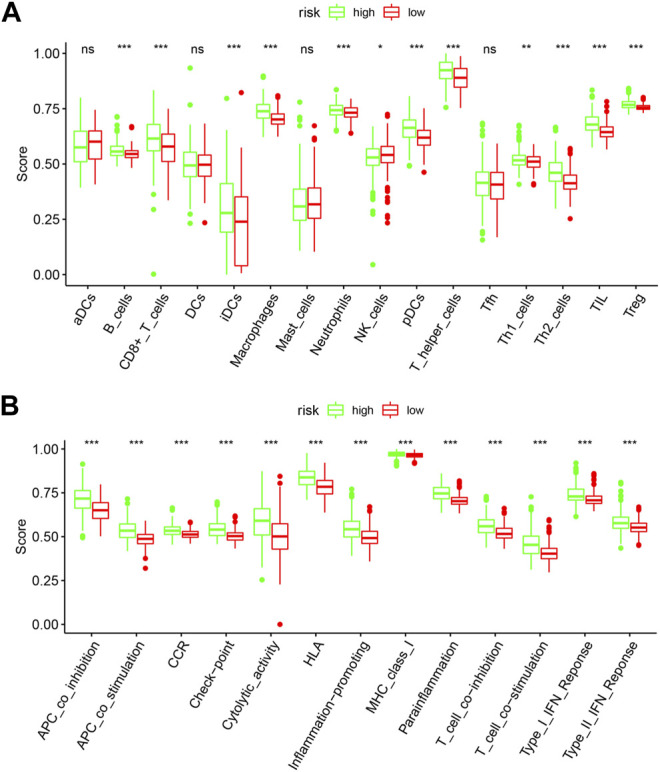
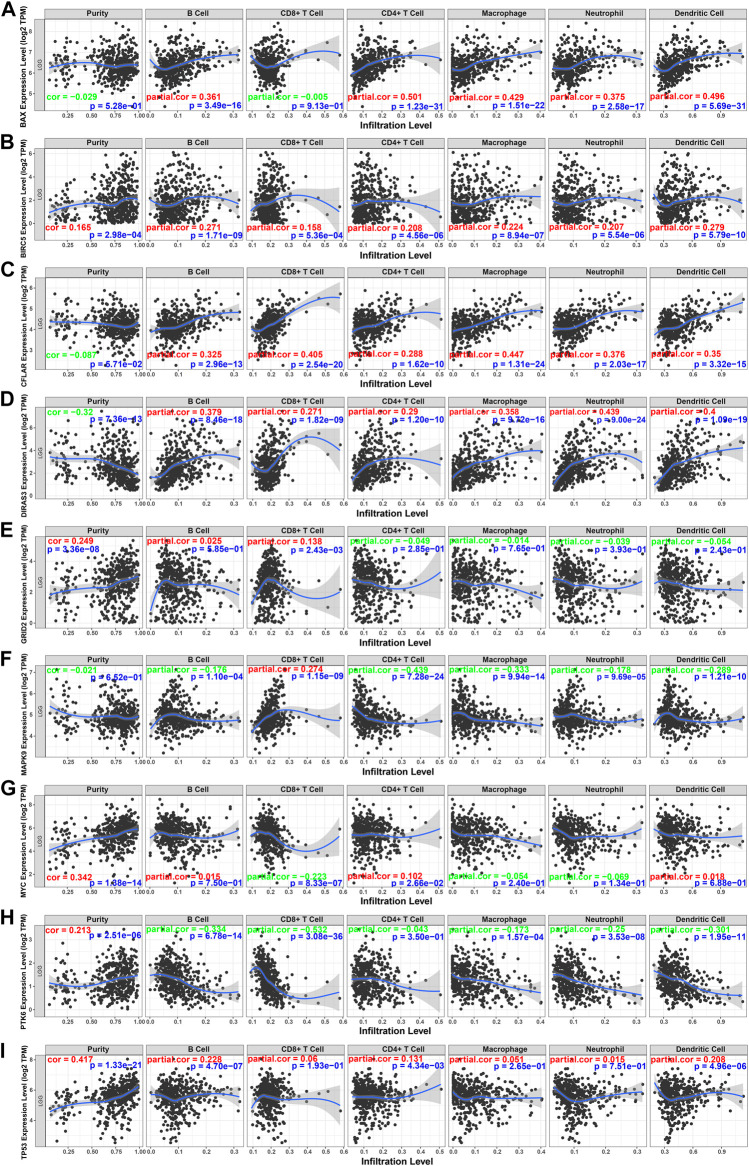
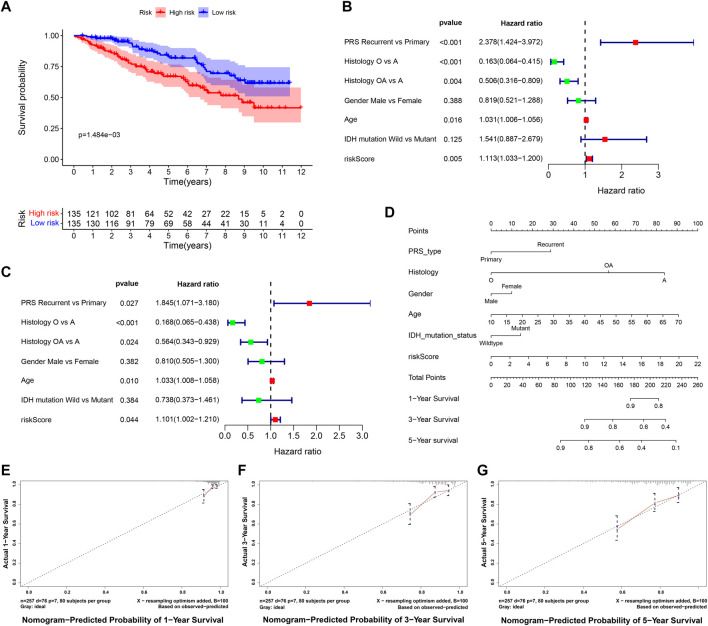
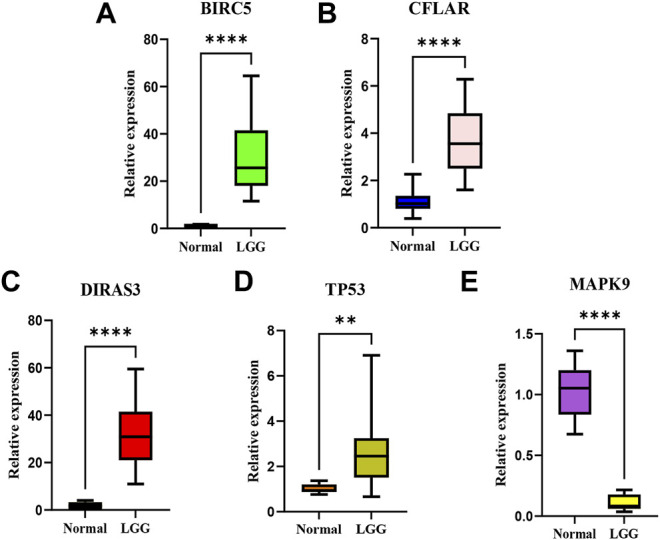
Background : Autophagy plays a vital role in cancer development. However, the prognostic value of autophagy-related genes (ARGs) in low-grade gliomas (LGG) is unclear. This research aimed to investigate whether ARGs correlated with overall survival (OS) in LGG patients. Methods: RNA-sequencing data were obtained from The Cancer Genome Atlas (TCGA) TARGET GTEx database. Gene Ontology and Kyoto Encyclopedia of Genes and Genomes enrichment analysis of ARGs were performed by the "clusterprofile" R package. Cox regression with the wald χ2 test was employed to identify prognostic significant ARGs. Next, the receiver operator characteristic curves were established to evaluate the feasibility of risk score ( riskscore = h 0 ( t ) exp ( j = 1 n Coef j × X j ) ) and other clinical risk factors to predict prognosis. A nomogram was constructed. Correlations between clinical features and ARGs were further verified by a t-test or Kruskal-Wallis test. In addition, the correlations between autophagy and immune cells were assessed through the single-sample gene set enrichment analysis (ssGSEA) and tumor immune estimation resource database. Last, the prediction model was verified by LGG data downloaded from the Chinese Glioma Genome Atlas (CGGA) database. Results: Overall, 35 DE-ARGs were identified. Functional enrichment analysis showed that these genes were mainly related to oxidative stress and regulation of autophagy. Nine ARGs (BAX, BIRC5, CFLAR, DIRAS3, GRID2, MAPK9, MYC, PTK6, and TP53) were significantly associated with OS. Age (Hazard ratio (HR) = 1.063, 95% CI: 1.046-1.080), grade (HR = 3.412, 95% CI: 2.164-5.379), histological type (HR = 0.556, 95% CI: 0.346-0.893), and risk score (HR = 1.135, 95% CI: 1.104-1.167) were independent prognostic risk factors (all p < 0.05). In addition, BIRC5, CFLAR, DIRAS3, TP53, and risk scores were found to correlate significantly with age and tumor grade (all p < 0.05). Immune cell enrichment analysis demonstrated that the types of immune cells and their expression levels in the high-risk group were significantly different from those in the low-risk group (all p < 0.05). A prognostic nomogram was constructed to predict 1-, 3-, and 5-year survival, and the prognostic value of sorted ARGs were verified in the CGGA database and clinical samples. Conclusion: Our findings suggest that the 9 DE-ARGs' risk score model could serve as diagnostic and prognostic biomarkers. The prognostic nomograms could be useful for individualized survival prediction and improved treatment strategies.

Keywords: HADb; TCGA TARGET GTEx; autophagy; bioinformatics analysis; low-grade gliomas (LGG); prognosis.


Conflict of interest statement

The authors declare that the research was conducted in the absence of any commercial or financial relationships that could be construed as a potential conflict of interest.

Figures

FIGURE 1
FIGURE 1
Distributions of DE-ARGs. (A) heatmap of DE-ARGs. Green represented down-regulated genes and red represented up-regulated genes. (B) volcano plot of SD-ARGs. Green dots represented 19 down-regulated genes; red dots represented 16 up-regulated genes. (C) box plot of DE-ARGs in normal brain tissues and tumor brain tissues (all p < 0.05).
FIGURE 2
FIGURE 2
GO and KEGG enrichments of DE-ARGs (A,B) showed the GO and KEGG enrichment analysis respectively. The larger bubble and darker color indicated the more significant enrichment process. (C,D) enrichment pathways in the GO and KEGG circle plots, respectively. The inner-circle indicated Z-score. The red color represented the significant enrichment. The outer circle indicated the various pathways, in which the blue dots indicated down-regulated genes, and the red was up-regulated genes. (E,F) heat maps of GO and KEGG enrichment, respectively. The red color represented the up-regulated genes, and purple represented the down-regulated genes.
FIGURE 3
FIGURE 3
Forest plots and Kaplan–Meier curve (A) forest plot of univariate Cox regression for 12 prognosis-related DE-ARGs; (B) forest plot of multivariate Cox regression for 9 sorted prognosis-related DE-ARGs; (C) Kaplan–Meier curve for LGG patients’ OS in the high-risk and low-risk groups when stratified by the autophagy-related risk score (FDR correction had been used for differential genetic screening, and p-values in Cox regression were provided by the wald χ2 test, and no further FDR correction is required.)
FIGURE 4
FIGURE 4
Risk score analyses of high and low-risk groups in tumor patients. (A) risk score scatters plot of high risk and low risk. Red dots represented the dead patients and green represented the alive. With the increase in risk scores, more patients died. (B) dotted line indicates the individual inflection point of the risk score curve, by which the patients were categorized into low-risk and high-risk groups. LGG patients were presented as red point (high-risk) and green point (low-risk). (C) risk score heatmap of nine ARGs. The colors from green to red indicate the expression level of genes varies from low to high.
FIGURE 5
FIGURE 5
Forest plots of prognostic risk factors (A) univariate Cox regression forest plot. (B) multivariate Cox regression forest plot of independent risk factors.
FIGURE 6
FIGURE 6
Correlations between ARGs and clinical features.
FIGURE 7
FIGURE 7
ROC curves of predicting survival. (A) 0.5-year ROC curve (B) 1-year ROC curve (C) 3-year ROC curve (D) 5-year ROC curve AUC: area under the curve. The larger AUC is, the more accurate it predicts.
FIGURE 8
FIGURE 8
Nomogram to predict the overall survival of patients who suffer from LGG. (A) nomogram to predict 1-, 3-, or 5-year OS. (B-D) calibration curve for nomogram to predict 1-, 3-, or 5-year OS. The x-axis is nomogram-predicted survival, and the y-axis is actual survival. The reference line is 45 inclined and indicates perfect calibration.
FIGURE 9
FIGURE 9
Comparison of the ssGSEA scores between the high-risk and low-risk groups. The score of 16 immune cells (A) and 13 immune-related functions (B) are displayed in boxplots. DCs: dendritic cells; iDCs: immature DCs; pDCs: plasmacytoid dendritic cells; TIL: tumor-infiltrating lymphocyte; CCR: cytokine-cytokine receptor; APC: antigen-presenting cells. Adjusted p-values were shown as the following: ns, not significant; *p < 0.05; **p < 0.01; ***p < 0.001.
FIGURE 10
FIGURE 10
Relations between immune cells and prognostic genes. (A) BAX expression level and immune cells in low-grade glioma; (B) BIRC5 and immune cells; (C) CFLAR and immune cells; (D) DIRAS3 and immune cells; (E) GRID2 and immune cells; (F) MAPK9 and immune cells; (G) MYC and immune cells; (H) PTK6 and immune cells; (I) TP53. TPM: transcripts per kilobase million. The red color in the correlation coefficient represents a positive correlation, and the green color represents a negative correlation.
FIGURE 11
FIGURE 11
Validation of risk score calculated by prognosis significant DE-ARGs (A) Kaplan–Meier analysis of patients from the high-risk group and low-risk group. (B,C) forest plot of univariate and multivariate Cox regression for prognosis indicators including risk score (histology types: A: Astrocytoma, O: Oligodendroglioma OA: Oligoastrocytoma). (D,G) nomogram with calibration curve in 1-year, 3-year, and 5-year.
FIGURE 12
FIGURE 12
The relative expression levels of the five genes in normal brain tissues and LGG tissues.The BIRC5 (A), CFLAR (B), DIRAS3 (C), and TP53 (D) were up-regulated, and MAPK9 (E) was significantly down-regulated in LGG tissues. **p < 0.01; ****p < 0.0001.

Similar articles

References

    1. Akashi E., Fujihara S., Morishita A., Tadokoro T., Chiyo T., Fujikawa K., et al. (2017). Effects of Galectin-9 on Apoptosis, Cell Cycle and Autophagy in Human Esophageal Adenocarcinoma Cells. Oncol. Rep. 38 (1), 506–514. 10.3892/or.2017.5689 - DOI - PubMed
    1. Amaravadi R. K., Kimmelman A. C., Debnath J. (2019). Targeting Autophagy in Cancer: Recent Advances and Future Directions. Cancer Discov. 9 (9), 1167–1181. 10.1158/2159-8290.cd-19-0292 - DOI - PMC - PubMed
    1. Brockman J. A., Alanee S., Vickers A. J., Scardino P. T., Wood D. P., Kibel A. S., et al. (2015). Nomogram Predicting Prostate Cancer-specific Mortality for Men with Biochemical Recurrence after Radical Prostatectomy. Eur. Urol. 67 (6), 1160–1167. 10.1016/j.eururo.2014.09.019 - DOI - PMC - PubMed
    1. Chen J., Li Y., Han X., Pan Y., Qian X. (2021). An Autophagic Gene-Based Signature to Predict the Survival of Patients with Low-Grade Gliomas. Cancer Med. 10 (5), 1848–1859. 10.1002/cam4.3748 - DOI - PMC - PubMed
    1. Cui T., Wang Y., Ji S., Li Y., Hao W., Zou H., et al. (2020). Applying Machine Learning Techniques in Nomogram Prediction and Analysis for SMILE Treatment. Am. J. Ophthalmol. 210, 71–77. 10.1016/j.ajo.2019.10.015 - DOI - PubMed