Review
. 2022 Jun 30;4(3):e210089.
doi: 10.1148/ryct.210089. eCollection 2022 Jun.

Role of CT in the Pre- and Postoperative Assessment of Conotruncal Anomalies

Affiliations
Review

Role of CT in the Pre- and Postoperative Assessment of Conotruncal Anomalies

Parveen Kumar et al. Radiol Cardiothorac Imaging. .

Abstract

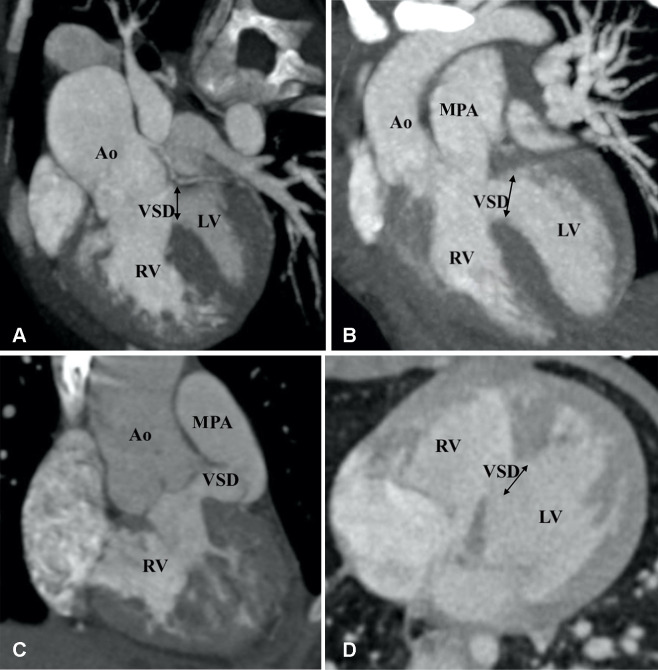
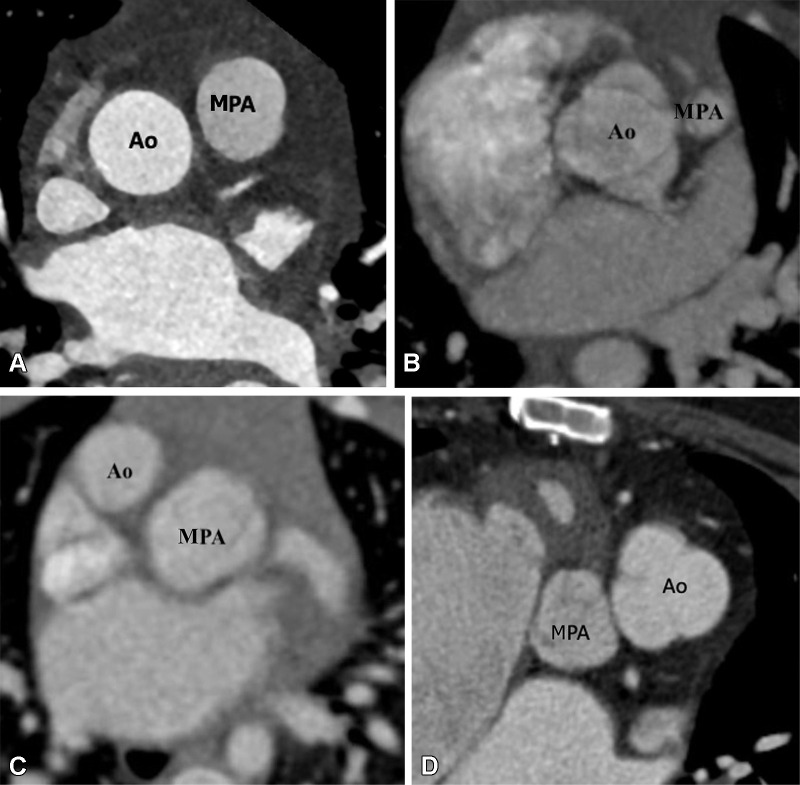
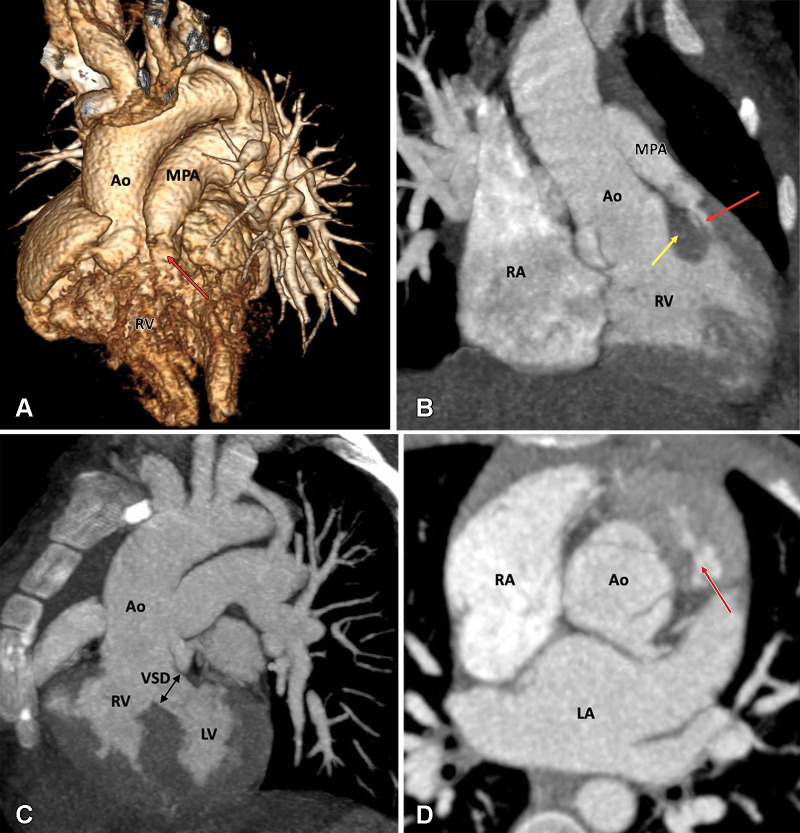
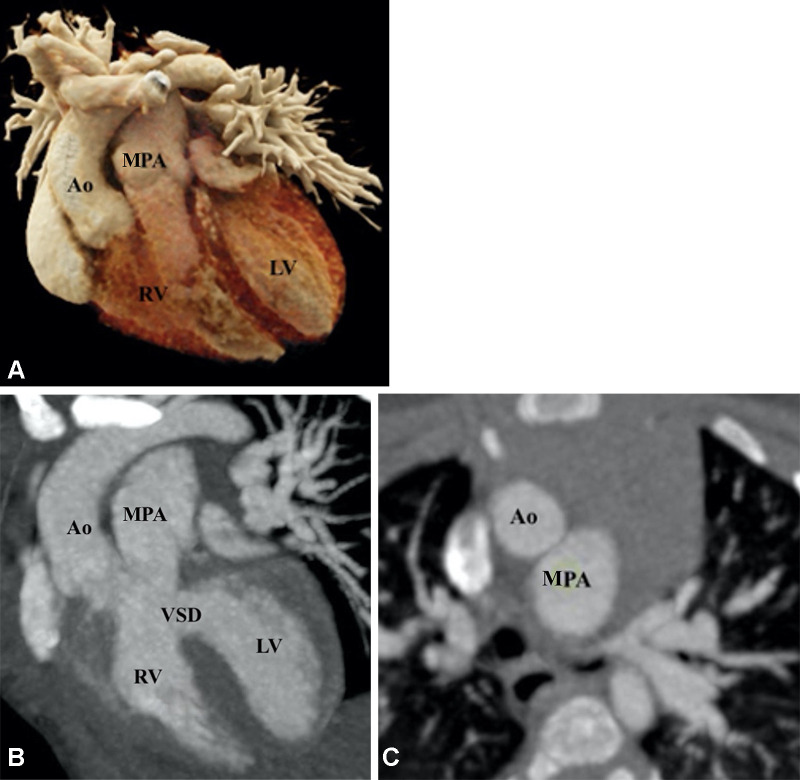
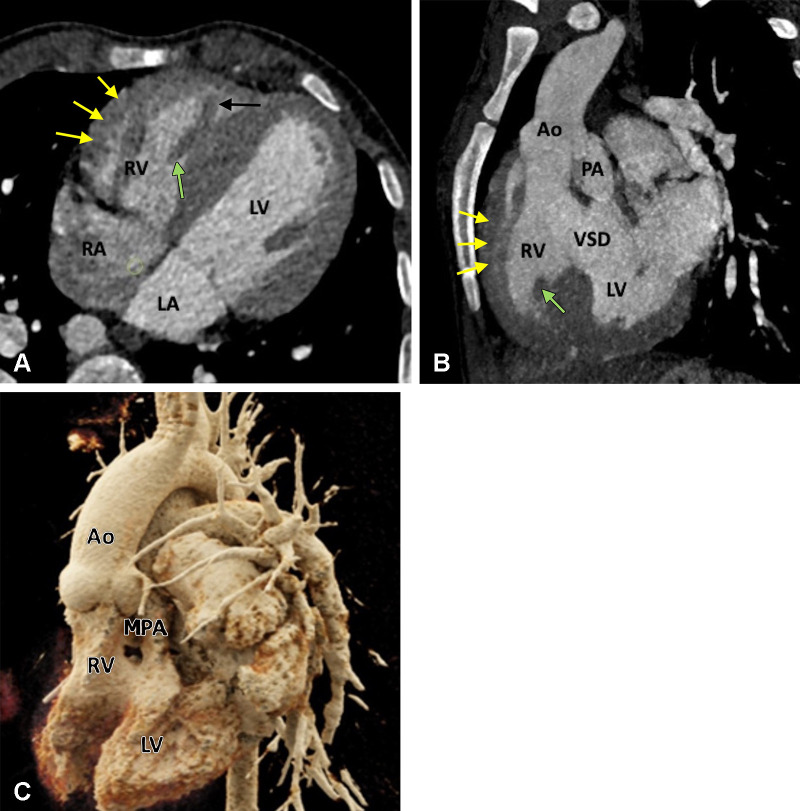
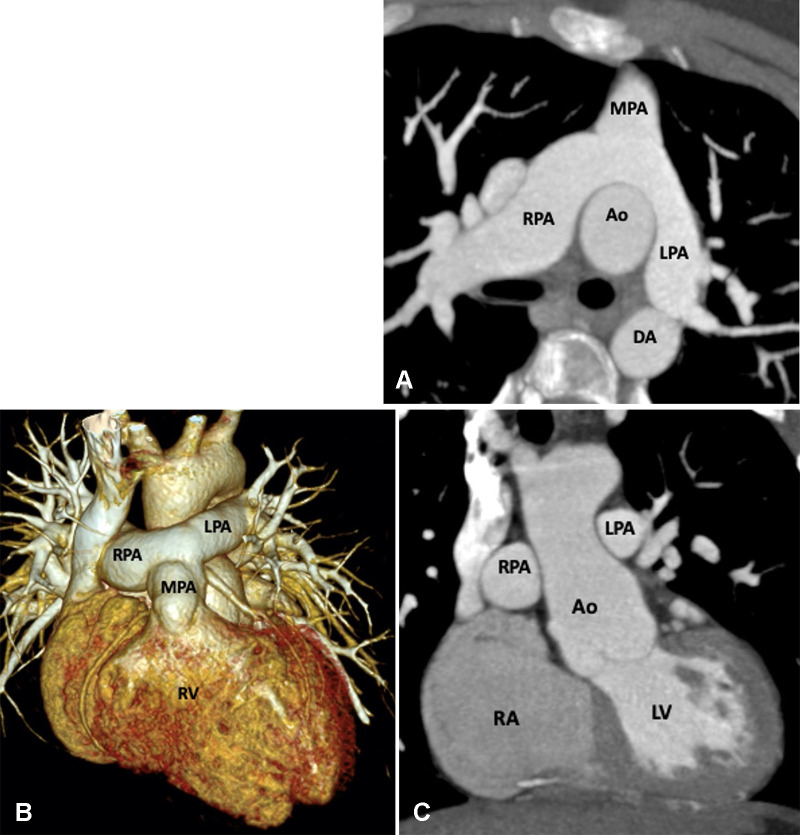
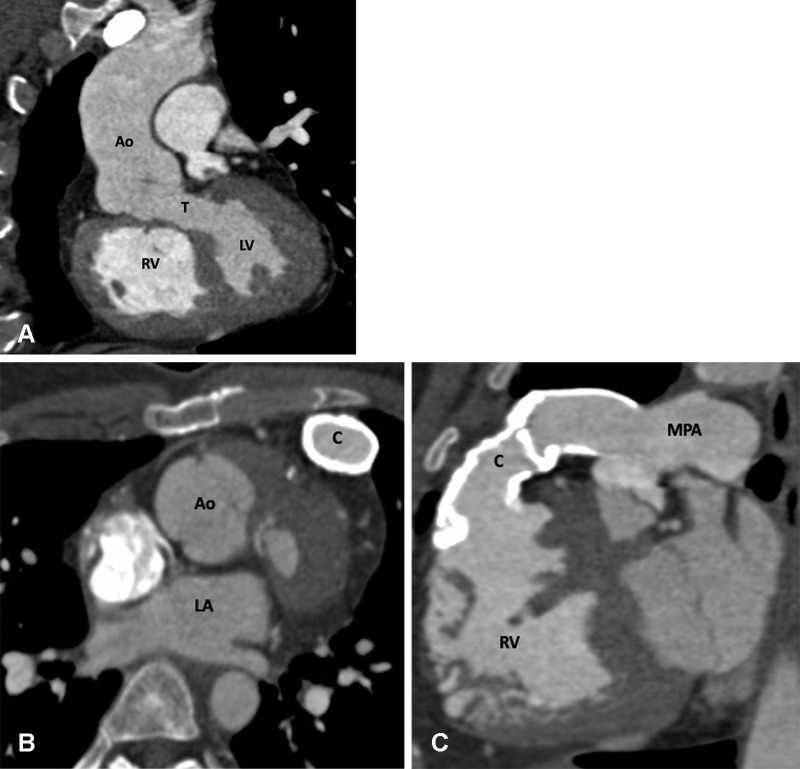
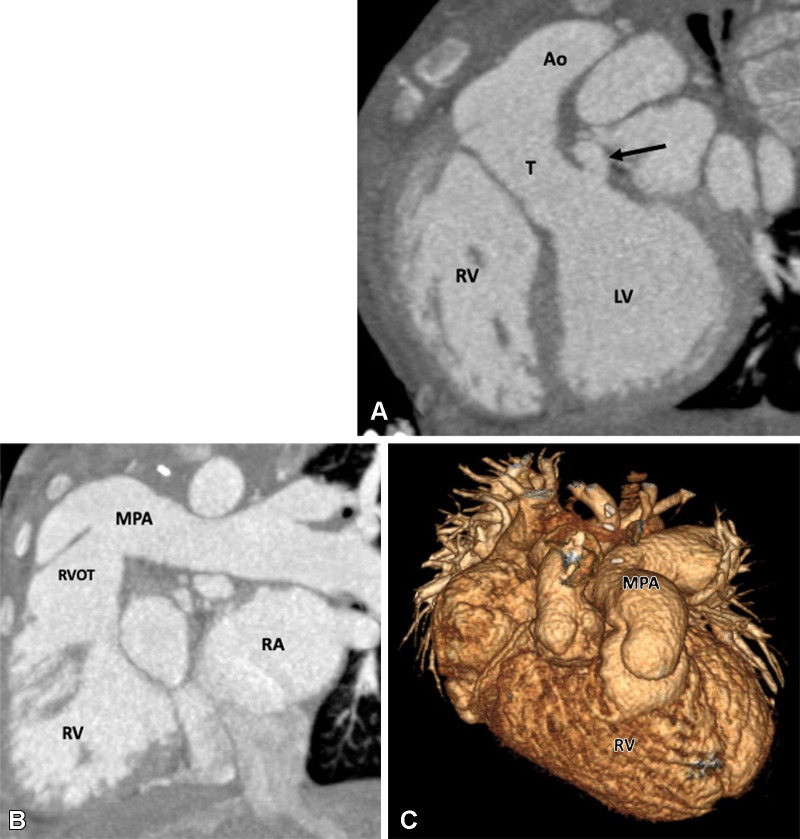
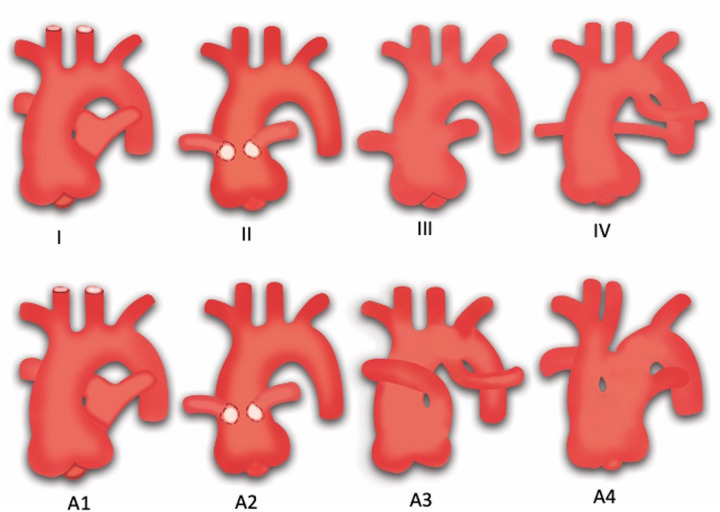
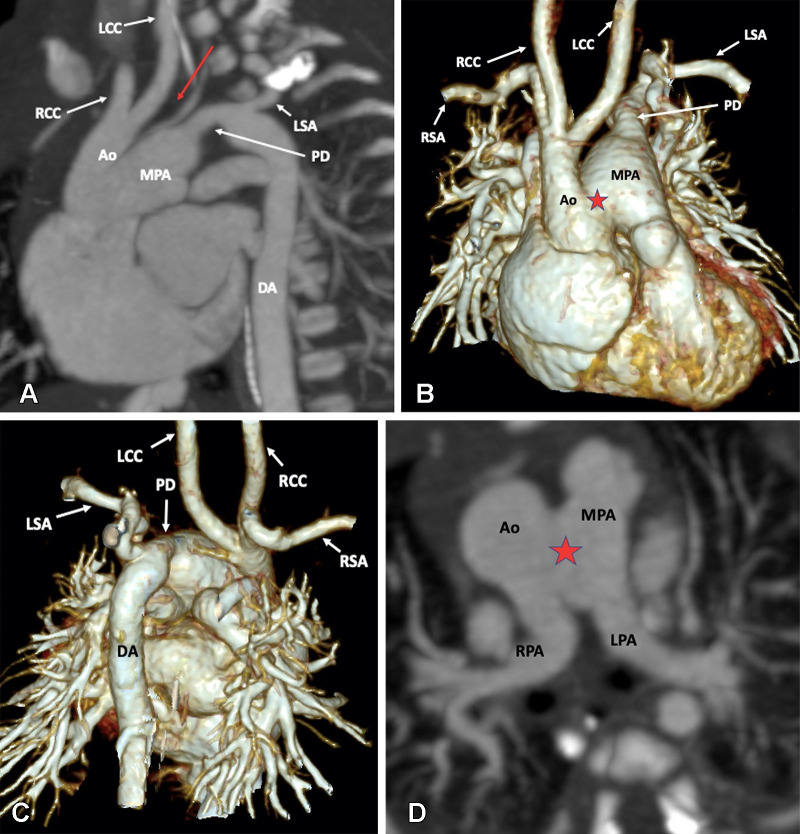
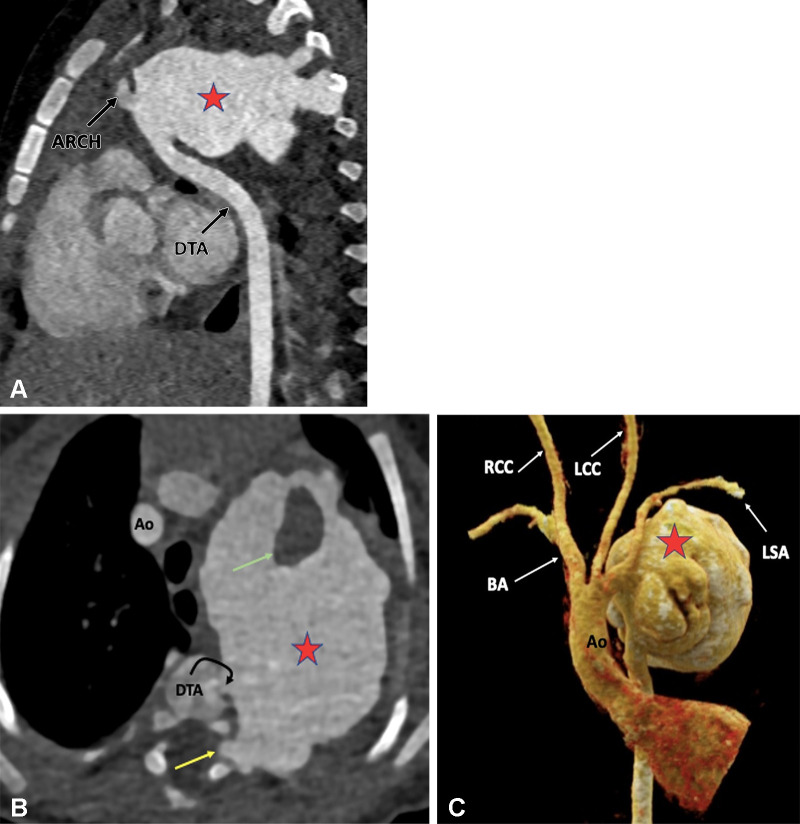
Conotruncal anomalies, also referred to as outflow tract anomalies, are congenital heart defects that result from abnormal septation of the great vessels' outflow tracts. The major conotruncal anomalies include tetralogy of Fallot, double-outlet right ventricle, transposition of the great arteries, truncus arteriosus, and interrupted aortic arch. Other defects, which are often components of the major anomalies, include pulmonary atresia with ventricular septal defect, pulmonary valve agenesis, aortopulmonary window, and double-outlet left ventricle. CT has emerged as a robust diagnostic tool in preoperative and postoperative assessment of various congenital heart diseases, including conotruncal anomalies. The data provided with multidetector CT imaging are useful for treatment planning and follow-up monitoring after surgery or intervention. Unlike echocardiography and MRI, CT is not limited by a small acoustic window, metallic devices, and need for sedation or anesthesia. Major advances in CT equipment, including dual-source scanners, wide-detector scanners, high-efficiency detectors, higher x-ray tube power, automatic tube current modulation, and advanced three-dimensional postprocessing, provide a low-risk, high-quality alternative to diagnostic cardiac catheterization and MRI. This review explores the various conotruncal anomalies and elucidates the role of CT imaging in their pre- and postoperative assessment. Keywords: CT, CT Angiography, Stents, Pediatrics © RSNA, 2022.

Keywords: CT; CT Angiography; Pediatrics; Stents.


Conflict of interest statement

Disclosures of conflicts of interest: P.K. No relevant relationships. M.B. No relevant relationships.

Figures

Preoperative appearance of classic tetralogy of Fallot with infundibular,
valvular, and pulmonary obstructive components in a male infant. (A) Sagittal
oblique maximum intensity projection (MIP) CT image shows right ventricular
hypertrophy (white arrow), VSD (black double arrow), and overriding of the
aorta. (B) Axial contrast-enhanced CT image shows infundibular pulmonary
stenosis (white arrow). (C) Axial oblique MIP CT image shows small caliber MPA,
RPA, and LPA. Severe stenosis is observed at the origin of the LPA (white
arrow). Ao = aorta, LPA = left pulmonary artery, LA = left atrium, LV = left
ventricle, MPA = main pulmonary artery, RPA = right pulmonary artery, RV = right
ventricle, VSD = ventricular septal defect.
Figure 1:
Preoperative appearance of classic tetralogy of Fallot with infundibular, valvular, and pulmonary obstructive components in a male infant. (A) Sagittal oblique maximum intensity projection (MIP) CT image shows right ventricular hypertrophy (white arrow), VSD (black double arrow), and overriding of the aorta. (B) Axial contrast-enhanced CT image shows infundibular pulmonary stenosis (white arrow). (C) Axial oblique MIP CT image shows small caliber MPA, RPA, and LPA. Severe stenosis is observed at the origin of the LPA (white arrow). Ao = aorta, LPA = left pulmonary artery, LA = left atrium, LV = left ventricle, MPA = main pulmonary artery, RPA = right pulmonary artery, RV = right ventricle, VSD = ventricular septal defect.
Preoperative appearance of tetralogy of Fallot with pulmonary atresia in a
male infant. (A) Sagittal oblique maximum intensity projection (MIP) CT image
shows right ventricular hypertrophy (white arrow), VSD (black double arrow), and
overriding of the aorta. MPA is not visualized. (B) Coronal oblique MIP CT image
shows pulmonary atresia (white arrow). (C) Axial oblique MIP CT image shows
severe hypoplasia of the branch pulmonary arteries. MPA is absent. Thin but
confluent branch pulmonary arteries produce the typical “seagull
wing” appearance. White arrows indicate RPA and LPA. (D) Coronal oblique
MIP CT image shows multiple MAPCAs arising from the descending thoracic aorta
(yellow arrows) and upper abdominal aorta (green arrows). Ao = aorta, LPA = left
pulmonary artery, LV = left ventricle, MAPCA = major aortopulmonary collateral
artery, MPA = main pulmonary artery, RPA = right pulmonary artery, RV = right
ventricle, VSD = ventricular septal defect.
Figure 2:
Preoperative appearance of tetralogy of Fallot with pulmonary atresia in a male infant. (A) Sagittal oblique maximum intensity projection (MIP) CT image shows right ventricular hypertrophy (white arrow), VSD (black double arrow), and overriding of the aorta. MPA is not visualized. (B) Coronal oblique MIP CT image shows pulmonary atresia (white arrow). (C) Axial oblique MIP CT image shows severe hypoplasia of the branch pulmonary arteries. MPA is absent. Thin but confluent branch pulmonary arteries produce the typical “seagull wing” appearance. White arrows indicate RPA and LPA. (D) Coronal oblique MIP CT image shows multiple MAPCAs arising from the descending thoracic aorta (yellow arrows) and upper abdominal aorta (green arrows). Ao = aorta, LPA = left pulmonary artery, LV = left ventricle, MAPCA = major aortopulmonary collateral artery, MPA = main pulmonary artery, RPA = right pulmonary artery, RV = right ventricle, VSD = ventricular septal defect.
Preoperative appearance of tetralogy of Fallot with rudimentary pulmonary
valves in a male infant. (A) Coronal oblique maximum intensity projection (MIP)
CT image shows right ventricular hypertrophy, VSD (black double arrow), and
overriding of the aorta. LPA is massively dilated. (B) Axial oblique MIP CT
image shows hypoplasia of pulmonary valve ring with rudimentary cusps (black
arrow). The MPA and its branches are massively dilated. Dilatation of the
pulmonary artery and its branches occurs because of stenosis of the pulmonary
valve and the antegrade fast flow. (C) Three-dimensional (3D) volume-rendered
image further confirms the pulmonary stenosis (white arrow) and massive
dilatation of the MPA and its branches. (D) Coronal oblique multiplanar
reconstruction CT image shows compression of the left main bronchus (white
arrow) due to a massively enlarged LPA. (E) 3D volume-rendered image further
confirms the bronchial narrowing. The left main bronchus appears diffusely
narrowed (white arrow) as compared with the right main bronchus, with focal
stenosis in the osteoproximal part. Ao = aorta, LPA = left pulmonary artery, LV
= left ventricle, MPA = main pulmonary artery, RPA = right pulmonary artery, RV
= right ventricle, RVOT = right ventricular outflow tract, VSD = ventricular
septal defect.
Figure 3:
Preoperative appearance of tetralogy of Fallot with rudimentary pulmonary valves in a male infant. (A) Coronal oblique maximum intensity projection (MIP) CT image shows right ventricular hypertrophy, VSD (black double arrow), and overriding of the aorta. LPA is massively dilated. (B) Axial oblique MIP CT image shows hypoplasia of pulmonary valve ring with rudimentary cusps (black arrow). The MPA and its branches are massively dilated. Dilatation of the pulmonary artery and its branches occurs because of stenosis of the pulmonary valve and the antegrade fast flow. (C) Three-dimensional (3D) volume-rendered image further confirms the pulmonary stenosis (white arrow) and massive dilatation of the MPA and its branches. (D) Coronal oblique multiplanar reconstruction CT image shows compression of the left main bronchus (white arrow) due to a massively enlarged LPA. (E) 3D volume-rendered image further confirms the bronchial narrowing. The left main bronchus appears diffusely narrowed (white arrow) as compared with the right main bronchus, with focal stenosis in the osteoproximal part. Ao = aorta, LPA = left pulmonary artery, LV = left ventricle, MPA = main pulmonary artery, RPA = right pulmonary artery, RV = right ventricle, RVOT = right ventricular outflow tract, VSD = ventricular septal defect.
Preoperative appearance of tetralogy of Fallot with absent pulmonary
valves in a male infant. (A) Sagittal oblique maximum intensity projection (MIP)
CT image shows right ventricular hypertrophy (white arrow), VSD (black double
arrow), and overriding of the aorta. (B) Axial oblique MIP CT image shows
hypoplasia of pulmonary valve ring with absent pulmonary valves (black arrow).
The MPA and its branches (right > left) are dilated. (C) Volume-rendered
image further confirms the pulmonary stenosis (black arrow) and massive
dilatation of the MPA and RPA. Ao = aorta, LPA = left pulmonary artery, LV =
left ventricle, MPA = main pulmonary artery, RPA = right pulmonary artery, RV =
right ventricle, VSD = ventricular septal defect.
Figure 4:
Preoperative appearance of tetralogy of Fallot with absent pulmonary valves in a male infant. (A) Sagittal oblique maximum intensity projection (MIP) CT image shows right ventricular hypertrophy (white arrow), VSD (black double arrow), and overriding of the aorta. (B) Axial oblique MIP CT image shows hypoplasia of pulmonary valve ring with absent pulmonary valves (black arrow). The MPA and its branches (right > left) are dilated. (C) Volume-rendered image further confirms the pulmonary stenosis (black arrow) and massive dilatation of the MPA and RPA. Ao = aorta, LPA = left pulmonary artery, LV = left ventricle, MPA = main pulmonary artery, RPA = right pulmonary artery, RV = right ventricle, VSD = ventricular septal defect.
Postoperative appearance of tetralogy of Fallot after total correction
in a 12-year-old boy. (A) Sagittal oblique and (B) axial maximum intensity
projection CT images show perimembranous (black arrow in A) and mid muscular
(red arrow in B) VSD patches. Ao = aorta, LA = left atrium, LV = left
ventricle, RA = right atrium, RV = right ventricle, VSD = ventricular septal
defect.
Figure 5:
Postoperative appearance of tetralogy of Fallot after total correction in a 12-year-old boy. (A) Sagittal oblique and (B) axial maximum intensity projection CT images show perimembranous (black arrow in A) and mid muscular (red arrow in B) VSD patches. Ao = aorta, LA = left atrium, LV = left ventricle, RA = right atrium, RV = right ventricle, VSD = ventricular septal defect.
Postoperative appearance of tetralogy of Fallot after transannular
patch repair in a 15-year-old boy. (A) Sagittal oblique maximum intensity
projection (MIP) CT image shows a VSD patch (black arrow). (B) Axial oblique
MIP CT image shows grossly dilated RA and RV. The severe degree of RV
dilatation leads to abnormal orientation of the intraventricular septum
(directed posteriorly) (black arrow) and narrowing of right atrioventricular
groove (white arrow). (C) Sagittal oblique MIP CT image shows dilated RV and
RVOT. The large caliber of the RVOT is due to the transannular patch
(arrows), which is noncontractile, unlike the rest of the RV myocardium. Ao
= aorta, LV = left ventricle, RA = right atrium, RV = right ventricle, RVOT
= right ventricular outflow tract, VSD = ventricular septal
defect.
Figure 6:
Postoperative appearance of tetralogy of Fallot after transannular patch repair in a 15-year-old boy. (A) Sagittal oblique maximum intensity projection (MIP) CT image shows a VSD patch (black arrow). (B) Axial oblique MIP CT image shows grossly dilated RA and RV. The severe degree of RV dilatation leads to abnormal orientation of the intraventricular septum (directed posteriorly) (black arrow) and narrowing of right atrioventricular groove (white arrow). (C) Sagittal oblique MIP CT image shows dilated RV and RVOT. The large caliber of the RVOT is due to the transannular patch (arrows), which is noncontractile, unlike the rest of the RV myocardium. Ao = aorta, LV = left ventricle, RA = right atrium, RV = right ventricle, RVOT = right ventricular outflow tract, VSD = ventricular septal defect.
Postoperative appearance of tetralogy of Fallot with pulmonary atresia
after RV-PA conduit (pulmonary homograft) repair, unifocalization of the
MAPCAs, and angioplasty of the bilateral pulmonary arteries in a 14-year-old
boy. (A) Sagittal oblique maximum intensity projection (MIP) CT image shows
a VSD patch (black arrow). (B) Sagittal oblique and (C) axial oblique MIP CT
images show RV-PA conduit with multifocal degenerative calcifications in
conduit wall. Patent stents are observed in the LPA and RPA (yellow arrow).
Stent placement was performed to relieve recurrent branch PA stenosis. (D)
Axial oblique MIP CT image shows a stent in the osteoproximal RPA. Another
good-sized vessel is observed arising from the RPA which has a unifocalized
MAPCA attached to it (white arrow). (E) Sagittal oblique multiplanar
reconstruction and (F) volume-rendered images show the origin of the
unifocalized MAPCA (white arrow) just proximal to the RPA stent (black arrow
in E, white arrow in F). Severe stenosis is noted in the osteoproximal
segment of the unifocalized MAPCA. Ao = aorta, C = conduit, LPA = left PA,
LV = left ventricle, MAPCA = major aorto-pulmonary collateral arteries, PA =
pulmonary artery, RPA = right PA, RV = right ventricle, VSD = ventricular
septal defect.
Figure 7:
Postoperative appearance of tetralogy of Fallot with pulmonary atresia after RV-PA conduit (pulmonary homograft) repair, unifocalization of the MAPCAs, and angioplasty of the bilateral pulmonary arteries in a 14-year-old boy. (A) Sagittal oblique maximum intensity projection (MIP) CT image shows a VSD patch (black arrow). (B) Sagittal oblique and (C) axial oblique MIP CT images show RV-PA conduit with multifocal degenerative calcifications in conduit wall. Patent stents are observed in the LPA and RPA (yellow arrow). Stent placement was performed to relieve recurrent branch PA stenosis. (D) Axial oblique MIP CT image shows a stent in the osteoproximal RPA. Another good-sized vessel is observed arising from the RPA which has a unifocalized MAPCA attached to it (white arrow). (E) Sagittal oblique multiplanar reconstruction and (F) volume-rendered images show the origin of the unifocalized MAPCA (white arrow) just proximal to the RPA stent (black arrow in E, white arrow in F). Severe stenosis is noted in the osteoproximal segment of the unifocalized MAPCA. Ao = aorta, C = conduit, LPA = left PA, LV = left ventricle, MAPCA = major aorto-pulmonary collateral arteries, PA = pulmonary artery, RPA = right PA, RV = right ventricle, VSD = ventricular septal defect.
Postoperative appearance of tetralogy of Fallot after total correction
and LPA stent placement in a 17-year-old girl. (A) Sagittal oblique maximum
intensity projection (MIP) CT image shows a VSD patch (black arrow). (B)
Axial oblique MIP CT image shows grossly dilated RA and RV. (C) Sagittal
oblique MIP CT image shows dilated RV and RVOT. A patent stent is seen in
the MPA extending into the LPA. Stent placement was performed to relieve
recurrent LPA ostial stenosis. (D) Axial oblique MIP CT image shows a patent
stent in the distal MPA extending into the LPA. There is proximal migration
of the stent with fracture in stent scaffold integrity (red arrow),
suggesting stent fracture. Ao = aorta, LPA = left pulmonary artery, LV =
left ventricle, MPA = main pulmonary artery, RA = right atrium, RPA = right
pulmonary artery, RV = right ventricle, RVOT = right ventricular outflow
tract, VSD = ventricular septal defect.
Figure 8:
Postoperative appearance of tetralogy of Fallot after total correction and LPA stent placement in a 17-year-old girl. (A) Sagittal oblique maximum intensity projection (MIP) CT image shows a VSD patch (black arrow). (B) Axial oblique MIP CT image shows grossly dilated RA and RV. (C) Sagittal oblique MIP CT image shows dilated RV and RVOT. A patent stent is seen in the MPA extending into the LPA. Stent placement was performed to relieve recurrent LPA ostial stenosis. (D) Axial oblique MIP CT image shows a patent stent in the distal MPA extending into the LPA. There is proximal migration of the stent with fracture in stent scaffold integrity (red arrow), suggesting stent fracture. Ao = aorta, LPA = left pulmonary artery, LV = left ventricle, MPA = main pulmonary artery, RA = right atrium, RPA = right pulmonary artery, RV = right ventricle, RVOT = right ventricular outflow tract, VSD = ventricular septal defect.
Postprocedural appearance of tetralogy of Fallot after RVOT stent
palliation in a 1-year-old boy. Axial oblique contrast-enhanced CT image
shows a stent in the RVOT extending into the MPA. A thrombus is observed in
the stent (yellow arrow). Ao = aorta, MPA = main pulmonary artery, RVOT =
right ventricular outflow tract.
Figure 9:
Postprocedural appearance of tetralogy of Fallot after RVOT stent palliation in a 1-year-old boy. Axial oblique contrast-enhanced CT image shows a stent in the RVOT extending into the MPA. A thrombus is observed in the stent (yellow arrow). Ao = aorta, MPA = main pulmonary artery, RVOT = right ventricular outflow tract.
Postprocedural appearance of tetralogy of Fallot after modified BT
shunt at birth followed by stent placement in a 2-month-old male infant.
Coronal oblique contrast-enhanced CT image shows a patent stent (white
arrow) in the right modified BT shunt, made between the right
brachiocephalic artery and right pulmonary artery at birth. The shunt
underwent stenosis, which was relieved by stent placement. The stent
scaffold appears intact, and there is uniform contrast agent opacification
of the stent without any stenosis or thrombosis. BA = brachiocephalic
artery, BT = Blalock-Taussig, LPA = left pulmonary artery, RPA = right
pulmonary artery.
Figure 10:
Postprocedural appearance of tetralogy of Fallot after modified BT shunt at birth followed by stent placement in a 2-month-old male infant. Coronal oblique contrast-enhanced CT image shows a patent stent (white arrow) in the right modified BT shunt, made between the right brachiocephalic artery and right pulmonary artery at birth. The shunt underwent stenosis, which was relieved by stent placement. The stent scaffold appears intact, and there is uniform contrast agent opacification of the stent without any stenosis or thrombosis. BA = brachiocephalic artery, BT = Blalock-Taussig, LPA = left pulmonary artery, RPA = right pulmonary artery.
Postprocedural appearance of tetralogy of Fallot after modified BT
shunt at birth followed by stent placement in a 3-month-old female infant.
Coronal oblique contrast-enhanced CT image shows a stent (white arrow) in
the modified BT shunt, which was made between the RSA and RPA at birth. The
stent was placed to relieve stenosis of the BT shunt. The stent appears
thrombosed and shows severe stenosis at the subclavian end. BT =
Blalock-Taussig, RPA = right pulmonary artery, RSA = right subclavian
artery.
Figure 11:
Postprocedural appearance of tetralogy of Fallot after modified BT shunt at birth followed by stent placement in a 3-month-old female infant. Coronal oblique contrast-enhanced CT image shows a stent (white arrow) in the modified BT shunt, which was made between the RSA and RPA at birth. The stent was placed to relieve stenosis of the BT shunt. The stent appears thrombosed and shows severe stenosis at the subclavian end. BT = Blalock-Taussig, RPA = right pulmonary artery, RSA = right subclavian artery.
Diagram shows four types of ventricular septal defect (VSD). The
relationship between the outlet septum (green) and septomarginal trabecula (SMT)
defines the location of the VSD. (A) The outlet septum attaches to the anterior
limb of the septal band, resulting in a subaortic VSD. (B) The outlet septum
attaches to the posterior limb of the septal band, resulting in a subpulmonic
VSD. (C) In the doubly committed VSD, the outlet septum is absent. (D) A remote
VSD is not related to the outlet septum, and the distance between the VSD and
semilunar valve is greater than the size of the aortic valve. Ao = aorta, LV =
left ventricle, PA = pulmonary artery, RV = right ventricle.
Figure 12:
Diagram shows four types of ventricular septal defect (VSD). The relationship between the outlet septum (green) and septomarginal trabecula (SMT) defines the location of the VSD. (A) The outlet septum attaches to the anterior limb of the septal band, resulting in a subaortic VSD. (B) The outlet septum attaches to the posterior limb of the septal band, resulting in a subpulmonic VSD. (C) In the doubly committed VSD, the outlet septum is absent. (D) A remote VSD is not related to the outlet septum, and the distance between the VSD and semilunar valve is greater than the size of the aortic valve. Ao = aorta, LV = left ventricle, PA = pulmonary artery, RV = right ventricle.
Types of ventricular septal defects (VSDs). (A) Subaortic VSD (double
arrow) in a 1-year-old boy with double-outlet right ventricle (DORV).
Reformatted coronal maximum intensity projection (MIP) CT image shows
greater than 50% aortic overriding. The pulmonary valve and MPA were
severely stenotic (not shown). (B) Subpulmonic VSD (double arrow) in a
2-year-old boy with DORV. Reformatted coronal MIP CT image shows the origin
of both great vessels from the RV. (C) Doubly committed VSD in a 2-year-old
girl with DORV. Reformatted coronal MIP CT image shows the origin of both
great vessels from the RV. VSD is closely related to both the semilunar
valves (doubly committed). (D) Remote VSD (double arrow) in an infant with
DORV. Axial MIP CT image shows remote intramuscular VSD. Ao = aorta, LV =
left ventricle, MPA = main pulmonary artery, RV = right
ventricle.
Figure 13:
Types of ventricular septal defects (VSDs). (A) Subaortic VSD (double arrow) in a 1-year-old boy with double-outlet right ventricle (DORV). Reformatted coronal maximum intensity projection (MIP) CT image shows greater than 50% aortic overriding. The pulmonary valve and MPA were severely stenotic (not shown). (B) Subpulmonic VSD (double arrow) in a 2-year-old boy with DORV. Reformatted coronal MIP CT image shows the origin of both great vessels from the RV. (C) Doubly committed VSD in a 2-year-old girl with DORV. Reformatted coronal MIP CT image shows the origin of both great vessels from the RV. VSD is closely related to both the semilunar valves (doubly committed). (D) Remote VSD (double arrow) in an infant with DORV. Axial MIP CT image shows remote intramuscular VSD. Ao = aorta, LV = left ventricle, MPA = main pulmonary artery, RV = right ventricle.
Great vessels relationship. (A) Normal great vessels relationship in a
25-year-old healthy man. Axial contrast-enhanced CT image shows the
ascending aorta is in a position posterior and to the right of the pulmonary
artery. (B) Normal relationship in a 2-year-old boy with TOF-type DORV.
Axial maximum intensity projection (MIP) CT image shows the ascending aorta
in a position posterior and to the right of the pulmonary artery. Pulmonary
stenosis is observed, which is a common feature of TOF-type DORV. (C)
Dextrotransposition in a 1.5-year-old girl with TGA-type DORV. Axial MIP CT
image shows the ascending aorta in a position anterior and to the right of
the MPA. (D) Levotransposition in a 2-year-old girl with TGA-type DORV.
Axial MIP CT image shows the ascending aorta in a position anterior and to
the left of the pulmonary artery. Ao = aorta, DORV = double-outlet right
ventricle, MPA = main pulmonary artery, TGA = transposition of the great
arteries, TOF = tetralogy of Fallot.
Figure 14:
Great vessels relationship. (A) Normal great vessels relationship in a 25-year-old healthy man. Axial contrast-enhanced CT image shows the ascending aorta is in a position posterior and to the right of the pulmonary artery. (B) Normal relationship in a 2-year-old boy with TOF-type DORV. Axial maximum intensity projection (MIP) CT image shows the ascending aorta in a position posterior and to the right of the pulmonary artery. Pulmonary stenosis is observed, which is a common feature of TOF-type DORV. (C) Dextrotransposition in a 1.5-year-old girl with TGA-type DORV. Axial MIP CT image shows the ascending aorta in a position anterior and to the right of the MPA. (D) Levotransposition in a 2-year-old girl with TGA-type DORV. Axial MIP CT image shows the ascending aorta in a position anterior and to the left of the pulmonary artery. Ao = aorta, DORV = double-outlet right ventricle, MPA = main pulmonary artery, TGA = transposition of the great arteries, TOF = tetralogy of Fallot.
Preoperative appearance of TOF-type DORV in a 2-month-old male infant.
(A) Volume-rendered image and (B) coronal oblique maximum intensity
projection (MIP) CT image show the great arteries arising from the RV.
Severe pulmonary stenosis is seen (red arrow). Note the subpulmonic conus
(yellow arrow in B). (C) Sagittal MIP CT image shows the subaortic VSD
(black double arrow). (D) Axial reformatted MIP CT image shows the normal
relationship of the great vessels; the aorta is situated posterior and
rightward to the pulmonary trunk. There is hypertrophy of the pulmonic
infundibulum, causing severe RVOT stenosis (red arrow). Ao = aorta, DORV =
double-outlet right ventricle, LA = left atrium, LV = left ventricle, MPA =
main pulmonary artery, RA = right atrium, RV = right ventricle, RVOT = right
ventricular outflow tract, TOF = tetralogy of Fallot, VSD = ventricular
septal defect.
Figure 15:
Preoperative appearance of TOF-type DORV in a 2-month-old male infant. (A) Volume-rendered image and (B) coronal oblique maximum intensity projection (MIP) CT image show the great arteries arising from the RV. Severe pulmonary stenosis is seen (red arrow). Note the subpulmonic conus (yellow arrow in B). (C) Sagittal MIP CT image shows the subaortic VSD (black double arrow). (D) Axial reformatted MIP CT image shows the normal relationship of the great vessels; the aorta is situated posterior and rightward to the pulmonary trunk. There is hypertrophy of the pulmonic infundibulum, causing severe RVOT stenosis (red arrow). Ao = aorta, DORV = double-outlet right ventricle, LA = left atrium, LV = left ventricle, MPA = main pulmonary artery, RA = right atrium, RV = right ventricle, RVOT = right ventricular outflow tract, TOF = tetralogy of Fallot, VSD = ventricular septal defect.
Preoperative appearance of TGA-type DORV in a 2-month-old female
infant. (A) Cinematic rendering technique image shows both the great
arteries arising from the right ventricle. Both the great vessel trunks run
parallel to each other, with the aorta on the right side. (B) Coronal
reformatted maximum intensity projection (MIP) CT image shows a subpulmonic
VSD. (C) Axial MIP CT image shows the great vessels relationship. The aorta
is seen anterior and to the right of the MPA, suggesting dextrotransposition
(D-TGA type) relationship. Ao = aorta, DORV = double-outlet right ventricle,
LV = left ventricle, MPA = main pulmonary artery, RV = right ventricle, TGA
= transposition of the great arteries, VSD = ventricular septal
defect.
Figure 16:
Preoperative appearance of TGA-type DORV in a 2-month-old female infant. (A) Cinematic rendering technique image shows both the great arteries arising from the right ventricle. Both the great vessel trunks run parallel to each other, with the aorta on the right side. (B) Coronal reformatted maximum intensity projection (MIP) CT image shows a subpulmonic VSD. (C) Axial MIP CT image shows the great vessels relationship. The aorta is seen anterior and to the right of the MPA, suggesting dextrotransposition (D-TGA type) relationship. Ao = aorta, DORV = double-outlet right ventricle, LV = left ventricle, MPA = main pulmonary artery, RV = right ventricle, TGA = transposition of the great arteries, VSD = ventricular septal defect.
Postoperative appearance of TOF-type DORV after VSD closure with LV
routing, infundibular resection, and patch augmentation of the RVOT up to
the main pulmonary artery in a 4-month-old male infant. (A) Sagittal oblique
and (B) axial multiplanar reconstruction CT images show dilated RV and RVOT.
There is residual subvalvular narrowing (red arrow). The residual pulmonary
valve tissue is shown with a black arrow. The MPA, RPA, and LPA appear
normal. (C) Axial maximum intensity projection (MIP) CT image shows
anomalous origin of the left main coronary artery (black arrow) from the
noncoronary sinus with retroaortic course. (D) Coronal reformatted MIP CT
image shows multiple hemivertebrae (white arrows). Ao = aorta, DORV =
double-outlet right ventricle, LA = left atrium, LM = left main, LPA = left
pulmonary artery, LV = left ventricle, MPA = main pulmonary artery, PV =
pulmonary valve, RA = right atrium, RPA = right pulmonary artery, RV = right
ventricle, RVOT = right ventricular outflow tract, TOF = tetralogy of
Fallot, VSD = ventricular septal defect.
Figure 17:
Postoperative appearance of TOF-type DORV after VSD closure with LV routing, infundibular resection, and patch augmentation of the RVOT up to the main pulmonary artery in a 4-month-old male infant. (A) Sagittal oblique and (B) axial multiplanar reconstruction CT images show dilated RV and RVOT. There is residual subvalvular narrowing (red arrow). The residual pulmonary valve tissue is shown with a black arrow. The MPA, RPA, and LPA appear normal. (C) Axial maximum intensity projection (MIP) CT image shows anomalous origin of the left main coronary artery (black arrow) from the noncoronary sinus with retroaortic course. (D) Coronal reformatted MIP CT image shows multiple hemivertebrae (white arrows). Ao = aorta, DORV = double-outlet right ventricle, LA = left atrium, LM = left main, LPA = left pulmonary artery, LV = left ventricle, MPA = main pulmonary artery, PV = pulmonary valve, RA = right atrium, RPA = right pulmonary artery, RV = right ventricle, RVOT = right ventricular outflow tract, TOF = tetralogy of Fallot, VSD = ventricular septal defect.
Postoperative appearance of DORV with functional single ventricle
after bidirectional cavopulmonary shunt in a 31-month-old boy. (A) Coronal
oblique and (B) axial maximum intensity projection CT images show
end-to-side anastomosis of the superior vena cava to the right pulmonary
artery after division of the superior cavoatrial junction. In this patient,
bidirectional cavopulmonary shunt was performed as an intermediate procedure
to staged Fontan operation. Ao = aorta, DORV = double-outlet right
ventricle, LPA = left pulmonary artery, RPA = right pulmonary artery, SVC =
superior vena cava.
Figure 18:
Postoperative appearance of DORV with functional single ventricle after bidirectional cavopulmonary shunt in a 31-month-old boy. (A) Coronal oblique and (B) axial maximum intensity projection CT images show end-to-side anastomosis of the superior vena cava to the right pulmonary artery after division of the superior cavoatrial junction. In this patient, bidirectional cavopulmonary shunt was performed as an intermediate procedure to staged Fontan operation. Ao = aorta, DORV = double-outlet right ventricle, LPA = left pulmonary artery, RPA = right pulmonary artery, SVC = superior vena cava.
Postoperative appearance of DORV with functional single ventricle
after extracardiac Fontan procedure in an 8-year-old girl. (A) Coronal
oblique maximum intensity projection (MIP) CT image shows the superior and
inferior connection of the conduit to the RPA and IVC, respectively. The SVC
is connected to the RPA. No evidence of any conduit stenosis, calcification,
or thrombosis is seen. (B) Axial MIP CT image shows an extra-atrial conduit
placed entirely outside the right atrium. Ao = aorta, C = conduit, DORV =
double-outlet right ventricle, FSV = functional single ventricle, IVC =
inferior vena cava, LLPV = left lower pulmonary vein, LPA = left pulmonary
artery, RAA = right atrial appendage, RLPV = right lower pulmonary vein, RPA
= right pulmonary artery, SVC = superior vena cava.
Figure 19:
Postoperative appearance of DORV with functional single ventricle after extracardiac Fontan procedure in an 8-year-old girl. (A) Coronal oblique maximum intensity projection (MIP) CT image shows the superior and inferior connection of the conduit to the RPA and IVC, respectively. The SVC is connected to the RPA. No evidence of any conduit stenosis, calcification, or thrombosis is seen. (B) Axial MIP CT image shows an extra-atrial conduit placed entirely outside the right atrium. Ao = aorta, C = conduit, DORV = double-outlet right ventricle, FSV = functional single ventricle, IVC = inferior vena cava, LLPV = left lower pulmonary vein, LPA = left pulmonary artery, RAA = right atrial appendage, RLPV = right lower pulmonary vein, RPA = right pulmonary artery, SVC = superior vena cava.
Extracardiac Fontan procedure biphasic acquisition protocol. (A)
Coronal reformatted maximum intensity projection (MIP) CT image in the early
arterial phase shows well-opacified aortic root. The Fontan circuit is not
opacified, giving false impression of thrombosis. (B) Coronal reformatted
MIP CT image in the late venous phase shows uniform opacification of the
Fontan conduit. Ao = aorta, C = conduit, LPA = left pulmonary artery, RPA =
right pulmonary artery, SVC = superior vena cava.
Figure 20:
Extracardiac Fontan procedure biphasic acquisition protocol. (A) Coronal reformatted maximum intensity projection (MIP) CT image in the early arterial phase shows well-opacified aortic root. The Fontan circuit is not opacified, giving false impression of thrombosis. (B) Coronal reformatted MIP CT image in the late venous phase shows uniform opacification of the Fontan conduit. Ao = aorta, C = conduit, LPA = left pulmonary artery, RPA = right pulmonary artery, SVC = superior vena cava.
Preoperative appearance of dextrotransposition of the great arteries in a
4-year-old boy. (A) Axial oblique maximum intensity projection (MIP) CT image
shows atrioventricular concordance. The RV is identified by a moderator band
(black arrow), trabeculated wall (yellow arrows), and septal papillary muscle
(green arrow). The LV, on the other hand, has a smooth wall without moderator
band and septal papillary muscle. (B) Coronal oblique MIP CT image shows
ventriculoarterial discordance. The aorta arises from the RV, and the PA arises
from the LV. The RV is identified by trabeculated wall (yellow arrows) and
septal papillary muscle (green arrow). A VSD is also seen. (C) Cinematic
rendering technique image further confirms the dextrotransposition of the aorta,
which is located rightward and anterior to the pulmonary trunk. Ao = aorta, LA =
left atrium, LV = left ventricle, MPA = main PA, PA = pulmonary artery, RA =
right atrium, RV = right ventricle, VSD = ventricular septal defect.
Figure 21:
Preoperative appearance of dextrotransposition of the great arteries in a 4-year-old boy. (A) Axial oblique maximum intensity projection (MIP) CT image shows atrioventricular concordance. The RV is identified by a moderator band (black arrow), trabeculated wall (yellow arrows), and septal papillary muscle (green arrow). The LV, on the other hand, has a smooth wall without moderator band and septal papillary muscle. (B) Coronal oblique MIP CT image shows ventriculoarterial discordance. The aorta arises from the RV, and the PA arises from the LV. The RV is identified by trabeculated wall (yellow arrows) and septal papillary muscle (green arrow). A VSD is also seen. (C) Cinematic rendering technique image further confirms the dextrotransposition of the aorta, which is located rightward and anterior to the pulmonary trunk. Ao = aorta, LA = left atrium, LV = left ventricle, MPA = main PA, PA = pulmonary artery, RA = right atrium, RV = right ventricle, VSD = ventricular septal defect.
Postoperative appearance of dextrotransposition of the great arteries
after an arterial switch with LeCompte maneuver in an 11-year-old boy. (A)
Axial maximum intensity projection (MIP) CT image and (B) volume-rendered
image show the location of the MPA anterior to the aorta. The branch
pulmonary arteries bifurcate anterior to the ascending aorta and
“drape over” it. The great arteries are lying directly in
antero-posterior relation, and the right and left branch PA sizes are
balanced. The positioning of the MPA anterior to the aorta is called the
LeCompte maneuver. The purpose of the LeCompte maneuver is to maximize the
length of the aorta, thus further reducing the risk of coronary artery
kinking and stenosis. (C) Coronal MIP CT image shows mildly dilated aortic
root. The RPA and LPA are seen lying on either side of the aorta. Ao =
aorta, DA = descending aorta, LPA = left PA, LV = left ventricle, MPA = main
PA, PA = pulmonary artery, RA = right atrium, RPA = right PA, RV = right
ventricle.
Figure 22:
Postoperative appearance of dextrotransposition of the great arteries after an arterial switch with LeCompte maneuver in an 11-year-old boy. (A) Axial maximum intensity projection (MIP) CT image and (B) volume-rendered image show the location of the MPA anterior to the aorta. The branch pulmonary arteries bifurcate anterior to the ascending aorta and “drape over” it. The great arteries are lying directly in antero-posterior relation, and the right and left branch PA sizes are balanced. The positioning of the MPA anterior to the aorta is called the LeCompte maneuver. The purpose of the LeCompte maneuver is to maximize the length of the aorta, thus further reducing the risk of coronary artery kinking and stenosis. (C) Coronal MIP CT image shows mildly dilated aortic root. The RPA and LPA are seen lying on either side of the aorta. Ao = aorta, DA = descending aorta, LPA = left PA, LV = left ventricle, MPA = main PA, PA = pulmonary artery, RA = right atrium, RPA = right PA, RV = right ventricle.
Postoperative (Rastelli procedure) appearance of dextrotransposition
of the great arteries with VSD and pulmonary stenosis after an RV-PA
conduit, VSD closure, and LV-Ao routing in a 27-year-old man. (A) Coronal
oblique maximum intensity projection (MIP) CT image shows tunnel repair of
the VSD. The LV is routed to the Ao. No evidence of any tunnel stenosis is
observed. (B) Axial and (C) sagittal oblique MIP CT images show the RV-PA
conduit. There is diffuse circumferential calcification of the conduit
without any focal stenosis. The pressure gradients were elevated at
echocardiography and catheter angiography. The RV is dilated. Ao = aorta, C
= conduit, LA = left atrium, LV = left ventricle, MPA = main PA, PA =
pulmonary artery, RV = right ventricle, T = tunnel, VSD = ventricular septal
defect.
Figure 23:
Postoperative (Rastelli procedure) appearance of dextrotransposition of the great arteries with VSD and pulmonary stenosis after an RV-PA conduit, VSD closure, and LV-Ao routing in a 27-year-old man. (A) Coronal oblique maximum intensity projection (MIP) CT image shows tunnel repair of the VSD. The LV is routed to the Ao. No evidence of any tunnel stenosis is observed. (B) Axial and (C) sagittal oblique MIP CT images show the RV-PA conduit. There is diffuse circumferential calcification of the conduit without any focal stenosis. The pressure gradients were elevated at echocardiography and catheter angiography. The RV is dilated. Ao = aorta, C = conduit, LA = left atrium, LV = left ventricle, MPA = main PA, PA = pulmonary artery, RV = right ventricle, T = tunnel, VSD = ventricular septal defect.
Postoperative appearance after réparation à
l’etage ventriculaire (REV procedure) for treatment of
dextrotransposition of the great arteries, ventricular septal defect, and
pulmonary stenosis in a 26-year-old man. (A) Sagittal oblique maximum
intensity projection (MIP) CT image shows a small pseudoaneurysm (black
arrow) arising from the LV outflow tract. (B) Sagittal oblique MIP CT image
shows mildly dilated RV and RVOT. (C) Volume-rendered image shows direct
implantation of the MPA on the RV lying anterior to the aorta. The REV
procedure is similar to Rastelli repair, except the pulmonary artery is
directly connected with the RV, avoiding the RV-MPA conduit. Ao = aorta, LV
= left ventricle, MPA = main pulmonary artery, RA = right atrium, RV = right
ventricle, RVOT = right ventricular outflow tract, T = tunnel.
Figure 24:
Postoperative appearance after réparation à l’etage ventriculaire (REV procedure) for treatment of dextrotransposition of the great arteries, ventricular septal defect, and pulmonary stenosis in a 26-year-old man. (A) Sagittal oblique maximum intensity projection (MIP) CT image shows a small pseudoaneurysm (black arrow) arising from the LV outflow tract. (B) Sagittal oblique MIP CT image shows mildly dilated RV and RVOT. (C) Volume-rendered image shows direct implantation of the MPA on the RV lying anterior to the aorta. The REV procedure is similar to Rastelli repair, except the pulmonary artery is directly connected with the RV, avoiding the RV-MPA conduit. Ao = aorta, LV = left ventricle, MPA = main pulmonary artery, RA = right atrium, RV = right ventricle, RVOT = right ventricular outflow tract, T = tunnel.
Postoperative appearance after an arterial switch procedure and LPA
stent placement for treatment of dextrotransposition of the great arteries
in a 14-year-old boy.(A) Axial maximum intensity projection (MIP) CT image
shows the location of the main pulmonary artery anterior to the aorta. The
patent stent is seen in the proximal LPA. The origin of the RPA is jailed.
Stent placement was done to relieve recurrent LPA stenosis. (B) Axial and
(C) sagittal MIP CT images show a single coronary artery (green arrow). A
single common trunk arises from the aorta, which divides into the RCA and LM
(white arrows in B). The LPA with stent is abutting the single coronary
artery at its origin, but no evidence of ostial stenosis is seen. The aortic
root appears dilated. (D) Volume-rendered image confirms the single coronary
artery arising from right coronary sinus. Ao = aorta, LAD = left anterior
descending artery, LM = left main trunk, LPA = left pulmonary artery, RCA =
right coronary artery, RCC = right coronary sinus, RPA = right pulmonary
artery.
Figure 25:
Postoperative appearance after an arterial switch procedure and LPA stent placement for treatment of dextrotransposition of the great arteries in a 14-year-old boy. (A) Axial maximum intensity projection (MIP) CT image shows the location of the main pulmonary artery anterior to the aorta. The patent stent is seen in the proximal LPA. The origin of the RPA is jailed. Stent placement was done to relieve recurrent LPA stenosis. (B) Axial and (C) sagittal MIP CT images show a single coronary artery (green arrow). A single common trunk arises from the aorta, which divides into the RCA and LM (white arrows in B). The LPA with stent is abutting the single coronary artery at its origin, but no evidence of ostial stenosis is seen. The aortic root appears dilated. (D) Volume-rendered image confirms the single coronary artery arising from right coronary sinus. Ao = aorta, LAD = left anterior descending artery, LM = left main trunk, LPA = left pulmonary artery, RCA = right coronary artery, RCC = right coronary sinus, RPA = right pulmonary artery.
Postoperative appearance after an arterial switch procedure for
treatment of dextrotransposition of the great arteries in a 21-year-old
woman. (A) Axial maximum intensity projection (MIP) CT image shows anomalous
origin of the LM from the right coronary sinus with retroaortic course
before dividing into the LAD and LCx. (B) Axial MIP CT image shows high
origin of the RCA from the sinotubular junction with prepulmonic course
before entering into the right atrioventricular groove. Ao = aorta, LA =
left atrium, LAD = left anterior descending artery, LCx = left circumflex
artery, LM = left main trunk, MPA = main pulmonary artery, RCA = right
coronary artery.
Figure 26:
Postoperative appearance after an arterial switch procedure for treatment of dextrotransposition of the great arteries in a 21-year-old woman. (A) Axial maximum intensity projection (MIP) CT image shows anomalous origin of the LM from the right coronary sinus with retroaortic course before dividing into the LAD and LCx. (B) Axial MIP CT image shows high origin of the RCA from the sinotubular junction with prepulmonic course before entering into the right atrioventricular groove. Ao = aorta, LA = left atrium, LAD = left anterior descending artery, LCx = left circumflex artery, LM = left main trunk, MPA = main pulmonary artery, RCA = right coronary artery.
Preoperative appearance of congenitally corrected transposition of the
great arteries in a 25-year-old woman. (A) Axial oblique maximum intensity
projection (MIP) CT image shows atrioventricular discordance. The RV is
identified by the moderator band (black arrow). (B) Coronal oblique MIP CT
image shows ventriculoarterial discordance. The aorta arises from the
left-sided RV, and the pulmonary artery arises from the right-sided LV. The
RV is identified by the trabeculated wall (yellow arrow). A thick conal
tissue (black arrow) is seen in the subpulmonic region. In the primitive
ventricle, it is present in both the subpulmonic and subaortic regions.
During transfer of the aorta to the LV, the subaortic component gets
resorbed and is represented by fibrous continuity between the aortic and
mitral valve leaflets. The subpulmonary component, however, persists and
separates the pulmonary and tricuspid valve. A VSD is also seen (double
arrow). (C) Volume-rendered image further confirms the levotransposition of
the aorta, which is located leftward and anterior to the pulmonary trunk. Ao
= aorta, CT = conal tissue, LA = left atrium, LV = left ventricle, MPA =
main pulmonary artery, RA = right atrium, RV = right ventricle, VSD =
ventricular septal defect.
Figure 27:
Preoperative appearance of congenitally corrected transposition of the great arteries in a 25-year-old woman. (A) Axial oblique maximum intensity projection (MIP) CT image shows atrioventricular discordance. The RV is identified by the moderator band (black arrow). (B) Coronal oblique MIP CT image shows ventriculoarterial discordance. The aorta arises from the left-sided RV, and the pulmonary artery arises from the right-sided LV. The RV is identified by the trabeculated wall (yellow arrow). A thick conal tissue (black arrow) is seen in the subpulmonic region. In the primitive ventricle, it is present in both the subpulmonic and subaortic regions. During transfer of the aorta to the LV, the subaortic component gets resorbed and is represented by fibrous continuity between the aortic and mitral valve leaflets. The subpulmonary component, however, persists and separates the pulmonary and tricuspid valve. A VSD is also seen (double arrow). (C) Volume-rendered image further confirms the levotransposition of the aorta, which is located leftward and anterior to the pulmonary trunk. Ao = aorta, CT = conal tissue, LA = left atrium, LV = left ventricle, MPA = main pulmonary artery, RA = right atrium, RV = right ventricle, VSD = ventricular septal defect.
Postoperative appearance of levotransposition of the great arteries
after double-switch operation (Senning procedure and arterial switch) in an
8-year-old boy. (A) Coronal oblique maximum intensity projection (MIP) CT
image and (B) coronal oblique cut volume-rendered image show the systemic
venous limb of the baffle emptying systemic venous blood into the left
atrium and morphologic right ventricle (long curved black arrows). There is
evidence of severe stenosis in the systemic venous limb (red arrow). Also,
note the right and left pulmonary arteries (short straight black arrows in
B) lying on either side of the aorta as the normal postoperative appearance
of LeCompte maneuver. (C) Axial MIP CT image and (D) axial cut
volume-rendered images show the pulmonary venous limb of the baffle emptying
pulmonary venous blood into the right atrium and morphologic left ventricle
(long curved black arrow). Ao = aorta, IVC = inferior vena cava, LA = left
atrium, LPA = left pulmonary artery, LV = left ventricle, PVL = pulmonary
venous limb, RPA = right pulmonary artery, RA = right atrium, RV = right
ventricle, SVC = superior vena cava, SVL = systemic venous limb.
Figure 28:
Postoperative appearance of levotransposition of the great arteries after double-switch operation (Senning procedure and arterial switch) in an 8-year-old boy. (A) Coronal oblique maximum intensity projection (MIP) CT image and (B) coronal oblique cut volume-rendered image show the systemic venous limb of the baffle emptying systemic venous blood into the left atrium and morphologic right ventricle (long curved black arrows). There is evidence of severe stenosis in the systemic venous limb (red arrow). Also, note the right and left pulmonary arteries (short straight black arrows in B) lying on either side of the aorta as the normal postoperative appearance of LeCompte maneuver. (C) Axial MIP CT image and (D) axial cut volume-rendered images show the pulmonary venous limb of the baffle emptying pulmonary venous blood into the right atrium and morphologic left ventricle (long curved black arrow). Ao = aorta, IVC = inferior vena cava, LA = left atrium, LPA = left pulmonary artery, LV = left ventricle, PVL = pulmonary venous limb, RPA = right pulmonary artery, RA = right atrium, RV = right ventricle, SVC = superior vena cava, SVL = systemic venous limb.
Diagram shows two commonly used classification systems for truncus
arteriosus. Top row represents the Collett and Edwards system. Type I truncus
arteriosus is characterized by origin of the main pulmonary trunk from the
truncus, which further divides into the right and left pulmonary arteries; type
II is characterized by the separate origin of the right and left pulmonary
arteries from the posterior aspect of the truncus; type III is characterized by
the separate origin of the right and left pulmonary arteries from the lateral
aspect of the truncus; and type IV represents pseudotruncus (pulmonary atresia
with a ventricular septal defect). Bottom row represents the Van Praagh system.
Types A1 and A2 are equivalent to the Collett and Edwards types I and II,
respectively; type A3 is characterized by atresia of the left or right pulmonary
artery, with collateral flow to the ipsilateral lung; and type A4 is
characterized by the presence of an associated interrupted aortic arch.
(Adapted, with permission, from references 131 and 132.)
Figure 29:
Diagram shows two commonly used classification systems for truncus arteriosus. Top row represents the Collett and Edwards system. Type I truncus arteriosus is characterized by origin of the main pulmonary trunk from the truncus, which further divides into the right and left pulmonary arteries; type II is characterized by the separate origin of the right and left pulmonary arteries from the posterior aspect of the truncus; type III is characterized by the separate origin of the right and left pulmonary arteries from the lateral aspect of the truncus; and type IV represents pseudotruncus (pulmonary atresia with a ventricular septal defect). Bottom row represents the Van Praagh system. Types A1 and A2 are equivalent to the Collett and Edwards types I and II, respectively; type A3 is characterized by atresia of the left or right pulmonary artery, with collateral flow to the ipsilateral lung; and type A4 is characterized by the presence of an associated interrupted aortic arch. (Adapted, with permission, from references and .)
Postoperative appearance of truncus arteriosus after RV-PA conduit
formation and VSD closure in an 11-year-old boy. (A) Axial contrast-enhanced
CT image shows a calcified VSD patch bulging into the RV (black arrow). (B)
Coronal oblique contrast-enhanced CT image shows the RV-PA conduit. The
pulmonary valve leaflets show degenerative changes evident as leaflet
calcifications (black arrows). Ao = aorta, C = conduit, LA = left atrium, LV
= left ventricle, PA = pulmonary artery, RA = right atrium, RV = right
ventricle, VSD = ventricular septal defect.
Figure 30:
Postoperative appearance of truncus arteriosus after RV-PA conduit formation and VSD closure in an 11-year-old boy. (A) Axial contrast-enhanced CT image shows a calcified VSD patch bulging into the RV (black arrow). (B) Coronal oblique contrast-enhanced CT image shows the RV-PA conduit. The pulmonary valve leaflets show degenerative changes evident as leaflet calcifications (black arrows). Ao = aorta, C = conduit, LA = left atrium, LV = left ventricle, PA = pulmonary artery, RA = right atrium, RV = right ventricle, VSD = ventricular septal defect.
Postoperative appearance of truncus arteriosus after RV-PA conduit
formation and VSD closure in a 13-year-old boy. (A) Axial maximum intensity
projection CT image shows mild stenosis in the MPA at the anastomotic site
of the conduit (yellow arrow). (B) Volume-rendered image confirms these
findings. Ao = aorta, C = conduit, LPA = left PA, MPA = main PA, PA =
pulmonary artery, RPA = right PA, RV = right ventricle, VSD = ventricular
septal defect.
Figure 31:
Postoperative appearance of truncus arteriosus after RV-PA conduit formation and VSD closure in a 13-year-old boy. (A) Axial maximum intensity projection CT image shows mild stenosis in the MPA at the anastomotic site of the conduit (yellow arrow). (B) Volume-rendered image confirms these findings. Ao = aorta, C = conduit, LPA = left PA, MPA = main PA, PA = pulmonary artery, RPA = right PA, RV = right ventricle, VSD = ventricular septal defect.
Diagrams showing the three types of interrupted aortic arch. Type A (left)
is characterized by aortic arch interruption distal to the left subclavian
artery origin; type B (middle) is characterized by aortic arch interruption
between the origins of the left common carotid artery and left subclavian
artery; and type C (right) is characterized by aortic arch interruption between
the origins of the innominate and left common carotid arteries. Ao = aorta, LCCA
= left common carotid artery, LSCA = left subclavian artery, PA = pulmonary
artery, PDA = patent ductus arteriosus. (Reprinted, with permission, from
reference 124.)
Figure 32:
Diagrams showing the three types of interrupted aortic arch. Type A (left) is characterized by aortic arch interruption distal to the left subclavian artery origin; type B (middle) is characterized by aortic arch interruption between the origins of the left common carotid artery and left subclavian artery; and type C (right) is characterized by aortic arch interruption between the origins of the innominate and left common carotid arteries. Ao = aorta, LCCA = left common carotid artery, LSCA = left subclavian artery, PA = pulmonary artery, PDA = patent ductus arteriosus. (Reprinted, with permission, from reference .)
Preoperative appearance of type B interrupted aortic arch with
aortopulmonary window in a neonate. (A) Sagittal oblique maximum intensity
projection (MIP) CT image shows interrupted aortic arch (red arrow). Both
the right and left common carotid arteries arise from the arch proximal to
the site of interruption. The descending thoracic aorta is filled by a large
left patent duct connecting the left pulmonary artery and descending
thoracic aorta. (B) Anterior and (C) posterior three-dimensional
volume-rendered images confirm the aortic arch interruption. The proximal
ascending aorta and pulmonary trunk are connected, suggesting aortopulmonary
window (red star in B). (D) Axial MIP CT image shows aortopulmonary window
(red star). Ao = aorta, DA = descending aorta, LCC = left common carotid
artery, LPA = left pulmonary artery, LSA = left subclavian artery, MPA =
main pulmonary artery, PD = patent duct, RCC = right common carotid artery,
RPA = right pulmonary artery, RSA = right subclavian artery.
Figure 33:
Preoperative appearance of type B interrupted aortic arch with aortopulmonary window in a neonate. (A) Sagittal oblique maximum intensity projection (MIP) CT image shows interrupted aortic arch (red arrow). Both the right and left common carotid arteries arise from the arch proximal to the site of interruption. The descending thoracic aorta is filled by a large left patent duct connecting the left pulmonary artery and descending thoracic aorta. (B) Anterior and (C) posterior three-dimensional volume-rendered images confirm the aortic arch interruption. The proximal ascending aorta and pulmonary trunk are connected, suggesting aortopulmonary window (red star in B). (D) Axial MIP CT image shows aortopulmonary window (red star). Ao = aorta, DA = descending aorta, LCC = left common carotid artery, LPA = left pulmonary artery, LSA = left subclavian artery, MPA = main pulmonary artery, PD = patent duct, RCC = right common carotid artery, RPA = right pulmonary artery, RSA = right subclavian artery.
Postoperative appearance of type A interrupted aortic arch after
primary anastomosis repair in a 17-year-old boy. (A) Sagittal oblique
maximum intensity projection (MIP) CT image shows a large pseudoaneurysm
(red star) arising at the site of anastomosis (junction of aortic arch and
descending thoracic aorta). (B) Axial MIP CT image shows the large lobulated
pseudoaneurysm (red star) occupying the thoracic cavity, displacing the
adjacent lung parenchyma peripherally and extending into the neural foramen
(yellow arrow). A nonenhancing hypodense thrombus (green arrow) is observed
within it. (C) Volume-rendered image confirms the findings. Note the broad
neck of the pseudoaneurysm (red star) arising from the site of anastomosis.
Ao = aorta, BA = brachiocephalic artery, DTA = descending thoracic aorta,
LCC = left common carotid artery, LSA = left subclavian artery, RCC = right
common carotid artery.
Figure 34:
Postoperative appearance of type A interrupted aortic arch after primary anastomosis repair in a 17-year-old boy. (A) Sagittal oblique maximum intensity projection (MIP) CT image shows a large pseudoaneurysm (red star) arising at the site of anastomosis (junction of aortic arch and descending thoracic aorta). (B) Axial MIP CT image shows the large lobulated pseudoaneurysm (red star) occupying the thoracic cavity, displacing the adjacent lung parenchyma peripherally and extending into the neural foramen (yellow arrow). A nonenhancing hypodense thrombus (green arrow) is observed within it. (C) Volume-rendered image confirms the findings. Note the broad neck of the pseudoaneurysm (red star) arising from the site of anastomosis. Ao = aorta, BA = brachiocephalic artery, DTA = descending thoracic aorta, LCC = left common carotid artery, LSA = left subclavian artery, RCC = right common carotid artery.

Similar articles

Cited by

References

    1. Restivo A , Piacentini G , Placidi S , Saffirio C , Marino B . Cardiac outflow tract: a review of some embryogenetic aspects of the conotruncal region of the heart . Anat Rec A Discov Mol Cell Evol Biol 2006. ; 288 ( 9 ): 936 – 943 . - PubMed
    1. Mcleod G , Shum K , Gupta T , et al. . Echocardiography in congenital heart disease . Prog Cardiovasc Dis 2018. ; 61 ( 5-6 ): 468 – 475 . - PubMed
    1. Frank L , Dillman JR , Parish V , et al. . Cardiovascular MR imaging of conotruncal anomalies . RadioGraphics 2010. ; 30 ( 4 ): 1069 – 1094 . - PubMed
    1. Kang SL , Benson L . Recent advances in cardiac catheterization for congenital heart disease . F1000 Res 2018. ; 7 : 370 . - PMC - PubMed
    1. Goo HW , Park IS , Ko JK , Kim YH , Seo DM , Park JJ . Computed tomography for the diagnosis of congenital heart disease in pediatric and adult patients . Int J Cardiovasc Imaging 2005. ; 21 ( 2-3 ): 347 – 365 ; discussion 367. - PubMed