

Incongruity of Geometric and Spectral Markers in the Assessment of Body Sway
- PMID: 35923830
- PMCID: PMC9339954
- DOI: 10.3389/fneur.2022.929132
Incongruity of Geometric and Spectral Markers in the Assessment of Body Sway
Abstract
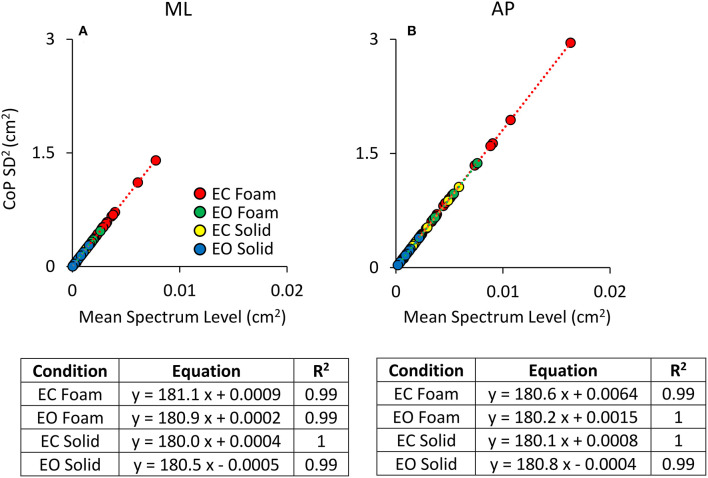
Different measurements of body oscillations in the time or frequency domain are being employed as markers of gait and balance abnormalities. This study investigates basic relationships within and between geometric and spectral measures in a population of young adult subjects. Twenty healthy subjects stood with parallel feet on a force platform with and without a foam pad. Adaptation effects to prolonged stance were assessed by comparing the first and last of a series of eight successive trials. Centre of Foot Pressure (CoP) excursions were recorded with Eyes Closed (EC) and Open (EO) for 90s. Geometric measures (Sway Area, Path Length), standard deviation (SD) of the excursions, and spectral measure (mean power Spectrum Level and Median Frequency), along the medio-lateral (ML) and antero-posterior (AP) direction were computed. Sway Area was more strongly associated than Path Length with CoP SD and, consequently, with mean Spectrum Level for both ML and AP, and both visual and surface conditions. The squared-SD directly specified the mean power Spectrum Level of CoP excursions (ML and AP) in all conditions. Median Frequency was hardly related to Spectrum Level. Adaptation had a confounding effect, whereby equal values of Sway Area, Path Length, and Spectrum Level corresponded to different Median Frequency values. Mean Spectrum Level and SDs of the time series of CoP ML and AP excursions convey the same meaning and bear an acceptable correspondence with Sway Area values. Shifts in Median Frequency values represent important indications of neuromuscular control of stance and of the effects of vision, support conditions, and adaptation. The Romberg Quotient EC/EO for a given variable is contingent on the compliance of the base of support and adaptation, and different between Sway Area and Path Length, but similar between Sway Area and Spectrum Level (AP and ML). These measures must be taken with caution in clinical studies, and considered together in order to get a reliable indication of overall body sway, of modifications by sensory and standing condition, and of changes with ageing, medical conditions and rehabilitation treatment. However, distinct measures shed light on the discrete mechanisms and complex processes underpinning the maintenance of stance.
Keywords: CoP excursion; Path Length; Sway Area; adaptation; frequency spectrum; stance; support surface; vision.
Copyright © 2022 Sozzi, Ghai and Schieppati.
Conflict of interest statement
SG is employed by Rsgbiogen. The remaining authors declare that the research was conducted in the absence of any commercial or financial relationships that could be construed as a potential conflict of interest.
Figures


Similar articles
-
The 'Postural Rhythm' of the Ground Reaction Force during Upright Stance and Its Conversion to Body Sway-The Effect of Vision, Support Surface and Adaptation to Repeated Trials.Brain Sci. 2023 Jun 21;13(7):978. doi: 10.3390/brainsci13070978. Brain Sci. 2023. PMID: 37508910 Free PMC article.
-
Vertical ground reaction force oscillation during standing on hard and compliant surfaces: The "postural rhythm".Front Neurol. 2022 Sep 1;13:975752. doi: 10.3389/fneur.2022.975752. eCollection 2022. Front Neurol. 2022. PMID: 36119676 Free PMC article.
-
Balance Adaptation While Standing on a Compliant Base Depends on the Current Sensory Condition in Healthy Young Adults.Front Hum Neurosci. 2022 Mar 25;16:839799. doi: 10.3389/fnhum.2022.839799. eCollection 2022. Front Hum Neurosci. 2022. PMID: 35399363 Free PMC article.
-
Specific Posture-Stabilising Effects of Vision and Touch Are Revealed by Distinct Changes of Body Oscillation Frequencies.Front Neurol. 2021 Nov 22;12:756984. doi: 10.3389/fneur.2021.756984. eCollection 2021. Front Neurol. 2021. PMID: 34880823 Free PMC article.
-
Age-related changes in the range and velocity of postural sway.Arch Gerontol Geriatr. 2018 Jul-Aug;77:68-80. doi: 10.1016/j.archger.2018.04.007. Epub 2018 Apr 9. Arch Gerontol Geriatr. 2018. PMID: 29684741
Cited by
-
The 'Postural Rhythm' of the Ground Reaction Force during Upright Stance and Its Conversion to Body Sway-The Effect of Vision, Support Surface and Adaptation to Repeated Trials.Brain Sci. 2023 Jun 21;13(7):978. doi: 10.3390/brainsci13070978. Brain Sci. 2023. PMID: 37508910 Free PMC article.
-
Postural control impairments following neurotoxic chemotherapy in women with cancer: a prospective observational study.BMC Womens Health. 2025 May 30;25(1):269. doi: 10.1186/s12905-025-03790-4. BMC Womens Health. 2025. PMID: 40448057 Free PMC article.
-
Vertical ground reaction force oscillation during standing on hard and compliant surfaces: The "postural rhythm".Front Neurol. 2022 Sep 1;13:975752. doi: 10.3389/fneur.2022.975752. eCollection 2022. Front Neurol. 2022. PMID: 36119676 Free PMC article.
-
Closing the gap while standing still: clinimetric properties of a low-cost balance platform and a user-friendly app for posturography.PeerJ. 2025 Feb 4;13:e18299. doi: 10.7717/peerj.18299. eCollection 2025. PeerJ. 2025. PMID: 39926035 Free PMC article.
-
Pupillometry as a biomarker of postural control: Deep-learning models reveal side-specific pupillary responses to increased intensity of balance tasks.Psychophysiology. 2024 Dec;61(12):e14667. doi: 10.1111/psyp.14667. Epub 2024 Aug 12. Psychophysiology. 2024. PMID: 39135357 Free PMC article.
References
LinkOut - more resources
Full Text Sources