

Machine Learning for Predicting Lower Extremity Muscle Strain in National Basketball Association Athletes
- PMID: 35923866
- PMCID: PMC9340342
- DOI: 10.1177/23259671221111742
Machine Learning for Predicting Lower Extremity Muscle Strain in National Basketball Association Athletes
Abstract
Background: In professional sports, injuries resulting in loss of playing time have serious implications for both the athlete and the organization. Efforts to quantify injury probability utilizing machine learning have been met with renewed interest, and the development of effective models has the potential to supplement the decision-making process of team physicians.
Purpose/hypothesis: The purpose of this study was to (1) characterize the epidemiology of time-loss lower extremity muscle strains (LEMSs) in the National Basketball Association (NBA) from 1999 to 2019 and (2) determine the validity of a machine-learning model in predicting injury risk. It was hypothesized that time-loss LEMSs would be infrequent in this cohort and that a machine-learning model would outperform conventional methods in the prediction of injury risk.
Study design: Case-control study; Level of evidence, 3.
Methods: Performance data and rates of the 4 major muscle strain injury types (hamstring, quadriceps, calf, and groin) were compiled from the 1999 to 2019 NBA seasons. Injuries included all publicly reported injuries that resulted in lost playing time. Models to predict the occurrence of a LEMS were generated using random forest, extreme gradient boosting (XGBoost), neural network, support vector machines, elastic net penalized logistic regression, and generalized logistic regression. Performance was compared utilizing discrimination, calibration, decision curve analysis, and the Brier score.
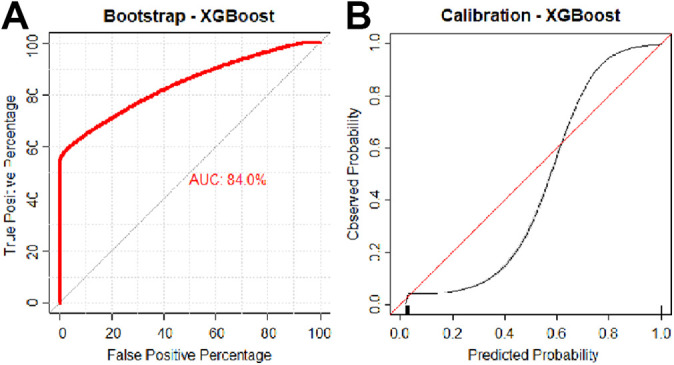
Results: A total of 736 LEMSs resulting in lost playing time occurred among 2103 athletes. Important variables for predicting LEMS included previous number of lower extremity injuries; age; recent history of injuries to the ankle, hamstring, or groin; and recent history of concussion as well as 3-point attempt rate and free throw attempt rate. The XGBoost machine achieved the best performance based on discrimination assessed via internal validation (area under the receiver operating characteristic curve, 0.840), calibration, and decision curve analysis.
Conclusion: Machine learning algorithms such as XGBoost outperformed logistic regression in the prediction of a LEMS that will result in lost time. Several variables increased the risk of LEMS, including a history of various lower extremity injuries, recent concussion, and total number of previous injuries.
Keywords: loss of playing time; lower extremity; machine learning; muscle strain; professional athletes.
© The Author(s) 2022.
Conflict of interest statement
One or more of the authors has declared the following potential conflict of interest or source of funding: Support was received from the Foderaro-Quattrone Musculoskeletal-Orthopaedic Surgery Research Innovation Fund. A.P. has received consulting fees from Moximed. B.F. has received research support from Arthrex and Smith & Nephew, education payments from Medwest, consulting fees from Smith & Nephew and Stryker, royalties from Elsevier, and stock/stock options from iBrainTech, Jace Medical, and Sparta Biopharma. C.L.C. has received nonconsulting fees from Arthrex. AOSSM checks author disclosures against the Open Payments Database (OPD). AOSSM has not conducted an independent investigation on the OPD and disclaims any liability or responsibility relating thereto.
Figures


References
-
- Camp CL, Dines JS, van der List JP, et al. Summative report on time out of play for Major and Minor League Baseball: an analysis of 49,955 injuries from 2011 through 2016. Am J Sports Med. 2018;46(7):1727–1732. - PubMed
-
- Cheng WL, Jaafar Z. Effects of lateral ankle sprain on range of motion, strength and postural balance in competitive basketball players: a cross-sectional study. J Sports Med Phys Fitness. 2020;60(6):895–902. - PubMed
-
- Collins GS, Reitsma JB, Altman DG, Moons KG. Transparent reporting of a multivariable prediction model for individual prognosis or diagnosis (TRIPOD): the TRIPOD statement. Br J Surg. 2015;102(3):148–158. - PubMed
-
- Cripps A, Livingston S, Jiang Y, et al. Visual perturbation impacts upright postural stability in athletes with an acute concussion. Brain Inj. 2018;32(12):1566–1575. - PubMed
Grants and funding
LinkOut - more resources
Full Text Sources
Miscellaneous
