

Application of fluoride disturbs plaque microecology and promotes remineralization of enamel initial caries
- PMID: 35923900
- PMCID: PMC9341347
- DOI: 10.1080/20002297.2022.2105022
Application of fluoride disturbs plaque microecology and promotes remineralization of enamel initial caries
Abstract
Background: The caries-preventive effect of topical fluoride application has been corroborated by a number of clinical studies. However, the effect of fluoride on oral microecology remains unclear.
Objective: To monitor the effect of fluoride on dental plaque microecology and demineralization/remineralization balance of enamel initial caries.
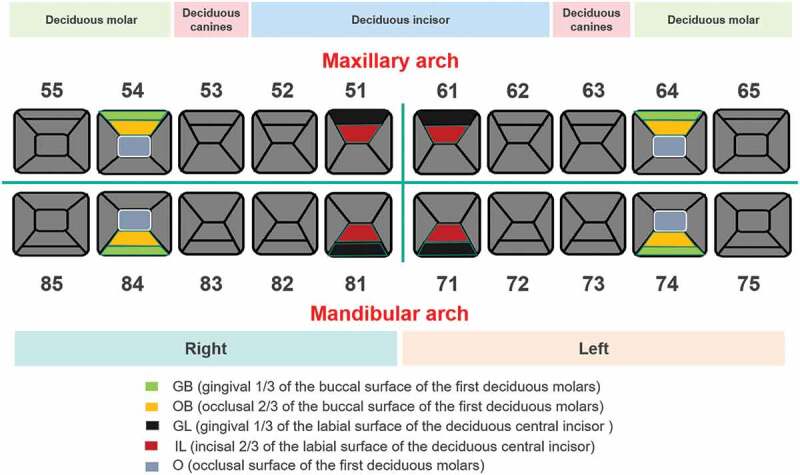
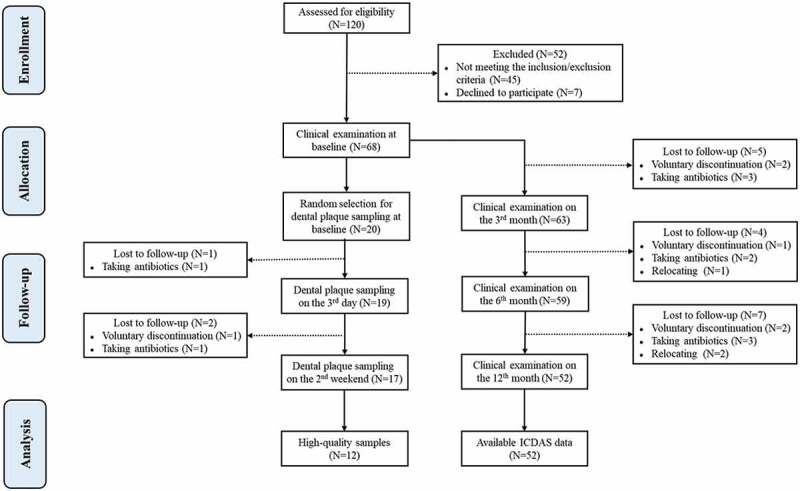
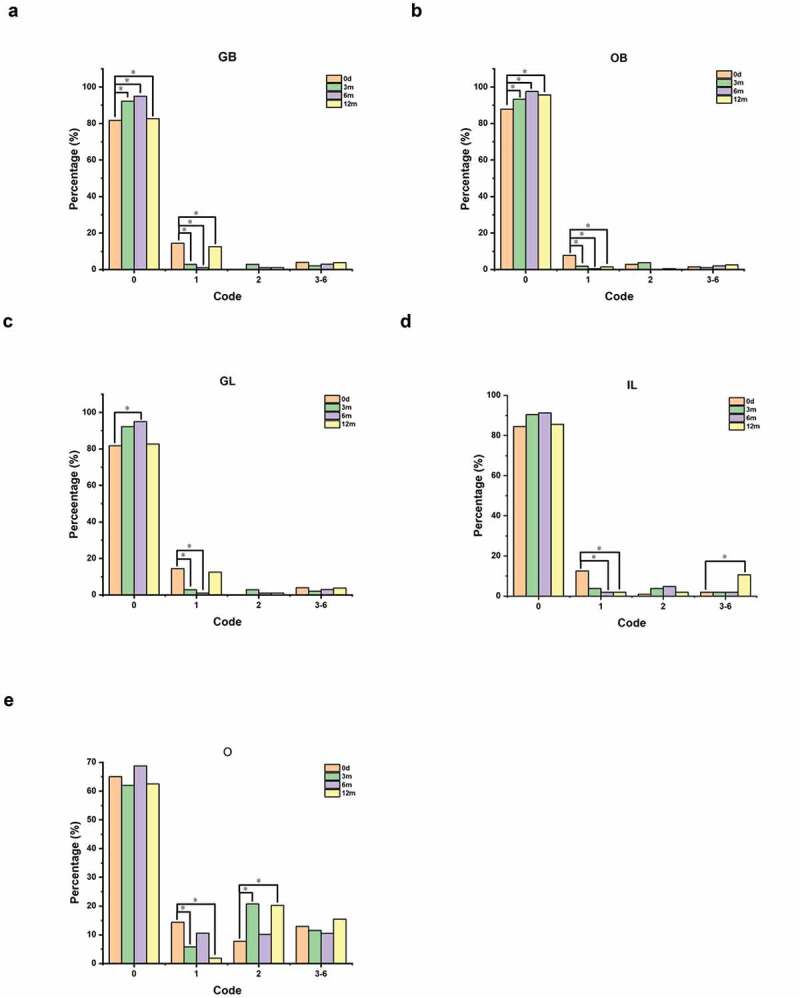
Methods: Three-year-old children were enrolled and treated with fluoride at baseline and 6 months. International Caries Detection and Assessment System II indices of 52 subjects were measured at baseline, 3, 6, and 12 months. Supragingival plaque samples of 12 subjects were collected at baseline, 3 and 14 days for 16S rRNA sequencing.
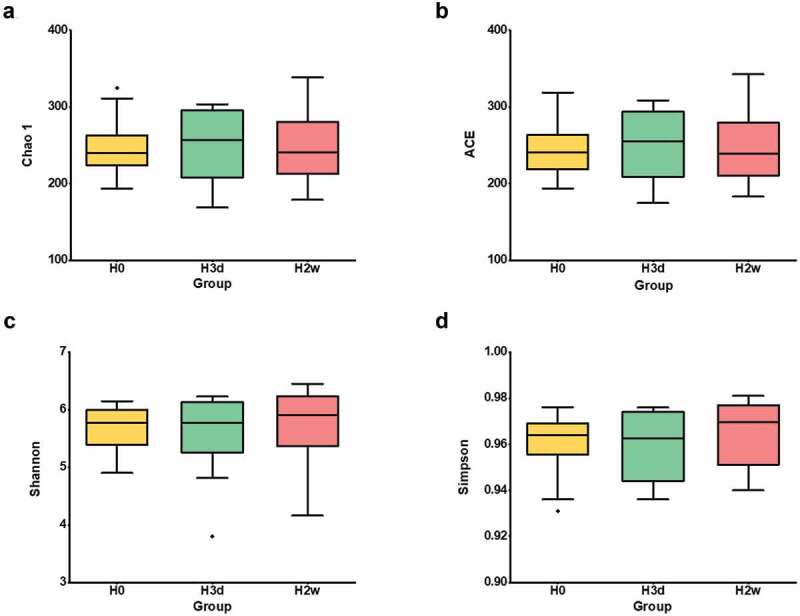
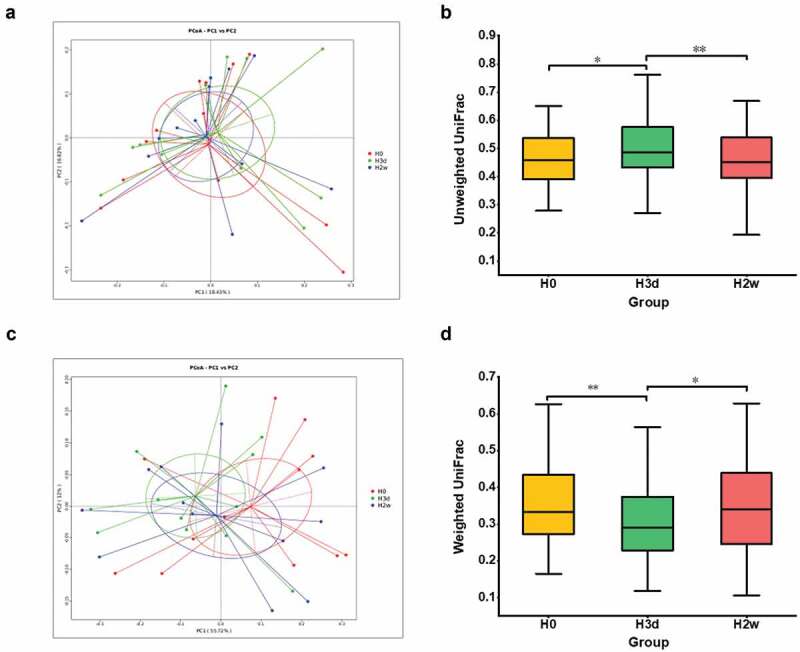
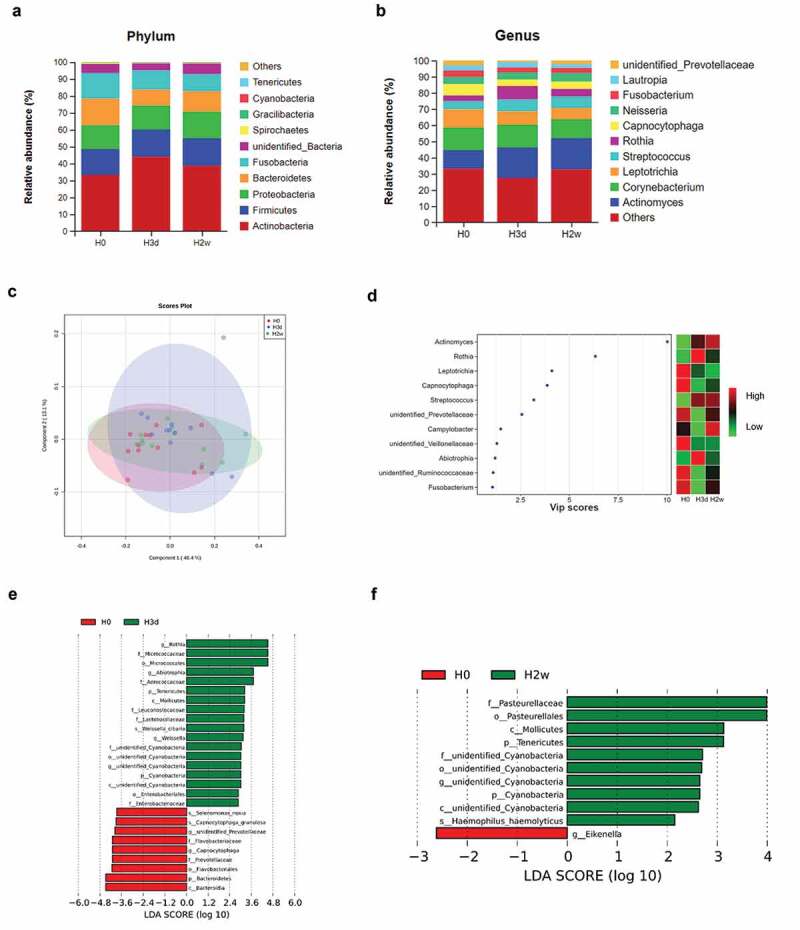
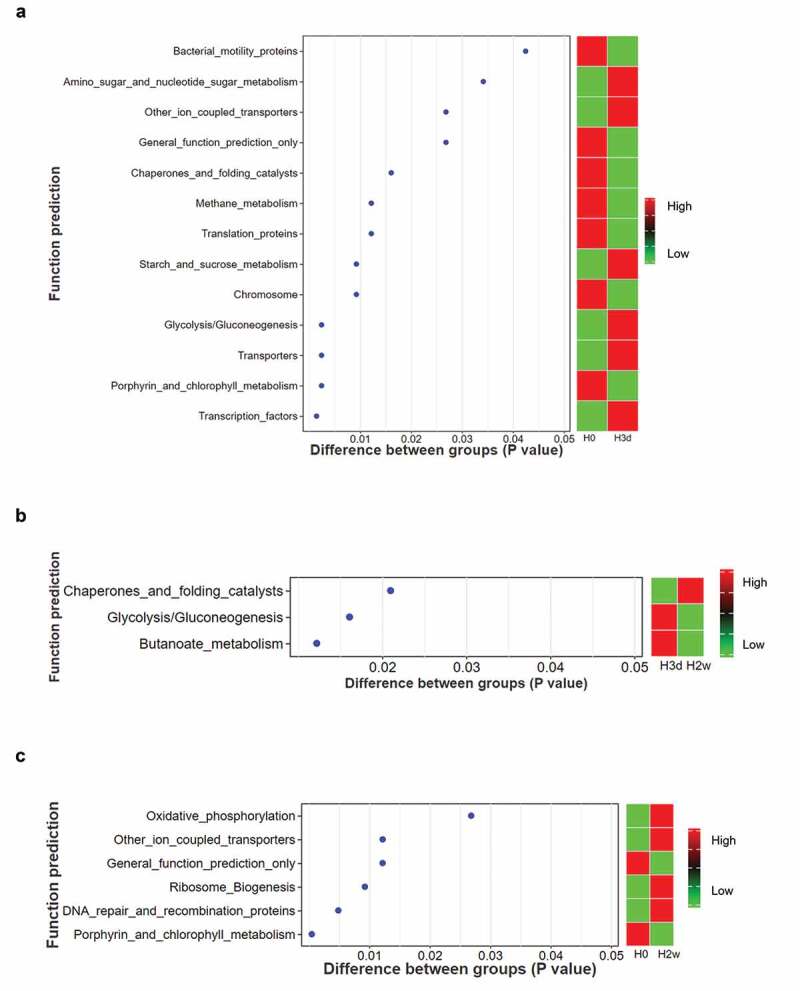
Results: Changes in microbial community structure were observed at 3 days after fluoridation. Significant changes in the relative abundance of microorganisms were observed after fluoride application, especially Capnocytophaga, unidentified Prevotellaceae and Rothia. Functional prediction revealed that cell movement, carbohydrate and energy metabolism were affected significantly after fluoride application. Fluoride significantly inhibited enamel demineralization and promoted remineralization of early demineralized caries enamel at 3 months.
Conclusion: Fluoride application significantly inhibited the progression of enamel initial caries and reversed the demineralization process, possibly by disturbing dental plaque microecology and modulating the physicochemical action of demineralization/remineralization. This deepened our understanding of caries-preventive effects and mechanisms of fluoride.
Keywords: 16S rRNA sequencing; Fluoride; ICDAS II; enamel initial caries; oral microecology.
© 2022 The Author(s). Published by Informa UK Limited, trading as Taylor & Francis Group.
Conflict of interest statement
No potential conflict of interest was reported by the author(s).
Figures
Similar articles
-
Topical fluoride varnish application shifts dysbiotic dental plaque microbiome towards eubiosis in children with dental caries.Saudi Dent J. 2024 Oct;36(10):1313-1320. doi: 10.1016/j.sdentj.2024.07.010. Epub 2024 Jul 16. Saudi Dent J. 2024. PMID: 39525937 Free PMC article.
-
In situ clinical effects of new dentifrices containing 1.5% arginine and fluoride on enamel de- and remineralization and plaque metabolism.J Clin Dent. 2013;24 Spec no A:A32-44. J Clin Dent. 2013. PMID: 24156138 Clinical Trial.
-
Effects of the association of high fluoride- and calcium-containing caries-preventive agents with regular or high fluoride toothpaste on enamel: an in vitro study.Clin Oral Investig. 2022 Mar;26(3):3167-3178. doi: 10.1007/s00784-021-04299-4. Epub 2021 Nov 24. Clin Oral Investig. 2022. PMID: 34816310
-
Biological factors in dental caries: role of remineralization and fluoride in the dynamic process of demineralization and remineralization (part 3).J Clin Pediatr Dent. 2004 Spring;28(3):203-14. doi: 10.17796/jcpd.28.3.w0610427l746j34n. J Clin Pediatr Dent. 2004. PMID: 15163148 Review.
-
[Factors that modify de- and remineralization in dental enamel from the aspect of caries susceptibility].Ann Acad Med Stetin. 1999;Suppl 47:1-89. Ann Acad Med Stetin. 1999. PMID: 10462837 Review. Polish.
Cited by
-
Effect of intensive application of self-assembling peptide P11-4 with fluoride, casein phosphopeptide amorphous calcium phosphate fluoride and sodium fluoride on streptococcus mutans level in preschool children: a randomized controlled clinical trial.Clin Oral Investig. 2025 Mar 19;29(4):196. doi: 10.1007/s00784-024-06133-z. Clin Oral Investig. 2025. PMID: 40106002 Free PMC article. Clinical Trial.
-
Expert consensus on the prevention and treatment of enamel demineralization in orthodontic treatment.Int J Oral Sci. 2025 Mar 1;17(1):13. doi: 10.1038/s41368-024-00335-7. Int J Oral Sci. 2025. PMID: 40021614 Free PMC article.
-
Topical fluoride varnish application shifts dysbiotic dental plaque microbiome towards eubiosis in children with dental caries.Saudi Dent J. 2024 Oct;36(10):1313-1320. doi: 10.1016/j.sdentj.2024.07.010. Epub 2024 Jul 16. Saudi Dent J. 2024. PMID: 39525937 Free PMC article.
-
Efficacy evaluation of zirconia crown on primary molars with caries defects.Hua Xi Kou Qiang Yi Xue Za Zhi. 2024 Oct 1;42(5):652-659. doi: 10.7518/hxkq.2024.2024122. Hua Xi Kou Qiang Yi Xue Za Zhi. 2024. PMID: 39304509 Free PMC article. Chinese, English.
-
The influence of diet, saliva, and dental history on the oral microbiome in healthy, caries-free Australian adults.Sci Rep. 2025 May 28;15(1):18755. doi: 10.1038/s41598-025-03455-0. Sci Rep. 2025. PMID: 40436959 Free PMC article.
References
LinkOut - more resources
Full Text Sources