

IFN-γ and LPS Induce Synergistic Expression of CCL2 in Monocytic Cells via H3K27 Acetylation
- PMID: 35923906
- PMCID: PMC9343018
- DOI: 10.2147/JIR.S368352
IFN-γ and LPS Induce Synergistic Expression of CCL2 in Monocytic Cells via H3K27 Acetylation
Abstract
Background: Overexpression of CCL2 (MCP-1) has been implicated in pathogenesis of metabolic conditions, such as obesity and T2D. However, the mechanisms leading to increased CCL2 expression in obesity are not fully understood. Since both IFN-γ and LPS levels are found to be elevated in obesity and shown to be involved in the regulation of metabolic inflammation and insulin resistance, we investigated whether these two agents could synergistically trigger the expression of CCL2 in obesity.
Methods: Monocytes (Human monocytic THP-1 cells) were stimulated with IFN-γ and LPS. CCL2 gene expression was determined by real-time RT-PCR. CCL2 protein was determined by ELISA. Signaling pathways were identified by using epigenetic inhibitors and STAT1 siRNA. Acetylation of H3K27 was analyzed by Western blotting. The acetylation level of histone H3K27 in the transcriptional initiation region of CCL2 gene was determined by ChIP-qPCR.
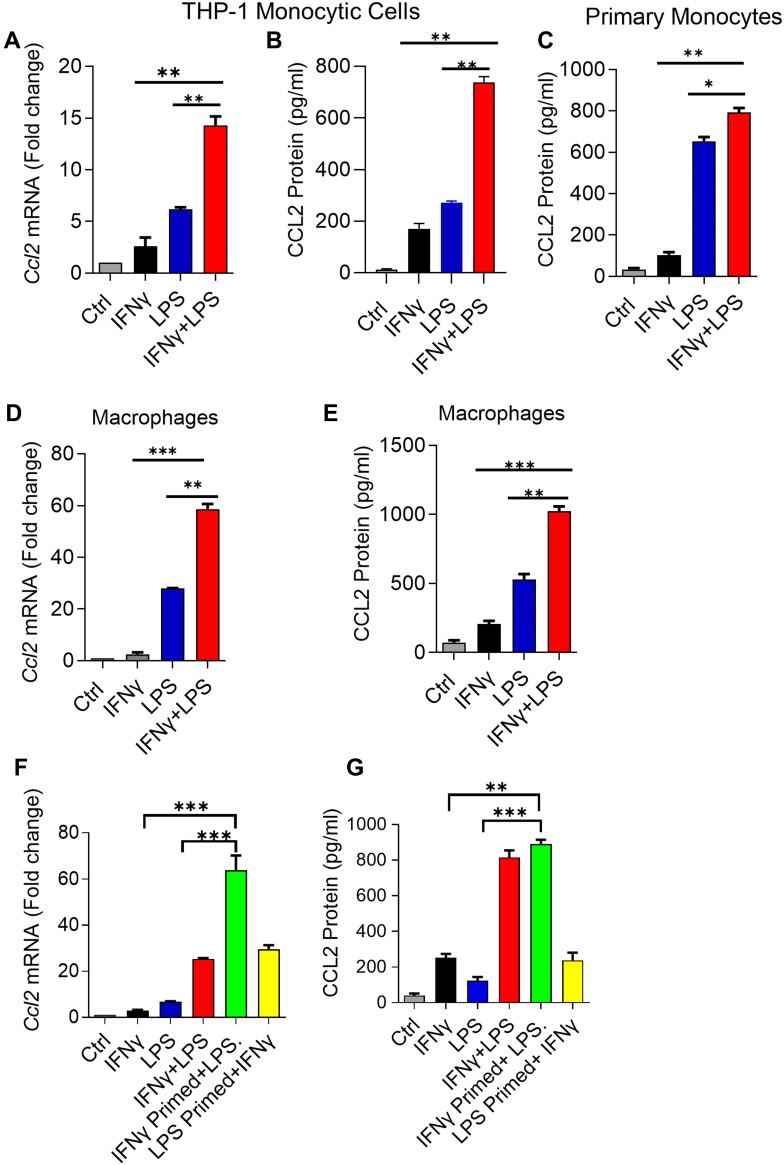
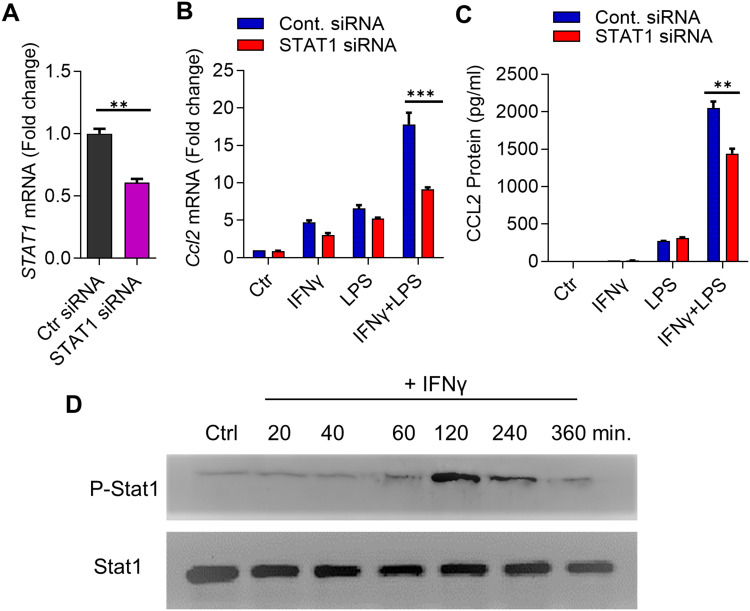
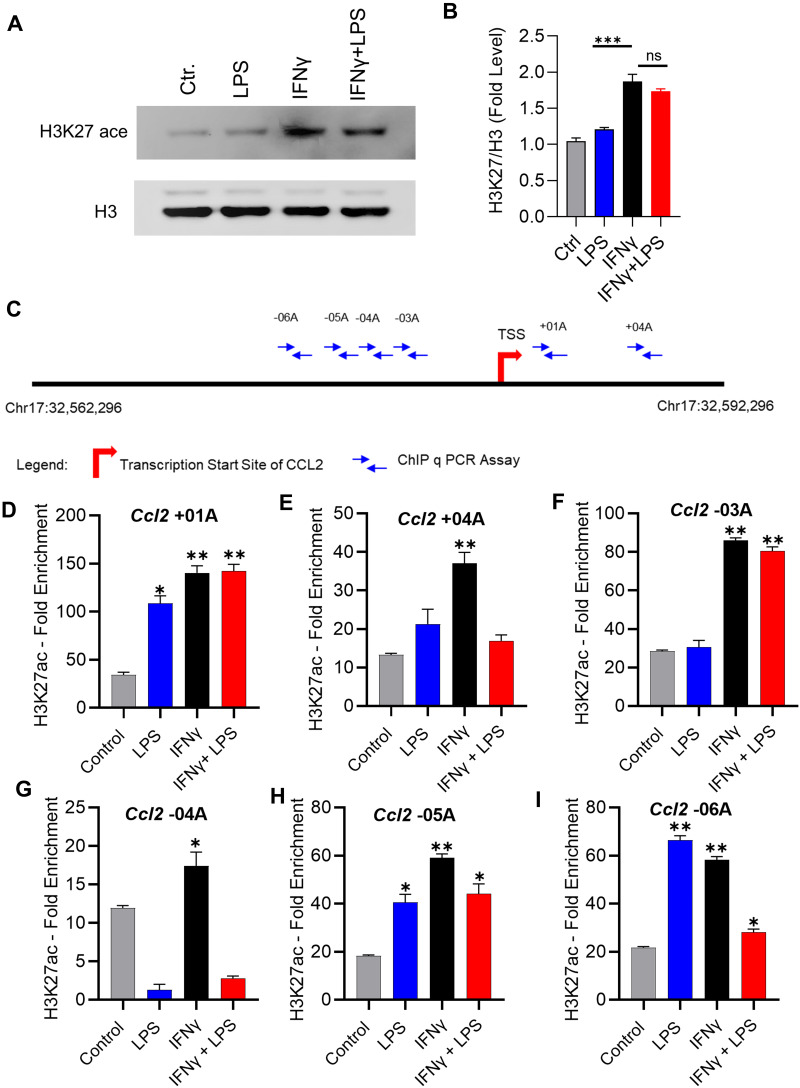
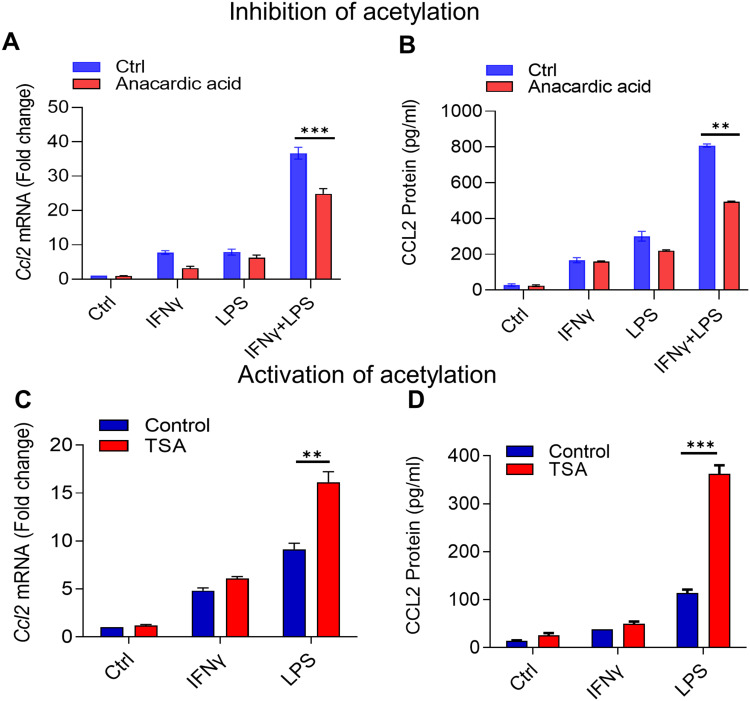
Results: Our results show that the co-incubation of THP-1 monocytes with IFN-γ and LPS significantly enhanced the expression of CCL2, compared to treatment with IFN-γ or LPS alone. Similar results were obtained using primary monocytes and macrophages. Interestingly, IFN-γ priming was found to be more effective than LPS priming in inducing synergistic expression of CCL2. Moreover, STAT1 deficiency significantly suppressed this synergy for CCL2 expression. Mechanistically, we showed that IFN-γ priming induced acetylation of lysine 27 on histone 3 (H3K27ac) in THP-1 cells. Chromatin immunoprecipitation (ChIP) assay followed by qRT-PCR revealed increased H3K27ac at the CCL2 promoter proximal region, resulting in stabilized gene expression. Furthermore, inhibition of histone acetylation with anacardic acid suppressed this synergistic response, whereas trichostatin A (TSA) could substitute IFN-γ in this synergy.
Conclusion: Our findings suggest that IFN-γ, in combination with LPS, has the potential to augment inflammation via the H3K27ac-mediated induction of CCL2 in monocytic cells in the setting of obesity.
Keywords: CCL2; H3K27 ac; IFN-γ; LPS; inflammation; monocytes/macrophages.
© 2022 Akhter et al.
Conflict of interest statement
The authors declare that they have no conflicts of interest.
Figures
Similar articles
-
Synergistic effects of lipopolysaccharide and interferon-gamma in inducing interleukin-8 production in human monocytic THP-1 cells is accompanied by up-regulation of CD14, Toll-like receptor 4, MD-2 and MyD88 expression.J Endotoxin Res. 2003;9(3):145-53. doi: 10.1179/096805103125001540. J Endotoxin Res. 2003. PMID: 12831455
-
Mycobacteria inhibition of IFN-gamma induced HLA-DR gene expression by up-regulating histone deacetylation at the promoter region in human THP-1 monocytic cells.J Immunol. 2005 May 1;174(9):5687-94. doi: 10.4049/jimmunol.174.9.5687. J Immunol. 2005. PMID: 15843570
-
Genome-wide profiling of histone H3K27 acetylation featured fatty acid signalling in pancreatic beta cells in diet-induced obesity in mice.Diabetologia. 2018 Dec;61(12):2608-2620. doi: 10.1007/s00125-018-4735-7. Epub 2018 Oct 3. Diabetologia. 2018. PMID: 30284014
-
TLR4/MyD88 -mediated CCL2 production by lipopolysaccharide (endotoxin): Implications for metabolic inflammation.J Diabetes Metab Disord. 2018 Apr 16;17(1):77-84. doi: 10.1007/s40200-018-0341-y. eCollection 2018 Jun. J Diabetes Metab Disord. 2018. PMID: 30288388 Free PMC article.
-
[Polarization of human acute monocytic leukemia THP-1 cells-derived macprophages induced by Nippostrongylus brasiliensis proteins in vitro].Zhongguo Xue Xi Chong Bing Fang Zhi Za Zhi. 2020 Jul 10;32(4):367-373. doi: 10.16250/j.32.1374.2020003. Zhongguo Xue Xi Chong Bing Fang Zhi Za Zhi. 2020. PMID: 32935510 Chinese.
Cited by
-
Fish Oil Supplementation Mitigates High-Fat Diet-Induced Obesity: Exploring Epigenetic Modulation and Genes Associated with Adipose Tissue Dysfunction in Mice.Pharmaceuticals (Basel). 2024 Jul 1;17(7):861. doi: 10.3390/ph17070861. Pharmaceuticals (Basel). 2024. PMID: 39065712 Free PMC article.
-
TNFα induces matrix metalloproteinase-9 expression in monocytic cells through ACSL1/JNK/ERK/NF-kB signaling pathways.Sci Rep. 2023 Sep 1;13(1):14351. doi: 10.1038/s41598-023-41514-6. Sci Rep. 2023. PMID: 37658104 Free PMC article.
-
Fish oil attenuates the expression of the CCL2 chemokine and histone-modifying enzymes in LPS-stimulated human preadipocytes.Metabol Open. 2024 Nov 30;24:100336. doi: 10.1016/j.metop.2024.100336. eCollection 2024 Dec. Metabol Open. 2024. PMID: 39717736 Free PMC article.
-
Involvement of CCL2 in Salivary Gland Response to Hyperosmolar Stress Related to Sjögren's Syndrome.Int J Mol Sci. 2024 Jan 11;25(2):915. doi: 10.3390/ijms25020915. Int J Mol Sci. 2024. PMID: 38255988 Free PMC article.
-
Endoplasmic Reticulum Stress Promotes the Expression of TNF-α in THP-1 Cells by Mechanisms Involving ROS/CHOP/HIF-1α and MAPK/NF-κB Pathways.Int J Mol Sci. 2023 Oct 14;24(20):15186. doi: 10.3390/ijms242015186. Int J Mol Sci. 2023. PMID: 37894865 Free PMC article.
References
-
- Kochumon S, Madhoun AA, Al-Rashed F, et al. Adipose tissue gene expression of CXCL10 and CXCL11 modulates inflammatory markers in obesity: implications for metabolic inflammation and insulin resistance. Ther Adv Endocrinol Metab. 2020;11:2042018820930902. doi:10.1177/2042018820930902 - DOI - PMC - PubMed
LinkOut - more resources
Full Text Sources
Research Materials
Miscellaneous
