. 2022 Jul 31;12(8):e9127.
doi: 10.1002/ece3.9127. eCollection 2022 Aug.

Performance of wild animals with "broken" traits: Movement patterns in nature of moose with leg injuries

Affiliations

Performance of wild animals with "broken" traits: Movement patterns in nature of moose with leg injuries

Andrew P Hendry et al. Ecol Evol. .

Abstract

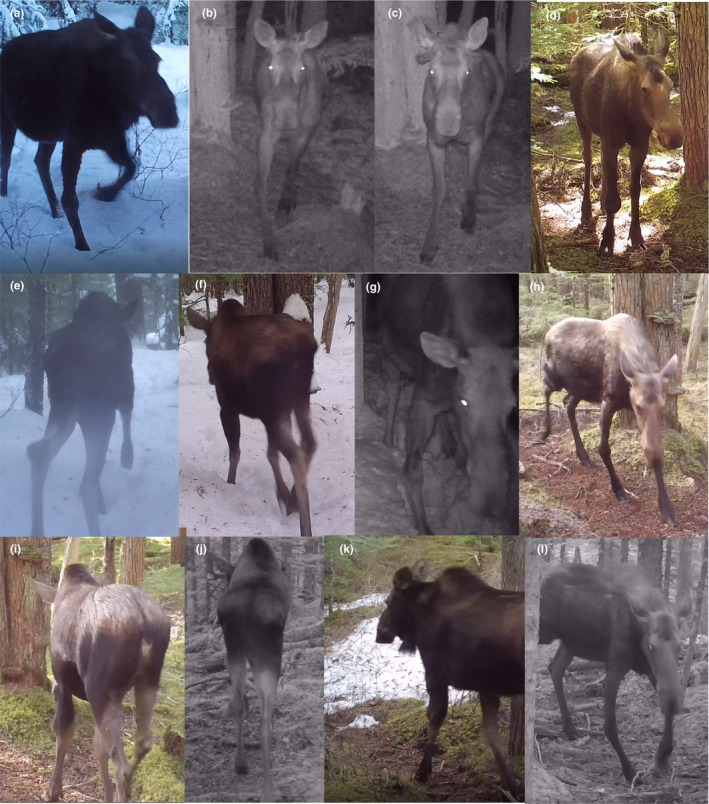
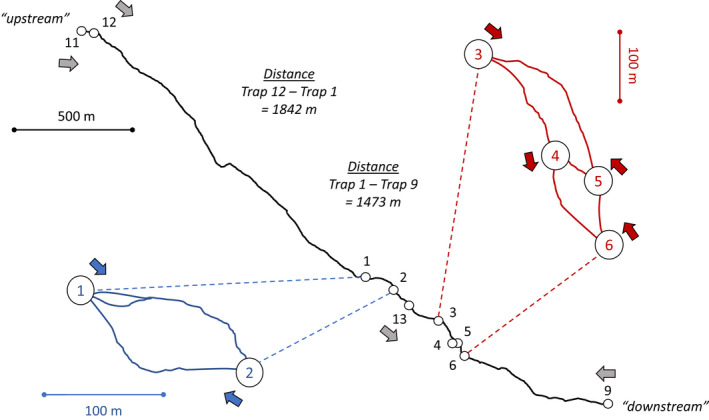
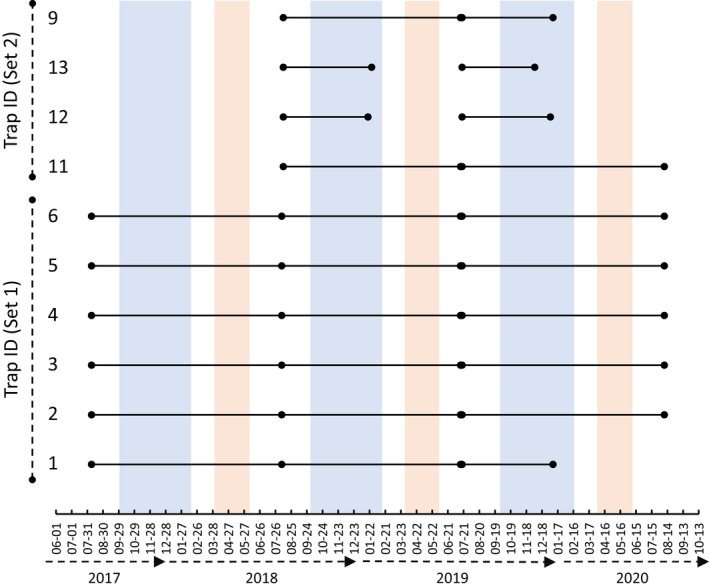
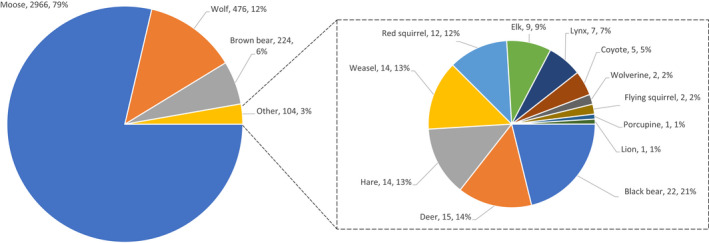
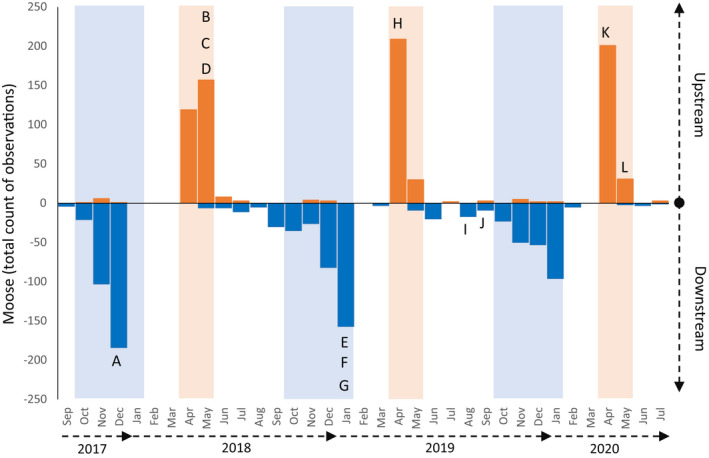
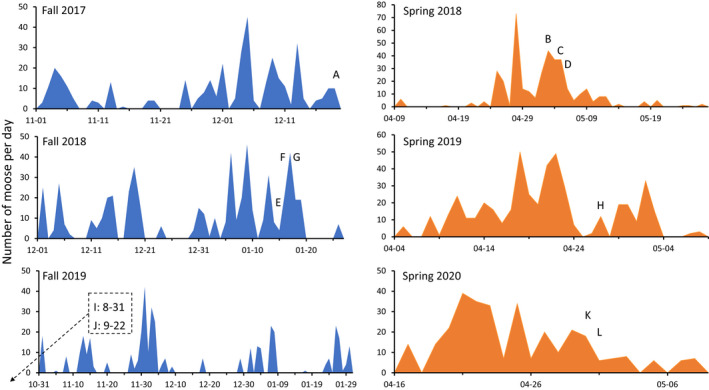
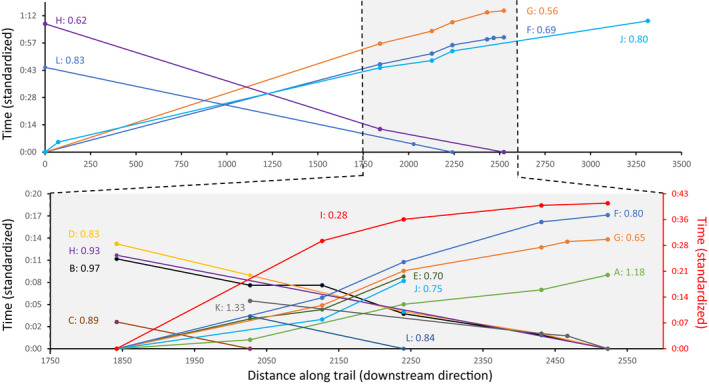
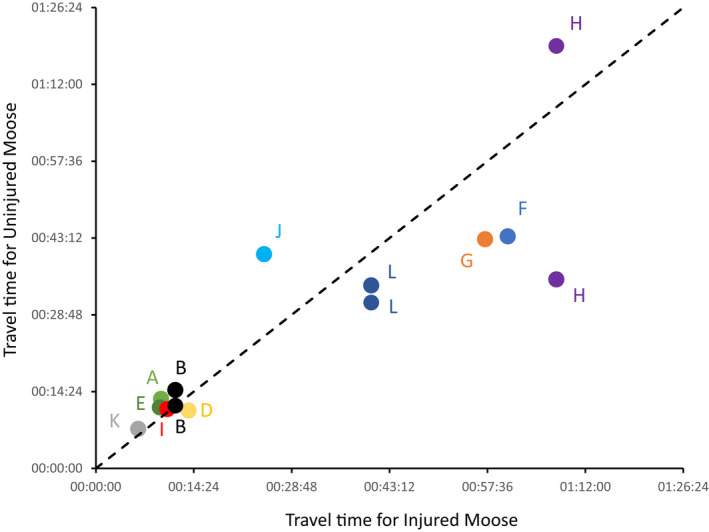
Organismal traits are presumed to be well suited for performance in the tasks required for survival, growth, and reproduction. Major injuries to such traits should therefore compromise performance and prevent success in the natural world; yet some injured animals can survive for long periods of time and contribute to future generations. We here examine 3 years of camera trap observations along a remote trail through old-growth forest in northern British Columbia, Canada. The most common observations were of moose (2966), wolves (476), and brown bears (224). The moose overwhelmingly moved in one direction along the trail in the late fall and early winter and in the other direction in the spring. This movement was clustered/contagious, with days on which many moose traveled often being interspersed with days on which few moose traveled. On the video recordings, we identified 12 injured moose, representing 1.4% of all moose observations. Seven injuries were to the carpus, three were to the antebrachium, and two were to the tarsus-and they are hypothesized to reflect damage to ligaments, tendons, and perhaps bones. The injured moose were limping in all cases, sometimes severely; and yet they did not differ noticeably from uninjured moose in the direction, date, contagiousness, or speed of movement along the trail. We discuss the potential relevance of these findings for the action of natural selection in the evolution of organismal traits important for performance.

Keywords: functional traits; game camera; lameness; natural selection; trailcam; ungulate.


Conflict of interest statement

The authors are all members of the same family—but did not receive any financial support from research grants, government agencies, NGOs, or businesses.

Figures

FIGURE 1
FIGURE 1
Cropped screen captures from camera trap videos of the 12 moose with injuries. Hypotheses about the nature of these injuries are listed in Table 1.
FIGURE 2
FIGURE 2
The course of the trail (solid lines) and the camera trap locations (open circles) as mapped by GPS—actual coordinates are not provided in order to protect sensitive wildlife. Numbers in the circles correspond to the camera trap numbers as reported in this paper. Colored (blue and red) insets show magnified portions of the trail with dense placement of camera traps. Filled arrows beside each camera trap number show the direction the camera is pointed. The two ends of the trail are referred to as “upstream” and “downstream” throughout the text, a reference to the river (not shown) that runs roughly parallel to the trail.
FIGURE 3
FIGURE 3
Dates of camera trap placement (earliest black dot for each camera) and servicing (subsequent black dots) for each of the two sets of camera traps. Camera traps 12 and 13 stopped recording before servicing each year, as indicated by black dots that are not immediately followed by a black line. Camera traps 1 and 9 stopped recording before servicing in the final year, as indicated in the same way. Blue and orange bars indicate periods designed in the text as the primary “fall” (October through January) and “spring” (April and May) movement periods of moose on the trail (as mirrored with similar bar colors in Figure 5).
FIGURE 4
FIGURE 4
Numbers and percentages of the total observations of non‐human animals on the trail. These totals are based on all camera traps across all 3 years.
FIGURE 5
FIGURE 5
Seasonal movement patterns of moose based on data from the camera traps that had complete recordings across all 3 years (i.e., traps 2–6). Moose were nearly always moving in the downstream direction (dark blue bars) in the fall period (light blue range) and in the upstream direction (dark orange bars) in the spring period (light orange range). Capital letters indicate the month of observation and the direction of movement of the 12 injured moose shown in Figure 1 and Table 1.
FIGURE 6
FIGURE 6
Daily movement of moose based on data from all camera traps. The x‐axis differs among plots according to the time range of movement. The data labels are every 10 days in all panels to enable quick comparison of the time intervals. Capital letters indicate the date of observation of the 12 injured moose shown in Figure 1 and Table 1. Note that injured moose I and J moved downstream earlier in fall 2019 than the period illustrated in the panel.
FIGURE 7
FIGURE 7
Cumulative time‐by‐location profiles for the 12 injured moose as indicated by capital letters that correspond to those shown in Figure 1. Time is standardized to zero at the first trap each moose was observed, with the traps ordered along the x‐axis according to their position along the trail. The cumulative time for each moose to pass each subsequent trap (on which it was observed) is then shown with the colored lines. Moose with lines rising from right to left were moving upstream on the trail, whereas moose with lines rising from left to right were moving downstream on the trail. The top panel shows the entire trail and the five moose that were observed at either the upstream end or the downstream end of the trail. The lower panel is an expanded version of the core center section of the trail where all 12 injured moose were observed. After the letters identifying each moose, we report the average rate of movement in m/s based on the two most distant traps each moose was observed in that panel. The scale in the lower panel is different for moose I—and is shown at right in red.
FIGURE 8
FIGURE 8
Comparison of rates of movement for 11 injured moose that could be paired with uninjured moose passing the same camera traps in the same direction within 4 days of each other. (The 12th injured moose could not be paired with an uninjured moose, and so is not shown here). For each injured‐uninjured pair of moose, the data show the transit time between the two most distant traps on which both moose of that pair were recorded. We were able to pair three of the injured moose (B, L, and H) with two uninjured moose each, one traveling before and the other after the injured moose ‐ both comparisons are shown for each of these "pairs." The dotted line is the 1:1 line of transit time for the injured and uninjured moose.

Similar articles

Cited by

References

    1. Abdelhakiem, M. A. H. , & Elrashidy, M. H. (2017). A retrospective study of the congenital anomalies of the axial and appendicular skeleton in cow calves. Assiut Veterinary Medical Journal, 63, 88–99.
    1. Ahloowalia, B. S. , & Maluszynsk, M. (2001). Induced mutations—A new paradigm in plant breeding. Euphytica, 118, 167–173.
    1. Arnold, S. J. (1983). Morphology, performance and fitness. American Zoologist, 23, 347–361.
    1. Bell, G. , & Gonzalez, A. (2009). Evolutionary rescue can prevent extinction following environmental change. Ecology Letters, 12, 942–948. - PubMed
    1. Bulstrode, C. , King, J. , & Roper, B. (1986). What happens to wild animals with broken bones. The Lancet, 327, 29–31. - PubMed

LinkOut - more resources