. 2022 Jul 18:12:923508.
doi: 10.3389/fonc.2022.923508. eCollection 2022.

Impairment of RAD17 Functions by miR-506-3p as a Novel Synthetic Lethal Approach Targeting DNA Repair Pathways in Ovarian Cancer

Affiliations

Impairment of RAD17 Functions by miR-506-3p as a Novel Synthetic Lethal Approach Targeting DNA Repair Pathways in Ovarian Cancer

Marina Bagnoli et al. Front Oncol. .

Abstract

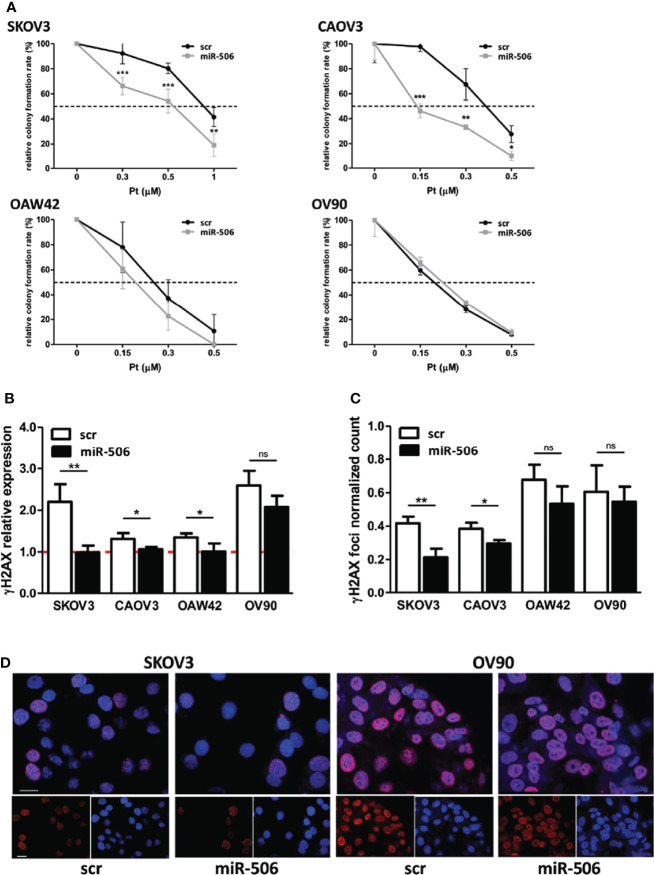
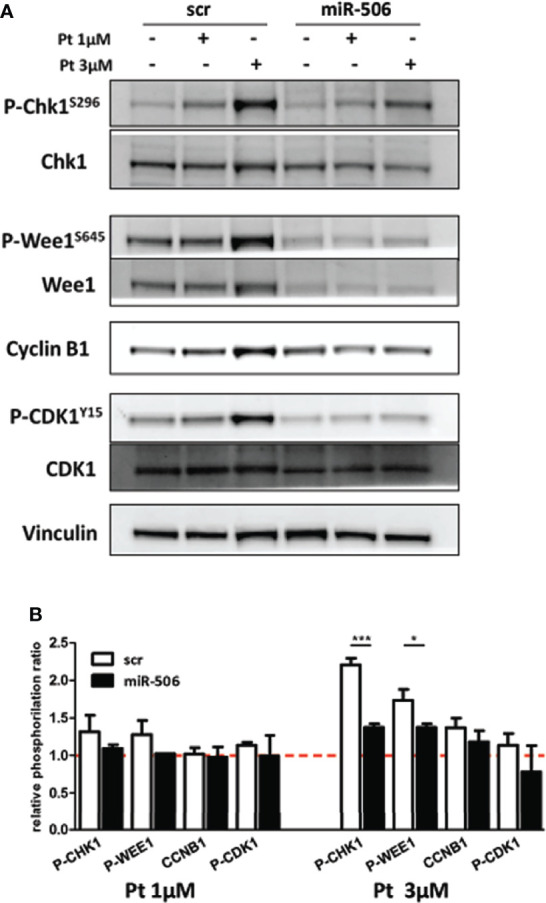
Epithelial ovarian cancer (EOC) remains the most lethal gynecological cancer and development of chemo-resistance is a major factor in disease relapse. Homologous recombination (HR) is a critical pathway for DNA double strand break repair and its deficiency is associated to a better response to DNA damage-inducing agents. Strategies to inhibit HR-mediated DNA repair is a clinical need to improve patients' outcome. MicroRNA (miRNAs) affect most of cellular processes including response to cancer treatment. We previously showed that miR-506-3p targets RAD51, an essential HR component. In this study we demonstrated that: i) another HR component, RAD17, is also a direct target of miR-506-3p and that it is involved in mediating miR-506-3p phenotypic effects; ii) the impairment of miR-506-3p binding to RAD17 3' UTR reverted the miR-506-3p induced platinum sensitization; iii) miR-506-3p/RAD17 axis reduces the ability of EOC cell to sense DNA damage, abrogates the G2/M cell cycle checkpoint thus delaying the G2/M cell cycle arrest likely allowing the entry into mitosis of heavily DNA-damaged cells with a consequent mitotic catastrophe; iv) RAD17 expression, regulated by miR-506-3p, is synthetically lethal with inhibitors of cell cycle checkpoint kinases Chk1 and Wee1 in platinum resistant cell line. Overall miR-506-3p expression may recapitulate a BRCAness phenotype sensitizing EOC cells to chemotherapy and helping in selecting patients susceptible to DNA damaging drugs in combination with new small molecules targeting DNA-damage repair pathway.

Keywords: ChrXq27.3 miRNA cluster; DNA damage and repair; RAD17; cell cycle checkpoint inhibitors; miR-506-3p; ovarian cancer.


Conflict of interest statement

The authors declare that the research was conducted in the absence of any commercial or financial relationships that could be construed as a potential conflict of interest.

Figures

Figure 1
Figure 1
Forced expression of miR-506-3p increased platinum sensitivity in EOC cell lines and impaired sensing of DNA damage. (A) Clonogenic assay on EOC cell lines transfected with scrambled (scr) control miR or miR-506-3p (miR-506) mimic and treated with platinum (Pt) at the indicated concentrations. Curves were generated from two to four independent experiments, each one performed in triplicates. Two way ANOVA and Bonferroni’s post test was used for statistical analysis (*p<0.05; **p<0.01; ***p<0.001). (B) Assessment of relative γH2AX expression in EOC cells transfected with miR-506-3p mimic (miR-506) or scrambled (scr) control miR and treated with 1μM (CAOV3,OAW42, OV90) or 3μM (SKOV3) Pt corresponding to the IC50 of each cell line as defined by TiterGlo/SRB assay. For Western Blot analysis, lysates were collected at 24 hours after Pt-treatment; vinculin was used as loading control. Bars represent the ratio of γH2AX expression (normalized on vinculin) between Pt-treated and untreated cells (dashed red line represents γH2AX expression in untreated cells). Student’s t-test was used to compare miR-506 versus scr treated cells (* p<0.05; ** p<0.01; ns = not significant). Quantification (C) and representative images (D) of γH2AX foci in miR-506-3p/scr transfected OC cell lines. (C) Cells were treated as indicated in B and IF-stained with γH2AX and DAPI (nuclei). The percentage of γH2Ax foci/DAPI positive of treated vs untreated cells is reported. Student’s t-test was used to compare miR-506-3p versus scr treated cells (*p<0.05; **p<0.01; ns = not significant). (D) Representative confocal IF images of fixed SKOV3 and OV90 cells treated as described in panel B and stained with anti-γH2AX (red); nuclei were stained with DAPI (blue). Bars, 25 μm.
Figure 2
Figure 2
RAD17 is a target of miR-506-3p and associates with worse prognosis in EOC patients. (A) List of algorithm challenged with MirWalk2.0, with the prediction of miR506-3p targeting on RAD17 3’UTR. 0 = absence 1 = presence of a seed region for miR-506-3p in the 3’UTR of RAD17. Lower panel: images from microRNA.org and TargetScan prediction tools showing the alignment of miR-506-3p within the predicted binding site in the RAD17 3’UTR. (B) Kaplan-Meier survival curves of EOC patients stratified according to RAD17 transcript expression. Data were extracted and analyzed with KM-plotter software (26). Progression free survival time was the clinical end-point analyzed. Data derived from 10 different publicly available datasets (GSE14764, GSE15622, GSE26193, GSE26712, GSE30161, GSE32062, GSE51373, GSE63885, GSE9891, TCGA) and selecting for patients treated with a Pt-based therapy. A total of 1291 patients were included in the analysis and stratified according to RAD17 (207405_s_at probe) quartile expression. (C, D). Four EOC cell lines (SKOV3, CAOV3, OAW42, and OV90) were transfected with miR-506-3p mimic (miR-506) or scrambled control miR (scr). RAD17 expression was analyzed by qRT-PCR (C) to check RAD17 mRNA and by Western blot (D) to check RAD17 protein expression levels. Bar charts represent the ratio of down-regulation of RAD17 mRNA (C) or protein (D) expression in miR-506-3p versus scr transfectants taken as reference of expression for each cell line. RNU48 and RNU44 were used for normalization in qRT-PCR assay. For western blot analysis loading control was β-actin for SKOV3, OAW42, OV90 cells and vinculin for CAOV3 cells. Student’s t-test was used to compare miR-506 versus scr cells (*p<0.5; **p<0.01;*** p<0.001; ns = not significant). (E) Dual-Luciferase Reporter assay confirming RAD17 as a direct target of miR-506-3p. HEK293T cells were transfected with pmiRGLO empty vector (pmiRGLO, white bar), or pmiRGLO containing the putative binding site of miR-506-3p in the RAD17 3’UTR in combination with a scrambled miRNA (scr) (pmiRGLO+miR-scr, black bar), miR-506-3p (pmiRGLO+miR-506-3p, gray bar) and an unrelated miRNA (pmiRGLO+miR-unrelated, dotted bar). Results are the ratio (Firefly/Renilla) of Relative Luminometer Units (RLU). Student’s t-test was used to compare t-miR506 versus t-scr or t-miR-unrelated cells (*** p<0.001).
Figure 3
Figure 3
RAD17 silencing increased sensitivity to Pt-treatment in EOC in-vitro model. (A) Relative expression of RAD17 and RAD51 proteins as defined by Western Blotting on the panel of cellular models used. Bars represent the ratio of RAD17/RAD51. (B) Clonogenic assays of CAOV3 (left panel) and SKOV3 (right panel) cell lines silenced with siRNA targeting RAD17 (siRAD17) or with a control siRNA (siCTRL) and treated with Pt at the indicated doses. Percentages of relative colony formation rate of siRAD17 versus siCTRL transfected cells are reported. Two way ANOVA and Bonferroni’s post test was used to compare groups (*** p<0.001). (C) Western blot analysis of γH2AX expression in SKOV3 cells silenced for RAD17 and treated with 1 and 3 µM Pt. Vinculin was used as loading control. Left panel: Bars represent the ratio of γH2AX expression (normalized on vinculin) between Pt-treated and untreated cells. Data are mean ± SD of at least three experiments. Student’s t test was used to compare siRAD17 cells versus sictrl transfected cells (*p<0.05); right panel: representative western blot. (D) Effects of RAD17 silencing on RAD17 and RAD51 mRNA (left panel) and protein (right panel) expression levels.
Figure 4
Figure 4
RAD17 regulation directly contributes to Pt-sensitivity mediated by miR-506-3p expression. (A) RAD17 quantification in t-miR506 and t-scr (control) SKOV3 cells co-transfected with RAD17 target protector (RAD17-TP). Two different concentration of RAD17-TP (40nM and 60nM) were tested. In the left panels is shown RAD17 mRNA relative expression normalized on housekeeping genes and standardized on scr SKOV3 cells, while in the right panel is shown RAD17 protein quantification normalized to vinculin and standardized on scr SKOV3 cells (Student’s t test; *p<0.5; ns = not significant). (B) Efficacy of miR-506-3p targeting on RAD17 and RAD51 expression in the presence of RAD17-TP. Bars represent relative mRNA expression normalized on housekeeping gene (left panel) and relative protein expression quantified by western blot assays, normalized to vinculin and standardized on scr SKOV3 cells(upper panel). Student’s t-test was used (*p<0.5; **p<0.01; *** p<0.001; ns = not significant); lower right panel: representative western blot. (C) Percentage of relative colony formation rate following Pt treatment. SKOV3 cells were transfected with miR-506-3p (black lines) or scrambled miR (green lines) alone (solid lines) or each co-transfected with two doses of RAD17-TP (40nM dashed lines, 60 nM dotted lines) and then left untreated or treated with Pt at the indicated doses. Data are mean ± SD of two independent experiments, 6 replicates each. Two way ANOVA and Bonferroni’s post test was used to compare t-miR-506-3p versus t-miR-506-3p + 40/60nM RAD17-TP SKOV3 cells (* p<0.05).
Figure 5
Figure 5
MiR-506-3p causes a delay in Pt-induced G2 cell cycle arrest and increases micronuclei formation. (A) Flow cytometry analysis of the cell cycle distribution (Propidium Iodide staining) in SKOV3 cells transfected with scrambled (scr) control miR or miR-506-3p mimic. Cells were left untreated or treated with 3μM Pt and cell cycle was analyzed at three time points (24, 48 72 hours). Upper Panel: Representative experiment; Lower Panel: Percentage of Pt-treated cells in different cell cycle phases at the indicated time points as assessed by ModFit Analysis Software. Mean of three independent experiments is reported. Representative images (B) and quantification (C) of micronuclei structures in SKOV3 cancer cells labeled with DAPI. SKOV3 cells were transfected with miR-506-3p mimic or scrambled (scr) control miR and treated for 48h with 3µM Pt and nocodazole (150ng/ml). Micronuclei are indicated by red arrows. Data represent the mean ± SD of six different fields corresponding to two independent experiments (Student’s t test; *** p<0.001).
Figure 6
Figure 6
Abrogation of G2/M cell cycle checkpoint in miR-506-3p reconstituted cells. Western blot analysis on total cell lysates from SKOV3 cells transfected with miR-506-3p or scrambled (scr) miRs and following treatment with 1 or 3µM Pt. Immunoblottings were performed with antibodies against the proteins indicated. Vinculin was used as loading control. Representative western blot images (A) and quantification (B) of relative phosphorylation levels calculated as the ratio between phosphorylated and total protein normalized on loading control. Bars in the graph represent the phosphorylation ratio between Pt-treated and untreated cells. Only significant comparison assessed by Student’s t test are reported (* p<0.05; *** p<0.001).
Figure 7
Figure 7
miR-506-3p dependent regulatory axis is synthetically lethal with cell-cycle checkpoint inhibitors. (A) Abrogation of G2/M cell cycle checkpoint activation in RAD17 silenced SKOV3 cells. Western blot analysis on total cell lysates from SKOV3 cells silenced for RAD17 (siRAD17) or with scrambled (sictrl) siRNA and treated or not with 1 and 3 µM Pt. Immunoblottings were performed with Abs against the proteins indicated. Vinculin was used as loading control. Representative western blot images (left panel) and quantification (right panel) of relative phosphorylation levels calculated as the ratio between phosphorylated and total protein normalized on loading control. Bars in the graph represent the phosphorylation ratio between Pt-treated and untreated cells. Comparison assessed by Student’s t test (* p<0.05; ** p<0.01). (B) Forced expression of miR-506-3p or RAD17 silencing induces sensitivity to Chk1 and Wee1 inhibitors in SKOV3 cells. SKOV3 cells were transfected with miR-506-3p mimic or control scrambled miR (miR-506 and scr, left panels), or silenced with siRNA against RAD17 or with a control siRNA (siRAD17 and sictrl, right panels) and tested by clonogenic assays for sensitivity to Chk1 inhibitor (LY603618) or Wee1 inhibitors (MK1775) at the indicated doses. (C) Wee1 or Chk1 inhibition in miR-506-3p reconstituted cells enhanced effect of Pt treatment. Both scr (black lines) and miR-506 (blue lines) SKOV3 cells were treated with Pt at the indicated doses, alone (solid line) or in combination with 100 nM Chk1 inhibitor (Chk1i; LY2603618, dotted lines, upper panel) or 50 nM Wee1 inhibitor (Wee1i; MK1775, dotted lines, lower panel). For each panel, percentages of relative colony formation rate are reported. To compare miR-506 or siRAD17 cells versus their relative control cells (panel B) or to compare miR-506 cells treated with Pt alone versus combinations with cell cycle checkpoint inhibitors (panel C), two way ANOVA and Bonferroni’s post test was used (*p<0.05; ** p<0.01;***p<0.001).

Similar articles

Cited by

References

    1. Jackson SP, Bartek J. The DNA-Damage Response in Human Biology and Disease. Nature (2009) 461:1071–8. doi: 10.1038/nature08467 - DOI - PMC - PubMed
    1. Roos WP, Thomas AD, Kaina B. DNA Damage and the Balance Between Survival and Death in Cancer Biology. Nat Rev Cancer (2016) 16:20–33. doi: 10.1038/nrc.2015.2 - DOI - PubMed
    1. Matthews HK, Bertoli C, de Bruin RAM. Cell Cycle Control in Cancer. Nat Rev Mol Cell Biol (2022) 23:74–88. doi: 10.1038/s41580-021-00404-3 - DOI - PubMed
    1. Hanahan D. Hallmarks of Cancer: New Dimensions. Cancer Discovery (2022) 12:31–46. doi: 10.1158/2159-8290.CD-21-1059 - DOI - PubMed
    1. Hanahan D, Weinberg RA. Hallmarks of Cancer: The Next Generation. Cell (2011) 144:646–74. doi: 10.1016/j.cell.2011.02.013 - DOI - PubMed