

Metabolite profile of COVID-19 revealed by UPLC-MS/MS-based widely targeted metabolomics
- PMID: 35924246
- PMCID: PMC9339702
- DOI: 10.3389/fimmu.2022.894170
Metabolite profile of COVID-19 revealed by UPLC-MS/MS-based widely targeted metabolomics
Abstract
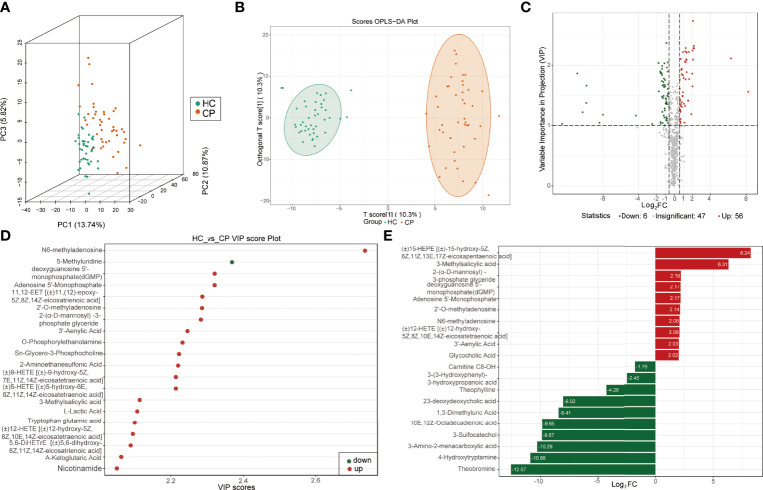
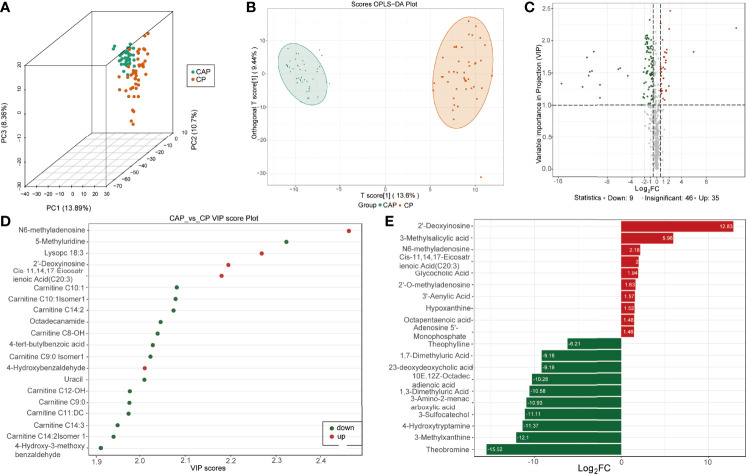
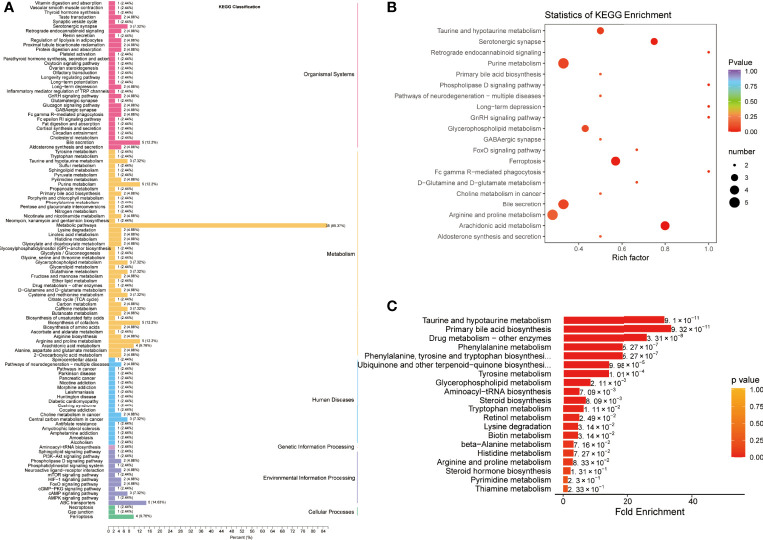
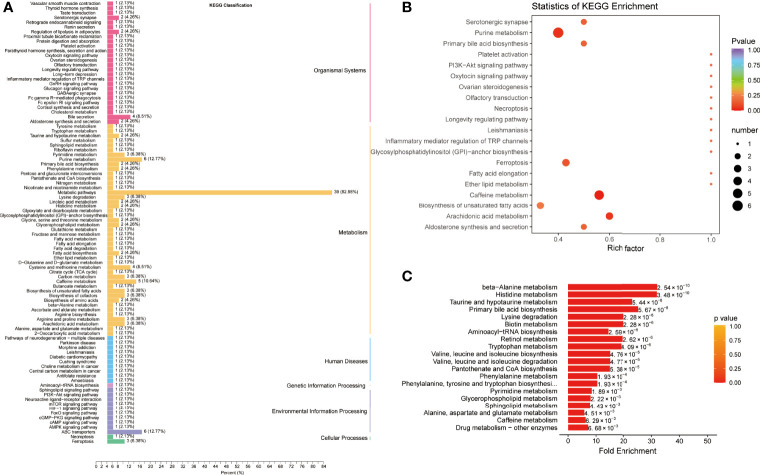
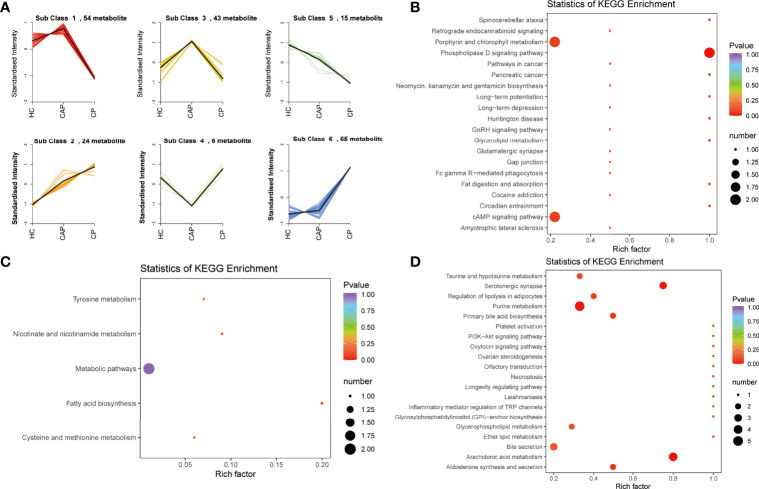
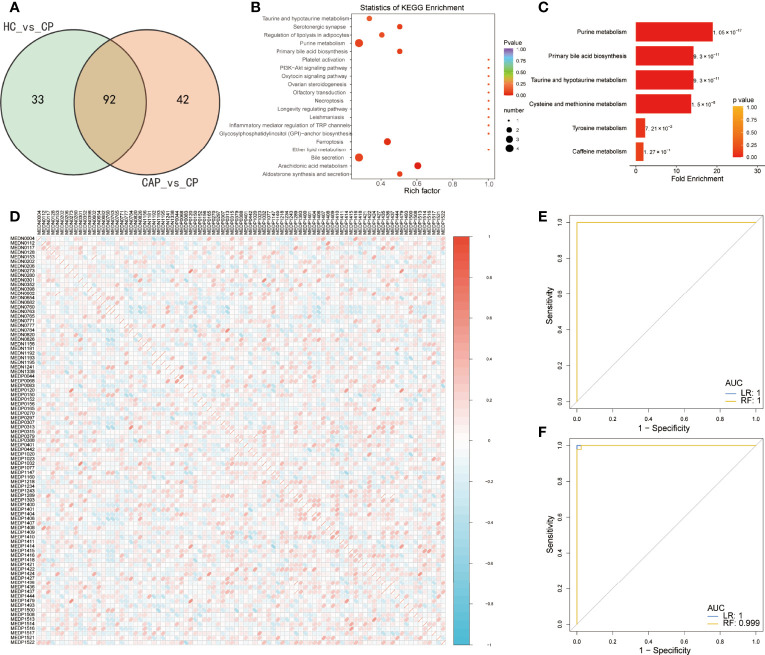
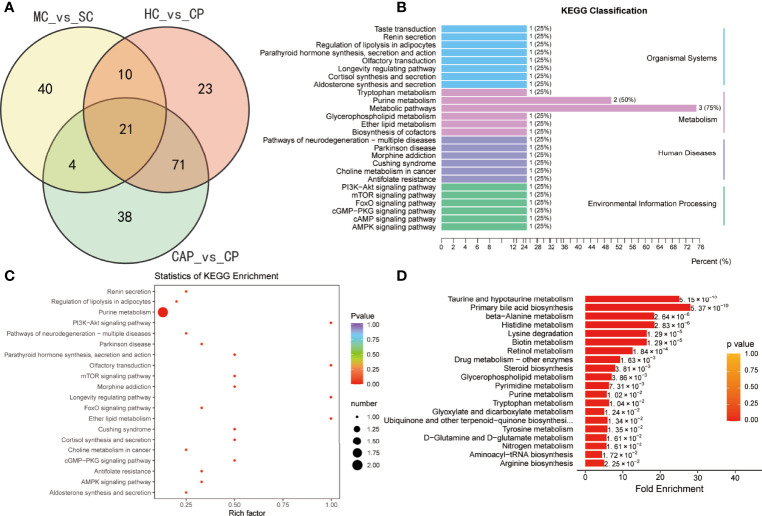
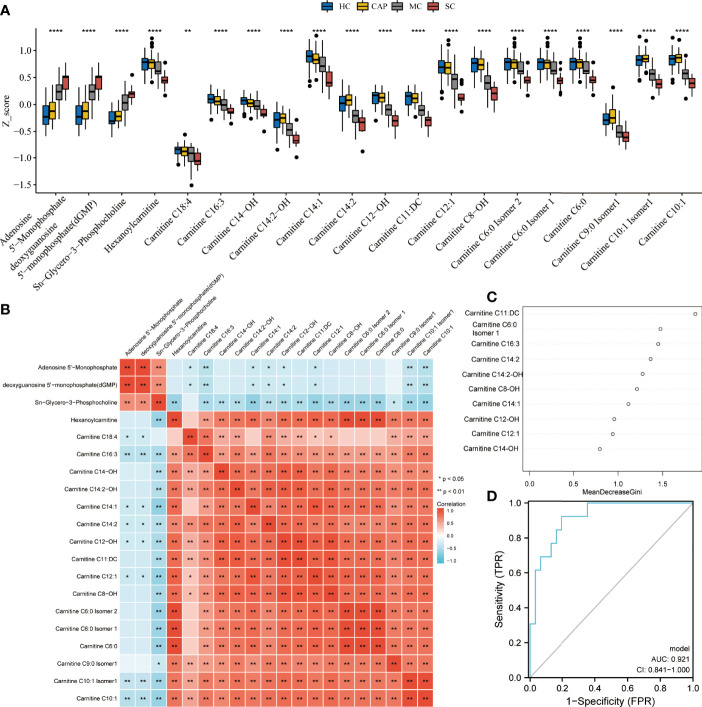
The metabolic characteristics of COVID-19 disease are still largely unknown. Here, 44 patients with COVID-19 (31 mild COVID-19 patients and 13 severe COVID-19 patients), 42 healthy controls (HC), and 42 patients with community-acquired pneumonia (CAP), were involved in the study to assess their serum metabolomic profiles. We used widely targeted metabolomics based on an ultra-performance liquid chromatography-tandem mass spectrometry (UPLC-MS/MS). The differentially expressed metabolites in the plasma of mild and severe COVID-19 patients, CAP patients, and HC subjects were screened, and the main metabolic pathways involved were analyzed. Multiple mature machine learning algorithms confirmed that the metabolites performed excellently in discriminating COVID-19 groups from CAP and HC subjects, with an area under the curve (AUC) of 1. The specific dysregulation of AMP, dGMP, sn-glycero-3-phosphocholine, and carnitine was observed in the severe COVID-19 group. Moreover, random forest analysis suggested that these metabolites could discriminate between severe COVID-19 patients and mild COVID-19 patients, with an AUC of 0.921. This study may broaden our understanding of pathophysiological mechanisms of COVID-19 and may offer an experimental basis for developing novel treatment strategies against it.
Keywords: COVID-19; UPLC-MS/MS; machine learning; potential biomarkers; widely targeted metabolites.
Copyright © 2022 Liu, Li, Lu, Yu, Zhang, Ke, Zhang and Li.
Conflict of interest statement
The authors declare that the research was conducted in the absence of any commercial or financial relationships that could be construed as a potential conflict of interest.
Figures
Similar articles
-
Metabolic profiles in community-acquired pneumonia: developing assessment tools for disease severity.Crit Care. 2018 May 14;22(1):130. doi: 10.1186/s13054-018-2049-2. Crit Care. 2018. PMID: 29759075 Free PMC article. Clinical Trial.
-
Serum metabolomics profile identifies patients with community-acquired pneumonia infected by bacteria, fungi, and viruses.Ann Med. 2024 Dec;56(1):2399320. doi: 10.1080/07853890.2024.2399320. Epub 2024 Sep 16. Ann Med. 2024. PMID: 39283042 Free PMC article.
-
Plasma characteristic metabolites of pediatric community-acquired pneumonia in traditional Chinese medicine syndrome differentiation.Anat Rec (Hoboken). 2021 Nov;304(11):2579-2591. doi: 10.1002/ar.24767. Epub 2021 Sep 22. Anat Rec (Hoboken). 2021. PMID: 34549900
-
Challenges and emergent solutions for LC-MS/MS based untargeted metabolomics in diseases.Mass Spectrom Rev. 2018 Nov;37(6):772-792. doi: 10.1002/mas.21562. Epub 2018 Feb 27. Mass Spectrom Rev. 2018. PMID: 29486047 Review.
-
Mass spectrometric based approaches in urine metabolomics and biomarker discovery.Mass Spectrom Rev. 2017 Mar;36(2):115-134. doi: 10.1002/mas.21455. Epub 2015 Apr 16. Mass Spectrom Rev. 2017. PMID: 25881008 Review.
Cited by
-
Common molecular signatures between coronavirus infection and Alzheimer's disease reveal targets for drug development.bioRxiv [Preprint]. 2023 Jun 15:2023.06.14.544970. doi: 10.1101/2023.06.14.544970. bioRxiv. 2023. Update in: J Alzheimers Dis. 2023;95(3):995-1011. doi: 10.3233/JAD-230684. PMID: 37398415 Free PMC article. Updated. Preprint.
-
Systematic Mendelian randomization study of the effect of gut microbiome and plasma metabolome on severe COVID-19.Front Immunol. 2023 Aug 16;14:1211612. doi: 10.3389/fimmu.2023.1211612. eCollection 2023. Front Immunol. 2023. PMID: 37662924 Free PMC article.
-
Metabolic profiling during COVID-19 infection in humans: Identification of potential biomarkers for occurrence, severity and outcomes using machine learning.PLoS One. 2024 May 30;19(5):e0302977. doi: 10.1371/journal.pone.0302977. eCollection 2024. PLoS One. 2024. PMID: 38814977 Free PMC article.
-
Nucleotide, Phospholipid, and Kynurenine Metabolites Are Robustly Associated with COVID-19 Severity and Time of Plasma Sample Collection in a Prospective Cohort Study.Int J Mol Sci. 2023 Dec 26;25(1):346. doi: 10.3390/ijms25010346. Int J Mol Sci. 2023. PMID: 38203516 Free PMC article.
-
Crosstalk between COVID-19 Infection and Kidney Diseases: A Review on the Metabolomic Approaches.Vaccines (Basel). 2023 Feb 20;11(2):489. doi: 10.3390/vaccines11020489. Vaccines (Basel). 2023. PMID: 36851366 Free PMC article. Review.
References
MeSH terms
LinkOut - more resources
Full Text Sources
Medical
Miscellaneous