. 2022 Jul 26:17:3217-3237.
doi: 10.2147/IJN.S364264. eCollection 2022.

Dual-Target Multifunctional Superparamagnetic Cationic Nanoliposomes for Multimodal Imaging-Guided Synergistic Photothermal/Photodynamic Therapy of Retinoblastoma

Affiliations

Dual-Target Multifunctional Superparamagnetic Cationic Nanoliposomes for Multimodal Imaging-Guided Synergistic Photothermal/Photodynamic Therapy of Retinoblastoma

Wendi Zheng et al. Int J Nanomedicine. .

Abstract

Background: With high malignancy, retinoblastoma (RB) commonly occurs in infants and has incredible difficulty with the early diagnosis. In recent years, the integrated theranostics of multimodal imaging-guided therapy has shown promising potential for oncotherapy.

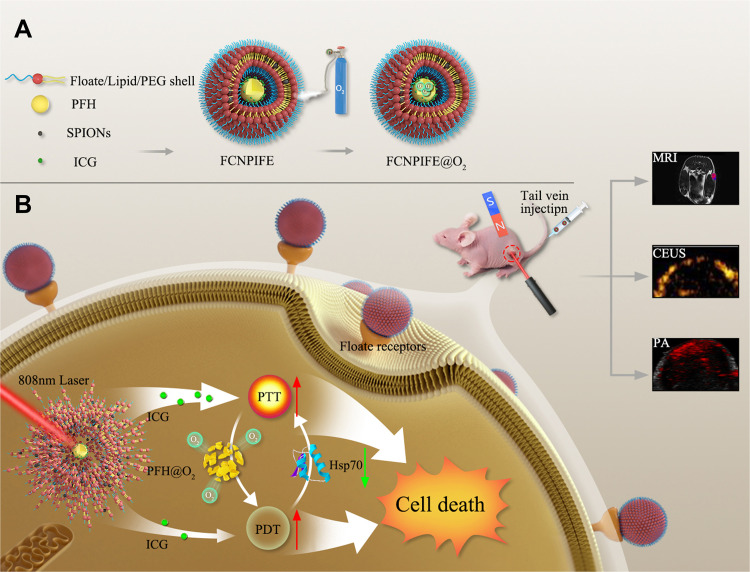
Purpose: To prepare folate/magnetic dual-target theranostic nanoparticles integrating with US/PA/MR imaging and the synergistic photothermal treatment (PTT)/photodynamic treatment (PDT) for the early diagnosis and timely intervention of RB cancer.

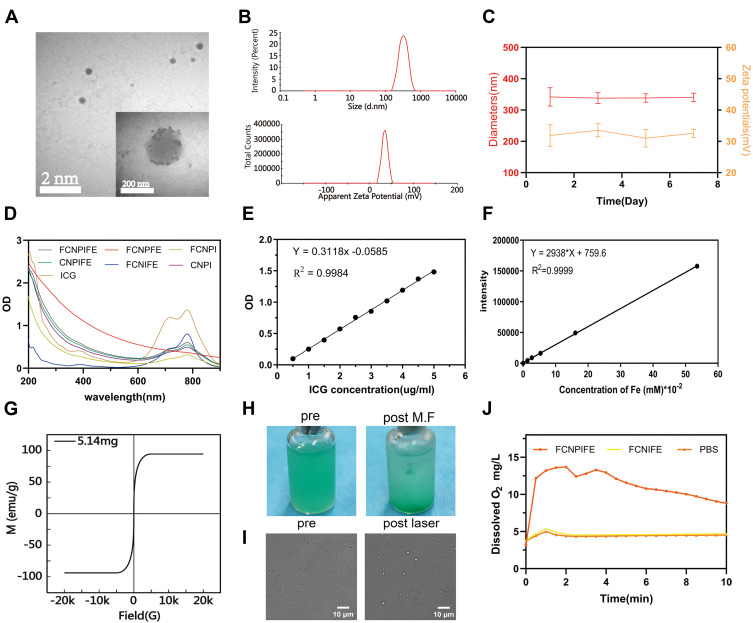
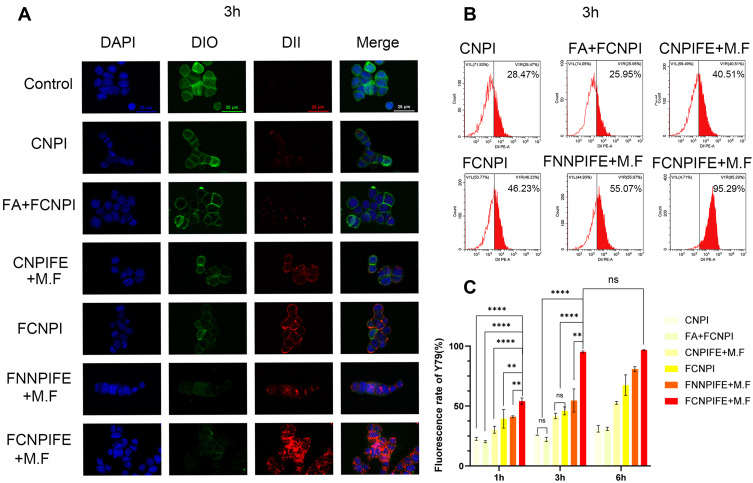
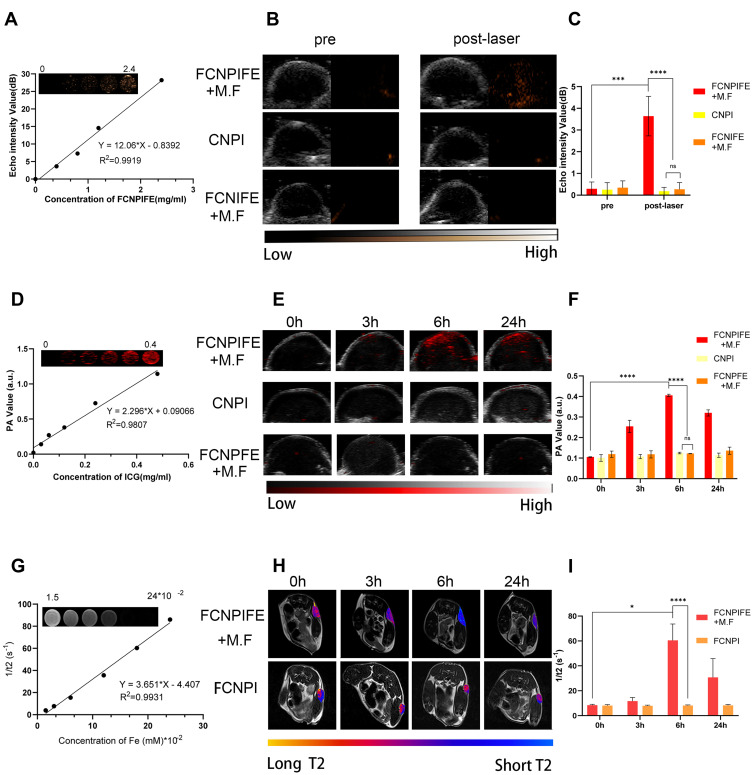
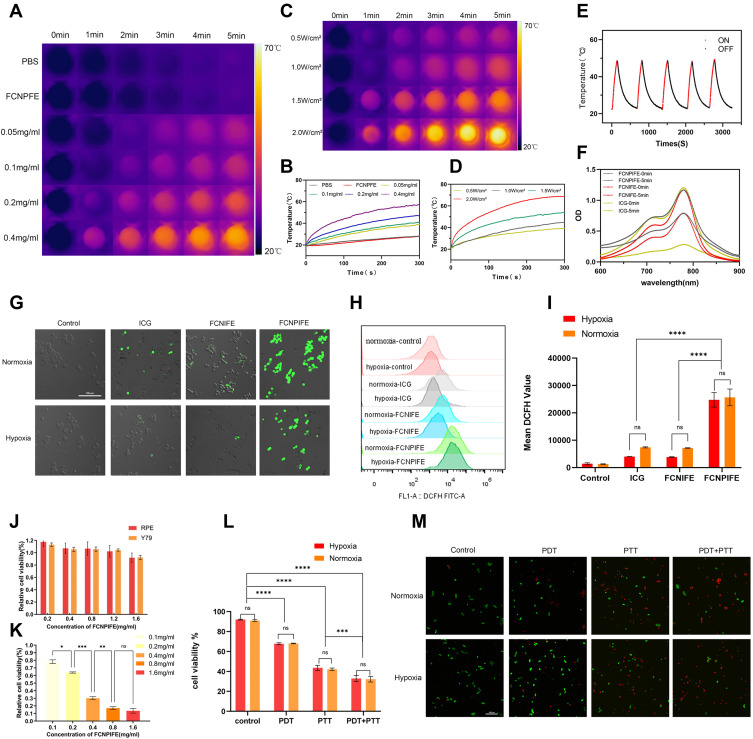
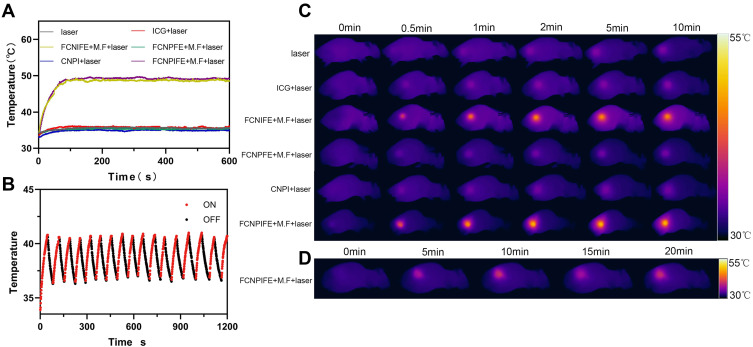
Methods: Folate/magnetic dual-target cationic nanoliposomes (CN) encapsulating indocyanine green (ICG) and perfluorohexane(PFH)(FA-CN-PFH-ICG-Fe3O4, FCNPIFE) were synthesized and characterized. Then we evaluated their targeting ability, US/PA/MR imaging effects, and the efficacy of synergistic PTT/PDT in vitro and in vivo. Finally, we explored the mechanism of synergistic PTT/PDT in Y79 tumor-bearing mice.

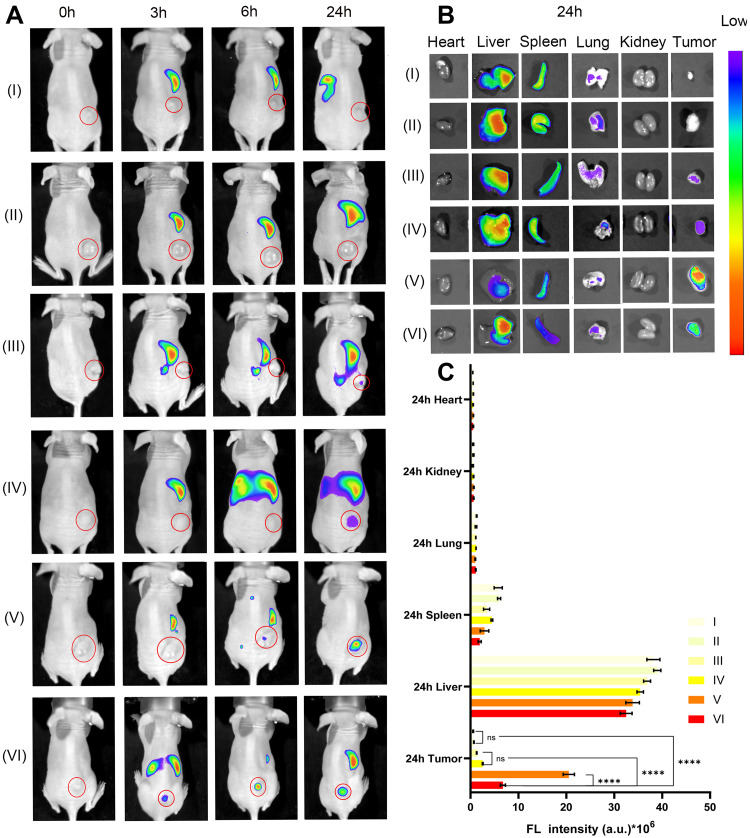
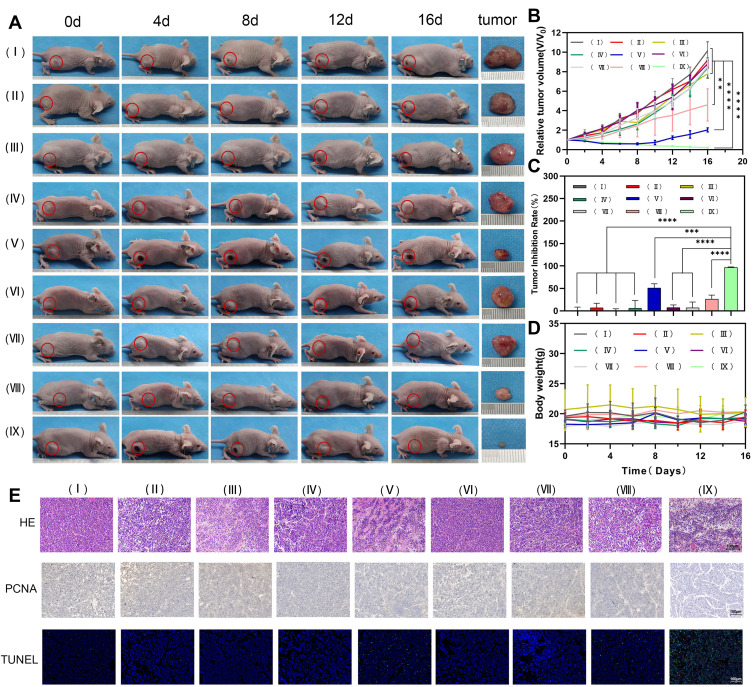
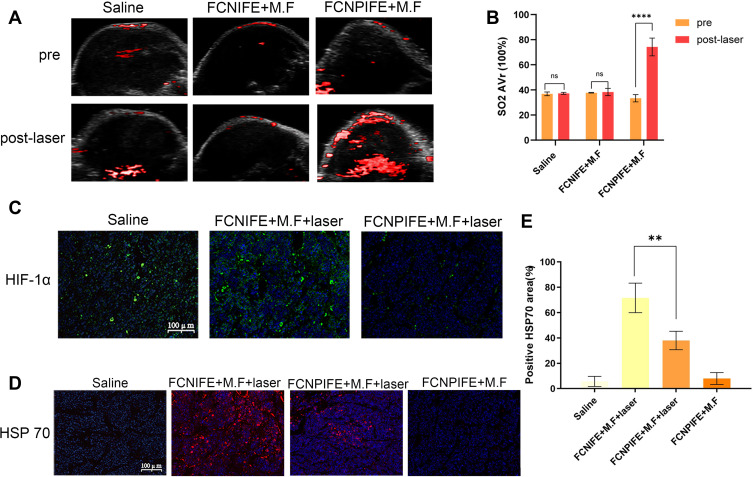
Results: FCNPIFEs were stable and uniform in 7 days. They showed excellent in vitro targeting ability with a 95.29% cell uptake rate. The in vitro US/PA/MRI imaging results of FCNPIFEs showed a concentration-dependent manner, and in vitro therapy FCNPIFEs exhibited an enhanced anticancer efficacy against Y79 cells. In vivo analysis confirmed that FCNPIFEs enabled a targeted synergistic PTT/PDT under US/PA/MR imaging guidance in Y79 tumor-bearing mice, achieving almost complete tumor regression. Immunofluorescence results displayed weaker fluorescence intensity compared with other single treatment groups, confirming that PTT/PDT synergistic therapy effect was achieved by down-regulating the expression of HIF-1α and HSP70.

Conclusion: FCNPIFEs were verified as promising theranostic nanoliposomes for RB oncotherapy and showed great potential in clinical application.

Keywords: nanomedicine; phototherapy; retinoblastoma; theranostic.


Conflict of interest statement

The authors report no conflicts of interest in this work.

Figures

Scheme 1
Scheme 1
Schematic illustration of (A) the synthesis of FCNPIFEs; (B) the synergistic photothermal/photodynamic therapy of retinoblastoma under the US/PA/MR imaging-guide.
Figure 1
Figure 1
Characterization of FCNPIFE. (A) Low and high magnification TEM images of FCNPIFE (scale bar: 200 nm and 2 μm). (B) Representative diameters and zeta potentials of FCNPIFE. (C) The stability of FCNPIFE based on average diameters and zeta potentials. (D) UV–vis–NIR spectra of FCNPIFE, FCNPFE, FCNPI, CNPIFE, FCNIFE, CNPI and ICG. (E) The optical density of ICG (0.025, 0.05, 0.1, 0.2 and 0.4 mg/mL) in UV spectrophotometry. (F) The emission intensity of Fe (0.015, 0.03, 0.06, 0.12, 0.18 and 0.24 mM) in ICP-OES. (G) The magnetization curve of FCNPIFEs. (H) The aggregation effect of FCNPIFEs in the glass bottle before and 6h post-application of M.F. (I) CLSM images (scale bar: 10 μm) of the FCNPIFE phase transition before and 5min post-laser. (J) O2 concentration changes among the FCNPIFE, FCNIFE and PBS under air-tight conditions.
Figure 2
Figure 2
Intracellular uptake of FCNPIFE. (A) CLSM images (scale bar: 25 μm) of intracellular in different groups at 3 h. (B) Representative flow cytometric results of intracellular uptake in different groups at 3 h. (C) The quantitative flow cytometry analysis of intracellular uptake in different groups at 1 h,3 h and 6 h (n=3, **p < 0.01, ****p < 0.0001).
Figure 3
Figure 3
Fluorescence imaging and biodistribution of FCNPIFE. (A) FL images of Y79 tumor-bearing mice at 3 h,6 h and 24 h after injections of corresponding nanoparticles. Group (I): CNPI, group (II): CNPIFE, group (III): CNPIFE +M. F, group (IV): FCNPI, group(V): FNNPIFE+M.F, group (VI): FCNPIFE+M. F. (B) Biodistribution of different DiR-labeled nanoparticles in major organs and tumors at 24 h post-injection. (C) Quantitative fluorescence intensity in tumors and major organs at 24 h after injections of corresponding nanoparticles. (n=3, ****p < 0.0001).
Figure 4
Figure 4
USI, PAI and MRI in vitro and in vivo experiments. (A) In vitro US images and echo intensity value of FCNPIFE. (B) US images of tumors in Y79 tumor-bearing mice with injections of FCNPIFE, FCNIFE, and CNPI before /after 808nm laser irradiation. (C) Corresponding echo intensities within tumor regions before/after 808nm laser irradiation (n=3, **p < 0.01, ***p < 0.001). (D) In vitro PA images and PA value of FCNPIFE. (E) PA images of tumors in Y79 tumor-bearing mice after injections of FCNPIFE, CNPI and FCNPFE at different time points. (F) Corresponding PA intensities within tumor regions at different time points (n=3, ****p < 0.0001). (G) In vitro MRI and the transverse relaxivity (r2) of FCNPIFE. (H) T2 images of tumors in Y79 tumor-bearing mice after injections of FCNPIFE, FCNPI at different time points. (I) Corresponding signal intensities within tumor regions at different time points (n=3, *p < 0.05, ****p < 0.0001).
Figure 5
Figure 5
In vitro PTT, PDT performance and cytotoxicity of FCNPIFE. (A) Thermal images of PBS, FCNPFE and different concentrations of FCNPIFE under 808nm laser (1.5 W/cm2, 5 min). (B) Photothermal heating curves of PBS, FCNPFE and different concentrations of FCNPIFE under 808 nm laser (1.5 W/cm2, 5 min). (C) Thermal images of FCNPIFE (0.4 mg/mL) under different power of 808nm laser for 5 min. (D) Photothermal heating curves of FCNPIFE (0.4 mg/mL) under different power of 808nm laser for 5 min. (E) Photothermal stability of FCNPIFE under repeated five cycles of 808nm laser (1.5 W/cm2; on 30s, off 30s). (F) UV–vis–NIR spectra changes of FCNPIFE, FCNIFE and ICG before/after 5 min of irradiation (1.5 W/cm2). (G) CLSM images (scale bar: 100 μm) of intracellular ROS generated from ICG, FCNIFE and FCNPIFE under normoxic and hypoxic conditions. (H) The representative flow cytometry analysis of intracellular ROS generated from ICG, FCNIFE and FCNPIFE under normoxic and hypoxic conditions. (I) Quantitative flow cytometry analysis of ROS generated from ICG, FCNIFE and FCNPIFE in Y79 cells under normoxic and hypoxic conditions (n=3, ****p < 0.0001). (J) Cell viability of Y79 cells and ARPE-19 cells after incubated with different concentrations of FCNPIFE. (K) Cell viability of Y79 cells incubated with different concentrations of FCNPIFE after 5 min irradiation (n=3, *p < 0.05, **p < 0.01, ***p < 0.001). (I) Quantitative flow cytometry analysis of Y79 cells after PDT, PTT, and PTT+PDT under normoxic and hypoxic conditions (n=3, ***p < 0.001, ****p < 0.0001). (M) The Calcein-AM/PI staining images of Y79 cells after PDT, PTT, and PTT+PDT under normoxic and hypoxic conditions (scale bar: 100 μm).
Figure 6
Figure 6
In vivo photothermal effects of different groups. (A) Photothermal heating curves of Y79 tumor-bearing mice in different groups irradiated by continuous laser (1 0.5W/cm2, 10 min). (B) Photothermal heating curves of Y79 tumor-bearing mice treated with FCNPIFE+M.F+intermittent laser (1 0.5W/cm2, on 30s/off 30s, 20 min). (C) Thermal images of Y79 tumor-bearing mice in different groups irradiated by continuous laser (1 0.5W/cm2, 10 min). (D) Thermal images of Y79 tumor-bearing mice treated with FCNPIFE+M.F+intermittent laser (1 0.5W/cm2, on 30s/off 30s, 20 min).
Figure 7
Figure 7
In vivo therapeutic effects of different groups. (A) Representative digital images of tumor-bearing mice in different groups. group(I):saline, group(II):laser, group(III):FCNPIFE+M.F, group(IV):ICG+laser, group(V):FCNIFE+M.F+laser, group(VI): FCNPFE+M.F+laser, group(VII):CNPI+laser, group(VIII):FCNPIFE+M.F+intermittent laser, group(IX): FCNPIFE+M.F+laser. (B) Time-dependent relative tumor volume(V/V0) curves of mice in the different groups (n =3, **p < 0.01, ****p < 0.0001). (C) Tumor inhibition rates of nine groups after receiving different treatments. (n =3, ****p < 0.0001). (D) Body weight curves of Y79 tumor-bearing mice for each group during the 16d period. (E) HE, TUNEL, and PCNA staining results of different groups on the 3st day post treatments (scale bar:100μm).
Figure 8
Figure 8
The mechanism behind synergistic therapeutic efficacy of FCNPIFE. (A) PA images of different groups in oxy-hemoglobin mode before/post-irradiation (1.5W/cm2,10 min). (B) Quantification of oxyhemoglobin saturation in tumor regions of different groups (n =3, ****p < 0.0001). (C) HIF-1α immunofluorescent staining of tumors collected from different groups on the 1st day post-treatments. (D) HSP70 immunofluorescent staining of tumors collected from different groups on the 1st day post-treatments. (E) Quantitative analysis of HSP70 expression of different groups on the 1st day post-treatment (n =3, **p < 0.01).
Figure 9
Figure 9
In vivo biosafety of FCNPIFE. (A) HE staining of major organs on the 3rd day after mice received different treatments. (Scale bar: 100μm). (B) Blood biochemical examination of mice at 0, 1, 7 and 14d after injection of FCNPIFEs.

Similar articles

Cited by

References

    1. Skalet AH, Gombos DS, Gallie BL, et al. Screening children at risk for retinoblastoma. Ophthalmology. 2018;125(3):453–458. doi:10.1016/j.ophtha.2017.09.001 - DOI - PubMed
    1. Moeez Uddin M, Farooque U, Aziz MZ, et al. Different types of clinical presentations and stages of retinoblastoma among children. Cureus. 2020. doi:10.7759/cureus.10672 - DOI - PMC - PubMed
    1. Ancona-Lezama D, Dalvin L, Shields C. Modern treatment of retinoblastoma: a 2020 review. Indian J Ophthalmol. 2020;68(11):2356. doi:10.4103/ijo.IJO_721_20 - DOI - PMC - PubMed
    1. Castela G, Providência J, Monteiro M, et al. Treatment of advanced retinoblastoma in children evacuated from low-income countries: experience from a national referral center in Portugal. OPTH. 2021;15:4765–4773. doi:10.2147/OPTH.S343919 - DOI - PMC - PubMed
    1. Rössler J, Dietrich T, Pavlakovic H, et al. Higher vessel densities in retinoblastoma with local invasive growth and metastasis. Am J Pathol. 2004;164(2):391–394. doi:10.1016/S0002-9440(10) - DOI - PMC - PubMed