

An affinity threshold for maximum efficacy in anti-PD-1 immunotherapy
- PMID: 35924382
- PMCID: PMC9354768
- DOI: 10.1080/19420862.2022.2088454
An affinity threshold for maximum efficacy in anti-PD-1 immunotherapy
Erratum in
-
Correction.MAbs. 2024 Jan-Dec;16(1):2364972. doi: 10.1080/19420862.2024.2364972. Epub 2024 Jun 7. MAbs. 2024. PMID: 38850010 Free PMC article. No abstract available.
Abstract
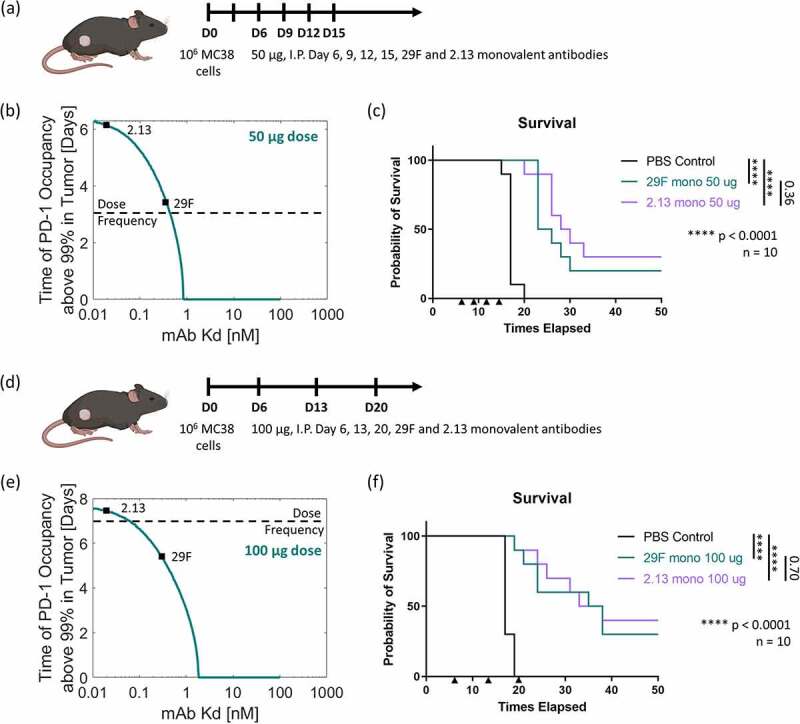
Monoclonal antibodies targeting the programmed cell death protein 1 (PD-1) remain the most prevalent cancer immunotherapy both as a monotherapy and in combination with additional therapies. Despite the extensive success of anti-PD-1 monoclonal antibodies in the clinic, the experimental relationship between binding affinity and functional potency for anti-PD-1 antibodies in vivo has not been reported. Anti-PD-1 antibodies with higher and lower affinity than nivolumab or pembrolizumab are entering the clinic and show varied preclinical efficacy. Here, we explore the role of broad-ranging affinity variation within a single lineage in a syngeneic immunocompetent mouse model. By developing a panel of murine anti-PD-1 antibodies with varying affinity (ranging from KD = 20 pM - 15 nM), we find that there is a threshold affinity required for maximum efficacy at a given dose in the treatment of the MC38 adenocarcinoma model with anti-PD-1 immunotherapy. Physiologically based pharmacokinetic modeling complements interpretation of the experimental results and highlights the direct relationship between dose, affinity, and PD-1 target saturation in the tumor.
Keywords: PD-1; affinity; antibody; cancer immunotherapy; pharmacokinetic modeling.
Conflict of interest statement
GJF has patents/pending royalties on the PD-1/PD-L1 pathway from Roche, Merck MSD, Bristol-Myers-Squibb, Merck KGA, Boehringer-Ingelheim, AstraZeneca, Dako, Leica, Mayo Clinic, and Novartis. GJF has a patent on RGMb in cancer immunotherapy. GJF has served on advisory boards for Roche, Bristol-Myers-Squibb, Xios, Origimed, Triursus, iTeos, NextPoint, IgM, Jubilant, Trillium, GV20, IOME, and Geode. GJF has equity in Nextpoint, Triursus, Xios, iTeos, IgM, Trillium, Invaria, GV20, and Geode.
Figures
Similar articles
-
Successful Immunotherapy against a Transplantable Mouse Squamous Lung Carcinoma with Anti-PD-1 and Anti-CD137 Monoclonal Antibodies.J Thorac Oncol. 2016 Apr;11(4):524-36. doi: 10.1016/j.jtho.2016.01.013. Epub 2016 Feb 1. J Thorac Oncol. 2016. PMID: 26845193
-
Characterization of ASP8374, a fully-human, antagonistic anti-TIGIT monoclonal antibody.Cancer Treat Res Commun. 2021;28:100433. doi: 10.1016/j.ctarc.2021.100433. Epub 2021 Jul 11. Cancer Treat Res Commun. 2021. PMID: 34273876
-
Preclinical Development of Ipilimumab and Nivolumab Combination Immunotherapy: Mouse Tumor Models, In Vitro Functional Studies, and Cynomolgus Macaque Toxicology.PLoS One. 2016 Sep 9;11(9):e0161779. doi: 10.1371/journal.pone.0161779. eCollection 2016. PLoS One. 2016. PMID: 27610613 Free PMC article.
-
Combination therapy with nivolumab (anti-PD-1 monoclonal antibody): A new era in tumor immunotherapy.Int Immunopharmacol. 2022 Dec;113(Pt A):109365. doi: 10.1016/j.intimp.2022.109365. Epub 2022 Nov 1. Int Immunopharmacol. 2022. PMID: 36332452 Review.
-
Nivolumab and pembrolizumab as immune-modulating monoclonal antibodies targeting the PD-1 receptor to treat melanoma.Expert Rev Anticancer Ther. 2015;15(9):981-93. doi: 10.1586/14737140.2015.1074862. Epub 2015 Jul 30. Expert Rev Anticancer Ther. 2015. PMID: 26313415 Review.
Cited by
-
Biophysical and mechanobiological considerations for T-cell-based immunotherapy.Trends Pharmacol Sci. 2023 Jun;44(6):366-378. doi: 10.1016/j.tips.2023.03.007. Trends Pharmacol Sci. 2023. PMID: 37172572 Free PMC article. Review.
-
Advancing protein therapeutics through proximity-induced chemistry.Cell Chem Biol. 2024 Mar 21;31(3):428-445. doi: 10.1016/j.chembiol.2023.09.004. Epub 2023 Oct 5. Cell Chem Biol. 2024. PMID: 37802076 Free PMC article. Review.
-
Preclinical development of novel PD-L1 tracers and first-in-human study of [68Ga]Ga-NOTA-RW102 in patients with lung cancers.J Immunother Cancer. 2024 Apr 5;12(4):e008794. doi: 10.1136/jitc-2024-008794. J Immunother Cancer. 2024. PMID: 38580333 Free PMC article.
-
Alum-anchored intratumoral retention improves the tolerability and antitumor efficacy of type I interferon therapies.Proc Natl Acad Sci U S A. 2022 Sep 6;119(36):e2205983119. doi: 10.1073/pnas.2205983119. Epub 2022 Aug 29. Proc Natl Acad Sci U S A. 2022. PMID: 36037341 Free PMC article.
-
Combination CD200R/PD-1 blockade in a humanised mouse model.Immunother Adv. 2023 Mar 30;3(1):ltad006. doi: 10.1093/immadv/ltad006. eCollection 2023. Immunother Adv. 2023. PMID: 37082107 Free PMC article.
References
-
- Wei SC, Duffy CR, Allison JP. Fundamental mechanisms of immune checkpoint blockade therapy. Cancer Discov. [Internet] 2018;8:1069–86. doi:10.1158/2159-8290.CD-18-0367. - DOI - PubMed
Publication types
MeSH terms
Substances
Grants and funding
LinkOut - more resources
Full Text Sources
Research Materials