. 2023 Jan;43(1):208-220.
doi: 10.1111/liv.15383. Epub 2022 Sep 15.

DKK1 drives immune suppressive phenotypes in intrahepatic cholangiocarcinoma and can be targeted with anti-DKK1 therapeutic DKN-01

Affiliations

DKK1 drives immune suppressive phenotypes in intrahepatic cholangiocarcinoma and can be targeted with anti-DKK1 therapeutic DKN-01

Edward J Jarman et al. Liver Int. 2023 Jan.

Abstract

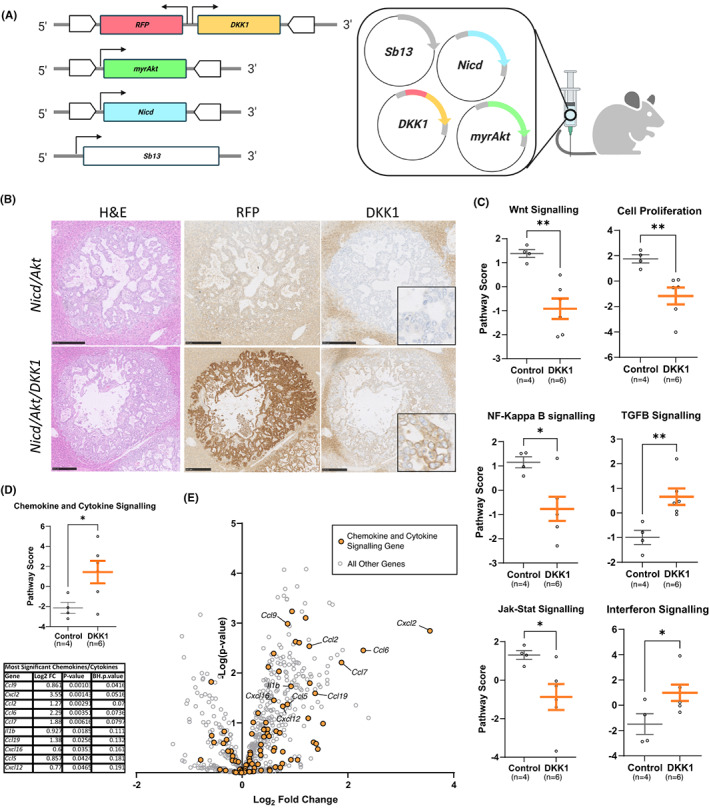
Background and aims: Dickkopf-1 (DKK1) is associated with poor prognosis in intrahepatic cholangiocarcinoma (iCCA), but the mechanisms behind this are unclear. Here, we show that DKK1 plays an immune regulatory role in vivo and inhibition reduces tumour growth.

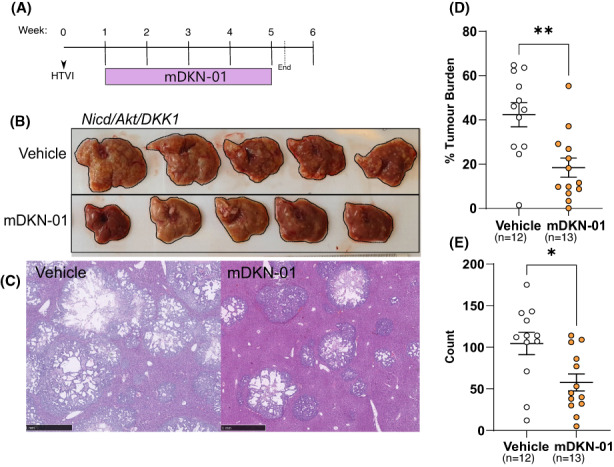
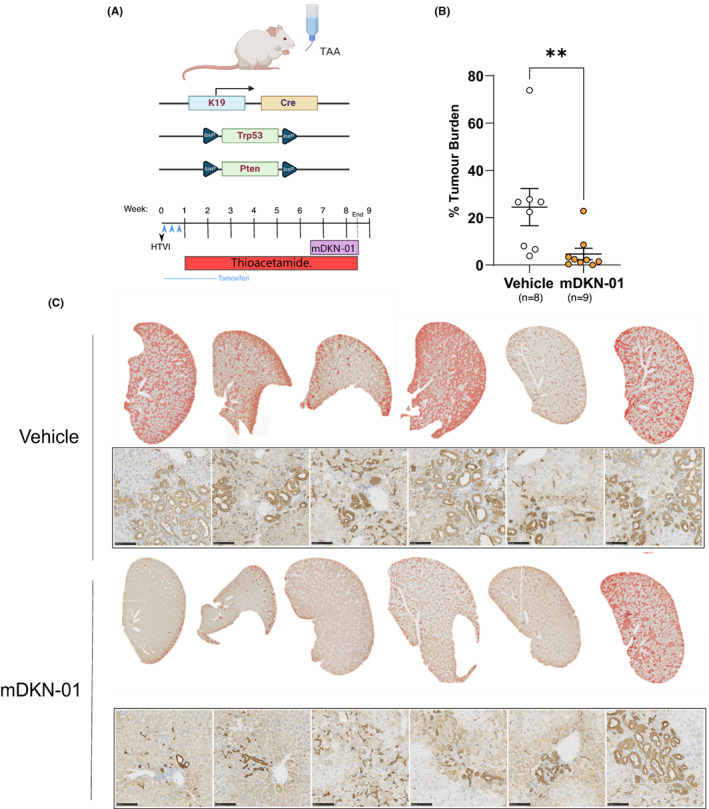
Methods: Various in vivo GEMM mouse models and patient samples were utilized to assess the effects of tumour specific DKK1 overexpression in iCCA. DKK1-driven changes to the tumour immune microenvironment were characterized by immunostaining and gene expression analysis. DKK1 overexpressing and damage-induced models of iCCA were used to demonstrate the therapeutic efficacy of DKK1 inhibition in these contexts using the anti-DKK1 therapeutic, DKN-01.

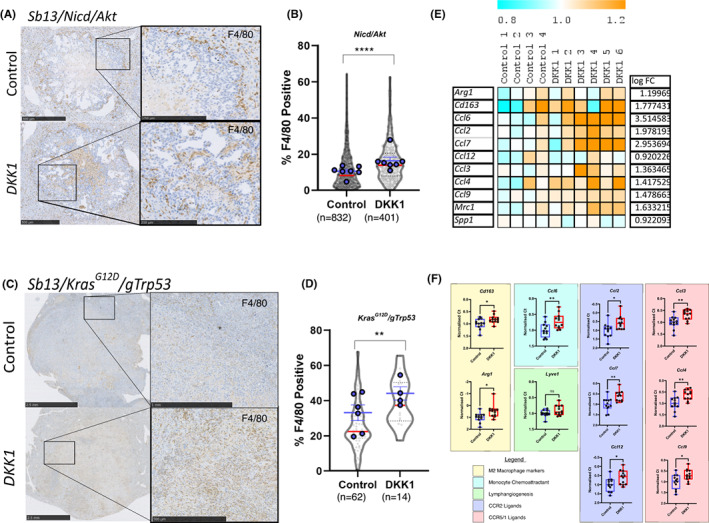
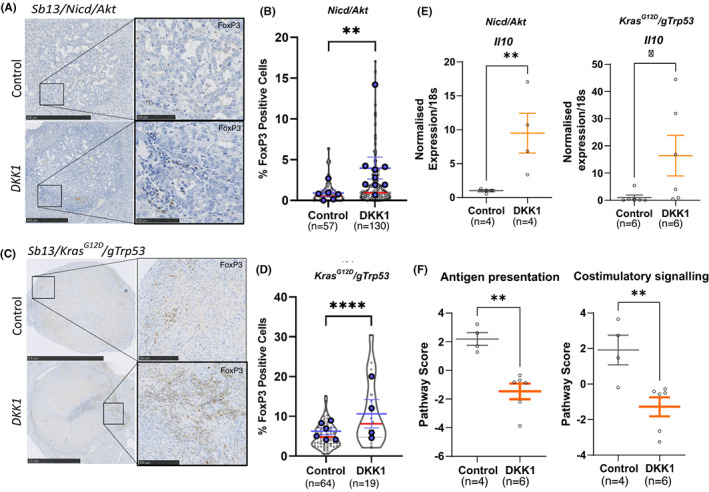
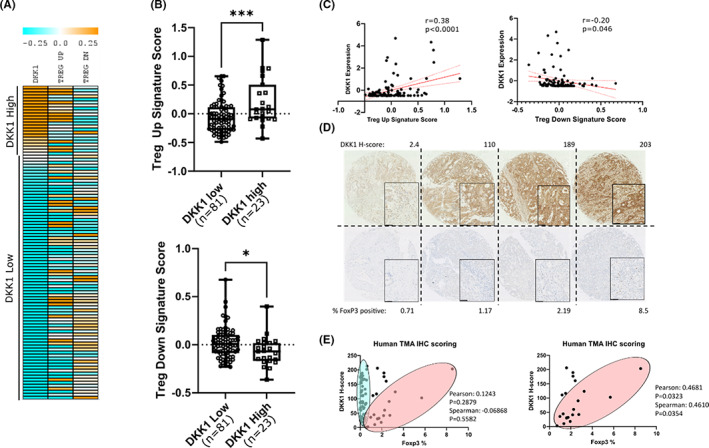
Results: DKK1 overexpression in mouse models of iCCA drives an increase in chemokine and cytokine signalling, the recruitment of regulatory macrophages, and promotes the formation of a tolerogenic niche with higher numbers of regulatory T cells. We show a similar association of DKK1 with FOXP3 and regulatory T cells in patient tissue and gene expression data, demonstrating these effects are relevant to human iCCA. Finally, we demonstrate that inhibition of DKK1 with the monoclonal antibody mDKN-01 is effective at reducing tumour burden in two distinct mouse models of the disease.

Conclusion: DKK1 promotes tumour immune evasion in iCCA through the recruitment of immune suppressive macrophages. Targeting DKK1 with a neutralizing antibody is effective at reducing tumour growth in vivo. As such, DKK1 targeted and immune modulatory therapies may be an effective strategy in iCCA patients with high DKK1 tumour expression or tolerogenic immune phenotypes.

Keywords: Dickkopf-1; cholangiocarcinoma; immune tolerance; macrophage; regulatory T cell.


Conflict of interest statement

This study was partially funded by Leap Therapeutics. M.K. and W.N. are employees and stockholders and/or stock option holders of Leap Therapeutics Inc. JWP is a founder, shareholder in and on the board of Macomics Ltd an immuno‐oncology company. These studies, however, do not conflict with those of the company. All other authors have no further conflicts to disclose.

Figures

FIGURE 1
FIGURE 1
DKK1 overexpression modulates chemokine and cytokine signalling in vivo. (A) Schematic of plasmids used to drive intrahepatic cholangiocarcinoma (iCCA) in our Nicd/Akt model, retrotransposase IR/DR regions are shown as white block arrows surrounding regions which are thereby integrated into the genome. (B) Histological sections of livers showing individual tumours from our Nicd/Akt model with and without the DKK1 plasmid included. H&E stained sections (left). Immunohistochemically stained sections of RFP (expressed on the same plasmid as DKK1) (middle), and DKK1 (right) (scale bar: 250 μm). (C) NanoString gene expression data showing combined gene expression scores for relevant pathways in Nicd/Akt and Nicd/Akt/DKK1 tumours, mean pathway scores with SEM are shown. (D) NanoString gene expression score for chemokine and cytokine signalling pathways in Nicd/Akt and Nicd/Akt/DKK1 tumours. A table showing log fold change and p‐value of specific factors is shown below. p‐values were corrected for FDR using the Benjamini–Hochberg (BH) procedure and are also shown. (E) Volcano plot showing differential gene expression in DKK1 samples compared to control. Genes associated with chemokine and cytokine signalling are coloured orange.
FIGURE 2
FIGURE 2
DKK1 promotes the recruitment of F4/80 TAM2 macrophages to tumours. (A) Immunohistochemistry of F4/80 in Nicd/Akt (top) or Nicd/Akt/DKK1 (bottom) tumour bearing livers (scale bars = 500 μm [insets = 250 μm]). (B) Quantification of F4/80‐positive cells shown in A as a percentage of total cell count within tumour regions. Individual tumour measurements shown in grey (violins with red median line) (p < .0001, unpaired Student's t‐test), while average measurements per animal are superimposed in blue with mean and SEM shown. (C) Immunohistochemical staining of F4/80 in Kras G12D /gTrp53 tumours with and without DKK1 overexpression (scale bars = 2.5 mm [inset top = 1 mm, inset bottom = 500 μm]). (D) Quantification of F4/80 staining in Kras G12D /gTrp53 model. Positive cells are shown as a percentage of total cells within the tumour region. Individual tumours shown in grey (violins with red median line) (p = .0013, unpaired Student's t‐test), while average measurements per animal are superimposed in blue with mean and SEM shown. (E) Heat map representation of normalized gene expression values for TAM2 associated genes from the NanoString gene expression experiment in Nicd/Akt (control) and Nicd/Akt/DKK1 (DKK1) tumours. (F) Quantitative real time PCR expression showing a similar increase in TAM2 associated markers in Kras G12D /gTrp53 tumours when DKK1 is overexpressed (n = 12 vs 12). Changes are shown as Ct values normalized to housekeeping gene expression.
FIGURE 3
FIGURE 3
DKK1 overexpression promotes the formation of a tolerogenic immune microenvironment in cholangiocarcinoma (CCA). (A) Immunohistochemical staining for FOXP3 (brown) in Nicd/Akt‐driven cancers with and without DKK1 expression (scale bars = 500 μm [insets = 250 μm]). (B) Quantification of FOXP3 staining in Nicd/Akt and Nicd/Akt/DKK1 tumours (n = 57 vs 130). Positive cells are shown as a percentage of total cells in the tumour area (violin plots with red median lines) (p = .0076, unpaired Student's t‐test), while average measurements per animal are superimposed in blue with mean and SEM shown. (C and D) Equivalent data to A and B above for the tumours in the Kras G12D /gTrp53 HTVI model (scale bars = 2.5 mm [insets = 250 μm]) (n = 64 vs 19) (p < .001, unpaired Student's t‐test). (E) Real time qPCR of Il10 expression from tumours in the Nicd/Akt and Kras G12D /gTrp53 models. Points show relative expression values normalized to 18 s RNA expression in control and DKK1 overexpressing tumours, bars represent mean values and SEM for n = 4 vs 4 tumours (Nicd/Akt, p = .0017) and n = 6 vs 6 (Kras G12D /gTrp53, p = .0107). (F) NanoString gene expression data showing combined gene expression scores for antigen presentation and costimulatory signalling, bars represent the mean and SEM (p = .0014 and p = 0.0093 respectively).
FIGURE 4
FIGURE 4
DKK1 is associated with increased FOXP3 regulatory T cells in human cholangiocarcinoma (CCA). (A) Heat map representation of gene expression in patient intrahepatic cholangiocarcinoma (iCCA) samples ordered by mean centred expression values for DKK1, which are shown alongside averaged gene scores for gene signatures upregulated in T reg (Treg up) and downregulated in T reg (Treg down). (B) Box and whisker plots showing mean centred gene expression values of TREG up (Top) and TREG down (Bottom) gene expression signatures in patients stratified into high and low groups based on DKK1 expression. Boxes represent the median and interquartile ranges of n = 81 vs 23 patients in DKK1 low and high groups respectively. p values were obtained by unpaired t‐test (p = .0003 and .0195 respectively). (C) Scatter plots showing mean centred, quantile normalized gene expression values for DKK1 vs gene expression scores for signatures associated with T reg upregulation (Treg up) and downregulation (Treg down) in data taken from Illumina beadchip expression array of CCA samples (GSE26566). Each point represents a separate patient sample (n = 104), linear regression line is shown in solid red (95% confidence intervals are red dotted lines). Pearson's correlation co‐efficient (r) and p‐values for significant correlation are shown. (D) Immunohistochemical staining of tumour cores from a tissue microarray (TMA) of iCCA patients stained with DKK1 (top) or FOXP3 (bottom) showing representative examples from low to high expression (scale bars = 50 μm). (E) Scatterplots showing the relationship between DKK1 H‐score and FOXP3% positivity from immunohistochemistry of the TMA. Patients appear to separate into two populations represented by blue and red ovals. While no significant correlation is seen in the population as a whole, when patients with the lowest FOXP3 values (blue oval) are removed (% FOXP3 < 0.7) (these patients display negligible levels of FOXP3 staining but a high variability in DKK1) the remaining population (red oval) demonstrates positive correlation between DKK1 and FOXP3 protein levels.
FIGURE 5
FIGURE 5
DKK1 inhibition with mDKN‐01 reduces tumour burden in Nicd/Akt/DKK1 mice. (A) Schematic of Nicd/Akt/DKK1 tumour bearing mice treated with mDKN‐01. (B) Whole livers of mice in vehicle group (top) or mDKN‐01 (bottom). (C) H&E staining showing representative examples of liver tumour burden in vehicle‐treated (left) and mDKN‐01‐treated (right) liver (scale bars = 1 mm). Quantification of liver burden (D) and tumour count (E) data from vehicle or mDKN‐01‐treated mice, individual mice are represented by points, bars show the mean and SEM. P‐values were obtained through unpaired Students t‐tests (p = .0022 (burden) and p = .0104 [count]).
FIGURE 6
FIGURE 6
DKK1 inhibition is effective in a damage‐induced model of intrahepatic cholangiocarcinoma (iCCA). (A) Schematic representation of experimental set‐up in our Keratin19‐CreERT/Pten flox/flox/Trp53 flox/flox thioacetamide model (KPP) of iCCA. Mice were treated with tamoxifen to induce Keratin19‐Cre‐driven recombination of floxed Trp53 and Pten genes specifically in cholangiocytes. Mice then received 400 mg/L TAA in their drinking water for 7.5 weeks. Mice received I.P. injections 20 mg/kg mDKN‐01 or vehicle control twice a week for 2 weeks. (B) Quantification of tumour burden in liver sections from these animals showing significantly reduced tumour coverage in mDKN‐01‐treated mice (p = .0037 Mann–Whitney). (C) Histological representation of tumour burden in vehicle and mDKN‐01‐treated livers. Top rows show low magnification liver sections with Keratin‐19‐positive areas overlaid in red to highlight differences in tumour coverage between these mice. Representative regions showing Keratin‐19 staining and tumour histology at higher magnification are shown below (scale bars = 100 μm).

References

    1. Brivio S, Cadamuro M, Strazzabosco M, Fabris L. Tumor reactive stroma in cholangiocarcinoma: the fuel behind cancer aggressiveness. World J Hepatol. 2017;9(9):455‐468. - PMC - PubMed
    1. Cadamuro M, Stecca T, Brivio S, et al. The deleterious interplay between tumor epithelia and stroma in cholangiocarcinoma. Biochim Biophys Acta Mol Basis Dis. 2018;1864(4 Pt B):1435‐1443. - PMC - PubMed
    1. Fabris L, Perugorria MJ, Mertens J, et al. The tumour microenvironment and immune milieu of cholangiocarcinoma. Liver Int. 2019;39(Suppl 1):63‐78. - PMC - PubMed
    1. Banales JM, Marin JJG, Lamarca A, et al. Cholangiocarcinoma 2020: the next horizon in mechanisms and management. Nat Rev Gastroenterol Hepatol. 2020;17(9):557‐588. - PMC - PubMed
    1. Valle JW, Kelley RK, Nervi B, Oh DY, Zhu AX. Biliary tract cancer. Lancet. 2021;397(10272):428‐444. - PubMed

Publication types

Substances