. 2022 Aug 30;13(4):e0102422.
doi: 10.1128/mbio.01024-22. Epub 2022 Aug 4.

Streptococcus pneumoniae Rapidly Translocate from the Nasopharynx through the Cribriform Plate to Invade the Outer Meninges

Affiliations

Streptococcus pneumoniae Rapidly Translocate from the Nasopharynx through the Cribriform Plate to Invade the Outer Meninges

Teerawit Audshasai et al. mBio. .

Abstract

The entry routes and translocation mechanisms of microorganisms or particulate materials into the central nervous system remain obscure We report here that Streptococcus pneumoniae (pneumococcus), or polystyrene microspheres of similar size, appear in the meninges of the dorsal cortex of mice within minutes of inhaled delivery. Recovery of viable bacteria from dissected tissue and fluorescence microscopy show that up to at least 72 h, pneumococci and microspheres were predominantly found in the outer of the two meninges: the pachymeninx. No pneumococci were found in blood or cerebrospinal fluid. Intravital imaging through the skull, aligned with flow cytometry showed recruitment and activation of LysM+ cells in the dorsal pachymeninx at 5 and 10 hours following intranasal infection. Imaging of the cribriform plate suggested that both pneumococci and microspheres entered through the foramina via an inward flow of fluid connecting the nose to the pachymeninx. Our findings bring new insight into the varied mechanisms of pneumococcal invasion of the central nervous system, but they are also pertinent to the delivery of drugs to the brain and the entry of airborne particulate matter into the cranium. IMPORTANCE Using two-photon imaging, we show that pneumococci translocate from the nasopharynx to the dorsal meninges of a mouse in the absence of any bacteria found in blood or cerebrospinal fluid. Strikingly, this takes place within minutes of inhaled delivery of pneumococci, suggesting the existence of an inward flow of fluid connecting the nasopharynx to the meninges, rather than a receptor-mediated mechanism. We also show that this process is size dependent, as microspheres of the same size as pneumococci can translocate along the same pathway, while larger size microspheres cannot. Furthermore, we describe the host response to invasion of the outer meninges. Our study provides a completely new insight into the key initial events that occur during the translocation of pneumococci directly from the nasal cavity to the meninges, with relevance to the development of intranasal drug delivery systems and the investigations of brain damage caused by inhaled air pollutants.

Keywords: Streptococcus pneumoniae; central nervous system; cribriform plate; infectious disease; inflammation; nose-to-meninges translocation.


Conflict of interest statement

The authors declare no conflict of interest.

Figures

FIG 1
FIG 1
Pneumococci intranasally instilled reach the meninges, by-passing the blood systemic circulation. (A) Schematic representation showing the situation of the tissues investigated. CSF, cerebrospinal fluid. Top right inset: Schematic magnification of the meninges of the dorsal brain showing the outer layer, the pachymeninx, which contains the collagenous dura mater, the inner layer, the leptomeninx, containing the subarachnoid space, and the underlying brain cortex. Both layers contain blood vessels (red circles). (B1 to B6) Pneumococci (Serotype 2, strain D39) were intranasally administered and CFU counted between 0 and 72 hours in tissue samples including the nasopharynx (NP), the olfactory bulb (OB), the skull and its adhering OB tissue (Sk/OB), the cortex and its adhering leptomeninx (lepto), the skull and its adhering pachymeninx (SK/pachy), the CSF, whole blood, and lungs. Data are shown as mean ± SEM (n = 5 mice per time point).
FIG 2
FIG 2
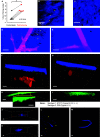
Intranasally administered pneumococci are rapidly and predominantly found in the pachymeningeal compartment of the dorsal meninges. (A) Pneumococci D39 were applied to the nose and the mice euthanized 10 hours later. The skull and brain were separated, and CFU were counted for tissue from the superficial cortex + attached tissue and for tissue scraped from the skull (“pachymeninx”). The numbers of CFU were counted and expressed relative to the weight of protein per tissue sample. In the infected mice, the density of CFU was much higher in the tissue scraped from the skull. (B) CFSE-labeled serotype 1 (ST217) pneumococci at 90 minutes postinfection in tissue adhering to the skull after removal of the brain and imaged from the intracranial face (the “amaguri” preparation of Toriumi et al. [40]). Excitation was by laser at 840 nm, which produced two-photon excitation of CFSE (green), and second harmonic generation (SHG) (blue) from collagen and skull bone. Image is representative of n = 3 mice. Maximum intensity z-projection, z = 171 μm. (C) Under identical imaging conditions to panel B, no green particles were detected in an uninfected naive mouse. Maximum intensity z-projection, z = 178 μm. (D, F) CFSE-labeled serotype 1 (ST217) S. pneumoniae were instilled in the nose of a mouse. Thirty minutes later, the mouse was killed with CO2 and perfused with DiI to label blood vessels (Li et al. [42]). Imaging was done through the skull and into the meninges. CFSE-labeled Sp (green) are seen in a z-projection 444 μm deep (D). In a 3D projection, Sp are seen close to the skull (blue: SHG) and above large blood vessels (red), but are absent from deeper layers (F). (E and G) Under identical imaging conditions to (F), no green particles were detected in an uninfected mouse. Z-stack (E) and 3D representation (G). Scale bar = 50 μm. (H) S. pneumoniae D39 expressing mKate were instilled in the nose. After 3.7 hours, the dorsal meninges and underlying brain were imaged in vivo through the skull with excitation at 1,140 nm. The SHG from skull bone and collagen is green and emission from mKate is red. A representative xz-section including two groups of pneumococci is shown. (I) Similar red signals were not seen in uninfected mice under the same imaging conditions as in panel H. (J and K) Serotype 1 (ST217) S. pneumoniae stained with BacLight Red were instilled in the nose. At 15 minutes postadministration, mice were perfused transcardially with PBS followed by fixing solution (4% PFA). Dorsal skull mounts were stained with anti-LYVE1 antibody and imaged on the skull bone-oriented surface with excitation at 561 and 405 nm. A representative xz-projection of the skull whole mount is shown for the Sp-infected (J) and uninfected (K) mouse. (L and M) Maximum intensity z-projection of the images shown in (J) and (K), respectively, z = 16.75 μm and z = 340.37 μm. *, P < 0.05.
FIG 3
FIG 3
Microspheres administered intranasally were found in a layer close to the skull. (A to C) One-micrometer-diameter green fluorescent microspheres were applied to the nose of a mouse (A) and 2-μm Nile Red-labeled microspheres were injected in the cisterna magna of another mouse (B). (C) A third mouse was subjected to both procedures, i.e., intranasal administration of 1-μm green fluorescent microspheres followed immediately by intracisternal injection of 2-μm Nile Red-labeled microspheres. In each case, 30 minutes after the infection, the mouse was euthanized, and the meninges and cortex were examined through the skull with two-photon microscopy. (A to C) Microspheres administered intranasally were only found in a layer close to the skull (A and C) while those infused in the cisterna magna were deeper (B and C). Scale bar = 50 μm. (D) The distances from the skull of all fluorescent Sp (black circles) measured in the 3D reconstructions measured postmortem as for Fig. 2, panels D to I. The distances from the skull of Sp and fluorescent microspheres measured in the 3D reconstructions measured postmortem as for Fig. 3, panels A to C, upon intranasal instillation of Sp (black circles, n = 120 signals, imaging of 4 mice), or upon intranasal (green circles, n = 90 signals, imaging of 4 mice) or intracisternal (red circles, n = 6 signals, imaging of 3 mice) administration of microspheres. ****, P < 0.0001. IN, intranasal; IC, intracisternal; MS, microspheres; Sp, Streptococcus pneumoniae.
FIG 4
FIG 4
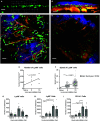
Intranasal instillation by S. pneumoniae leads to transient recruitment and activation of LysM+ in the calvarial pachymeninx. (A and B). In vivo two-photon imaging shows that nearly all intracranial LysM+ cells are in the meninges. (A) Horizontal view of a 3D reconstruction from a z-stack of an uninfected mouse showing only LysM+GFP cells, which lie in a shallow layer. (B) A different view of the 3D image in panel A showing, in addition to the LysM+GFP cells (in green), the skull bone (in blue: SHG), nuclei of the pachymeninx (blue from intravenous injection of furamidine), and blood vessels (shown orange-yellow, labeled with rhodamine). Excitation at 840 nm. (C) Tracks of LysM+ cells in the meninges of a mouse imaged at 10 hours after intranasal administration of pneumococci serotype 2 D39; z-projection of z-stacks at 23 μm deep; time series for 15 min. (D) Tracks of LysM+ cells in the meninges of an uninfected mouse under the same imaging conditions as panel C: z-projection at 30 μm deep; time series for 32 min. All images shown in panels A to D were acquired at 10 hour postchallenge. (E) Numbers of LysM+ GFP cells per unit area of the meninges counted in in vivo images. Each point was obtained from one z-stack. The linear regression line has a slope greater than one with P = 0.016. (F) Mean track speeds of mobile GFP+ cells in the same imaging conditions as in panel E. (G to I) Flow cytometry of cells from tissue scraped from the calvarial skull. Cells selected as CD45+, CD4+, and CD11b+ were further sorted into LysM+ (G), Ly6G+ (H), or CD11c+ (I) cells. Each dot represents one mouse; error bars are SEMs; *, P < 0.05; **, P < 0.01.
FIG 5
FIG 5
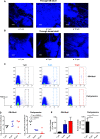
The speed of transit from nose to calvarial meninges is lower for larger microspheres. Transport from the nose of fluorescent microspheres of three diameters was examined: 1 μm (yellow-green), 5 μm, and 10 μm (Nile Red); 105 microspheres in 10 μL were applied to the nose and the mice were killed 30 minutes later. (A and B) Two-photon imaging ex vivo through the skull and into the meninges in the areas of the olfactory bulb (A) and the dorsal brain (B). Z-stacks were 154 μm deep. Excitation was at 840 nm, which produced fluorescence from the microspheres and blue SHG from bone and collagen. (C to E) For each of the three diameters of microsphere (1, 5, and 10 μm), five mice were inoculated. 30 minutes later, pachymeningeal tissue was scraped from the skull covering the olfactory bulb and from the dorsal skull, and the numbers of microspheres counted by flow cytometry. F.I., fluorescence intensity; a.u., arbitrary units. The numbers of beads detected by flow cytometry for each tissue sample (within the dashed rectangles in panel C) are plotted in panel D where each dot represents one mouse. To better illustrate the dynamics of the translocation, the numbers were then expressed as percentages of the number (105) of microspheres applied to the nose and plotted on a linear scale (E). Error bars indicate SEMs, one-way ANOVA followed by Tukey’s post hoc test, **, P < 0.01.
FIG 6
FIG 6
Microspheres and S. pneumoniae on the cribriform plate. Two-photon images of the intracranial face of freshly dissected ethmoid bone covered by a layer of olfactory bulb tissue (which gives no signal). (A) Excitation at 900 nm gives blue SHG from the cribriform plate. This was a naive LysM-GFP reporter mouse. (B) Excitation at 1140 nm gives an image of collagen-like fiber structures, presumably dura mater. This was a CD11c-YFP reporter mouse. YFP is poorly excited at 1140 nm but faint CD11c+ cells can be seen. (C and D) 3.8 × 107 yellow-green fluorescent polystyrene microspheres of 1 μm diameter size (green) (C) or BacLight Red-stained serotype 1 (ST217) pneumococci (red) (D) were administered intranasally. The mice were culled at 30 minutes, and the intracranial face of the cribriform plate (SHG: blue) was imaged with excitation at 840 nm. Baclight Red was detected at 571 to 664 nm. Microspheres and pneumococci are seen close to the bone; some microspheres are drifting in the superfusate. (E) Scheme (not to scale) of the anatomy of the pathway (partly hypothetical, sagittal section). Olfactory neurons with their cell bodies in the olfactory epithelium send axons through the foramina of the cribriform plate where they are surrounded by cells which have been described as “olfactory ensheathing cells” (12, 134–137) or as forming extensions to some, or all, of the pia, the arachnoid, the dura, and the periosteum (27, 138–140). Microspheres and pneumococci (yellow dots) are transported through the cribriform plate and are found in the pachymeninx (yellow arrows), which is separated from the leptomeninx by the arachnoid barrier layer (abl; red line). (F) Enlargement of the dashed rectangle in panel E. CSF flows out of the subarachnoid space of the leptomeninx (lm) along extracellular spaces in a bundle of olfactory nerve fibers that traverses a foramen of the cribriform plate (cp). Lymph draining from the pachymeninx flows out (46, 119) through a lymph vessel (lv), Sp, and microspheres are carried into the pachymeninx (pm) along a space adjacent to the lamina propria (lp) (Galeano et al. [27]). The arachnoid barrier layer (abl) is indicated by a red line.

Similar articles

Cited by

References

    1. Jusot J-F, Neill DR, Waters EM, Bangert M, Collins M, Bricio Moreno L, Lawan KG, Moussa MM, Dearing E, Everett DB, Collard J-M, Kadioglu A. 2017. Airborne dust and high temperatures are risk factors for invasive bacterial disease. J Allergy Clin Immunol 139:977–986.e972. doi: 10.1016/j.jaci.2016.04.062. - DOI - PMC - PubMed
    1. Kim H, Kim W-H, Kim Y-Y, Park H-Y. 2020. Air pollution and central nervous system disease: a review of the impact of fine particulate matter on neurological disorders. Front Public Health 8:575330. doi: 10.3389/fpubh.2020.575330. - DOI - PMC - PubMed
    1. Heusinkveld HJ, Wahle T, Campbell A, Westerink RHS, Tran L, Johnston H, Stone V, Cassee FR, Schins RPF. 2016. Neurodegenerative and neurological disorders by small inhaled particles. Neurotoxicology 56:94–106. doi: 10.1016/j.neuro.2016.07.007. - DOI - PubMed
    1. Kristensson K. 2011. Microbes' roadmap to neurons. Nat Rev Neurosci 12:345–357. doi: 10.1038/nrn3029. - DOI - PubMed
    1. Salvadori G, Junges R, Morrison DA, Petersen FC. 2019. Competence in Streptococcus pneumoniae and close commensal relatives: mechanisms and implications. Front Cell Infect Microbiol 9:94. doi: 10.3389/fcimb.2019.00094. - DOI - PMC - PubMed

Publication types