. 2022 Aug 30;7(4):e0045422.
doi: 10.1128/msystems.00454-22. Epub 2022 Aug 4.

Exploiting Violet-Blue Light to Kill Campylobacter jejuni: Analysis of Global Responses, Modeling of Transcription Factor Activities, and Identification of Protein Targets

Affiliations

Exploiting Violet-Blue Light to Kill Campylobacter jejuni: Analysis of Global Responses, Modeling of Transcription Factor Activities, and Identification of Protein Targets

Peter Walker et al. mSystems. .

Abstract

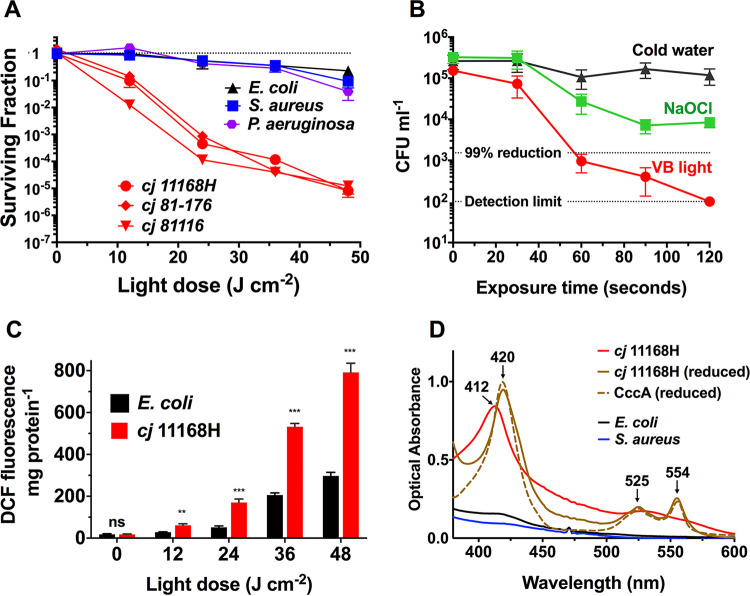
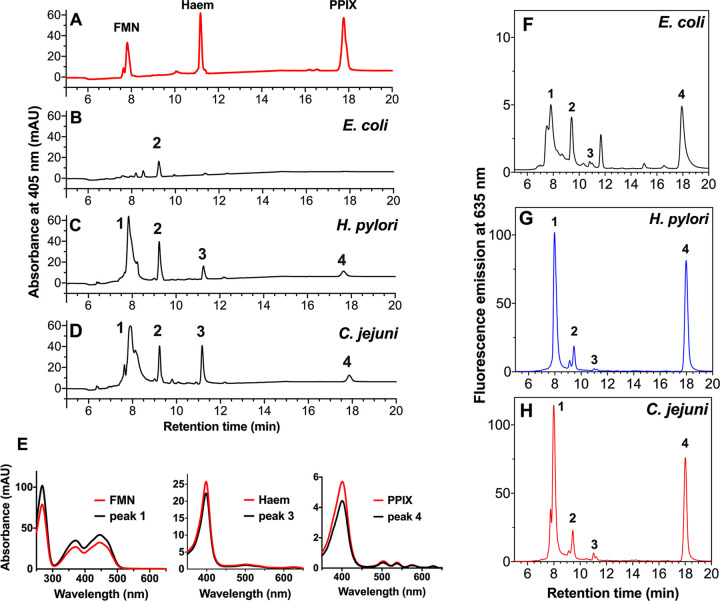
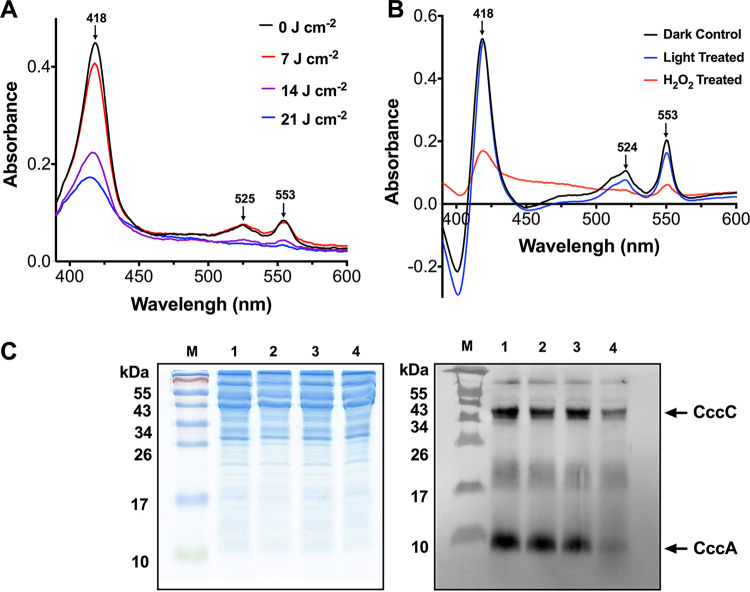
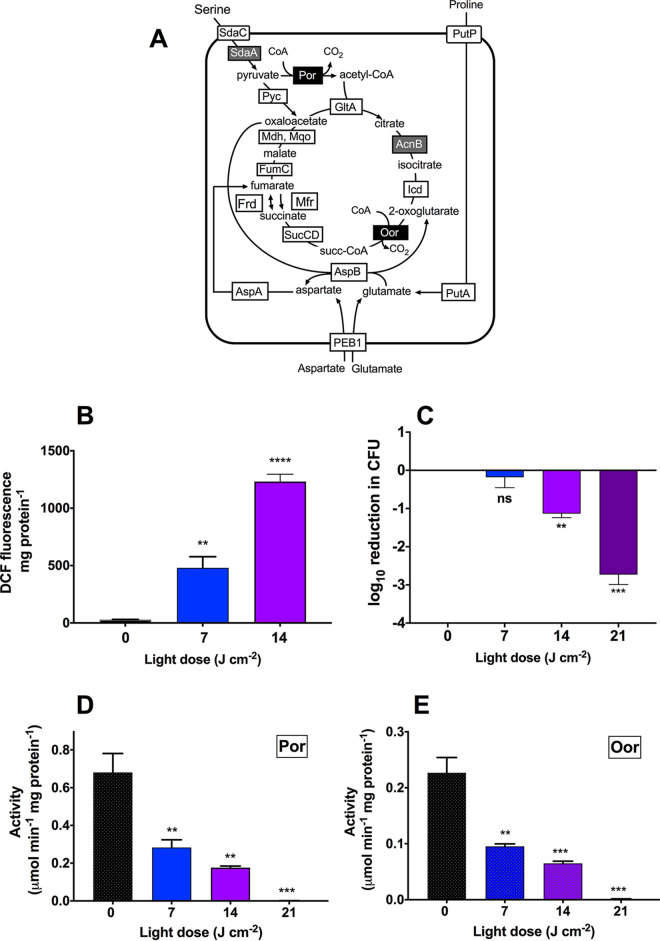
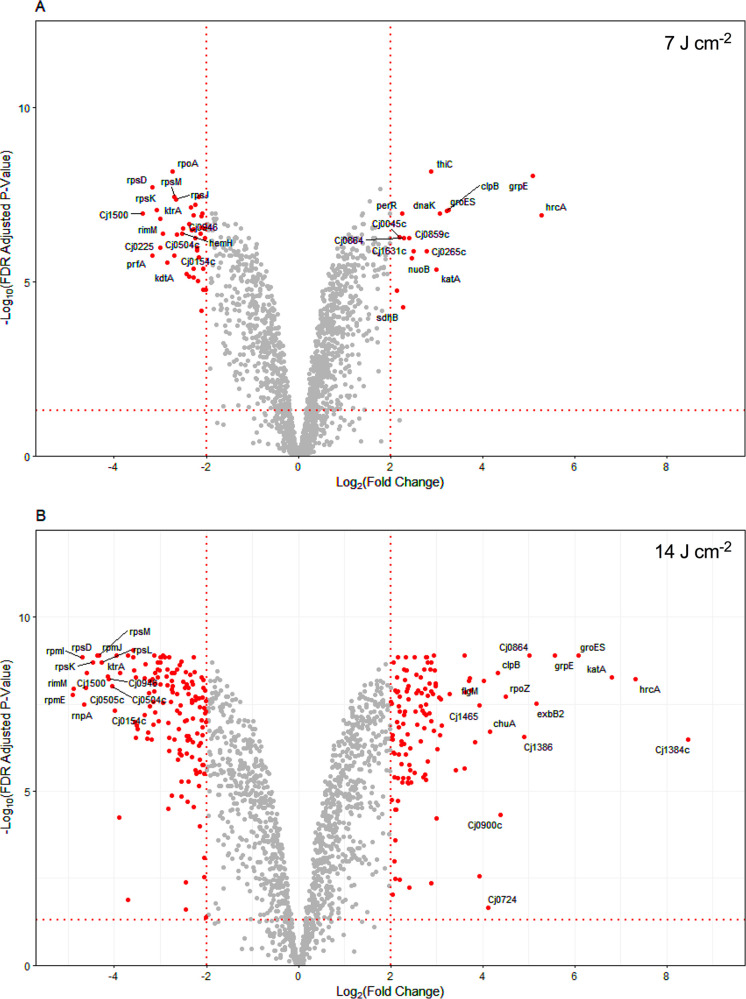
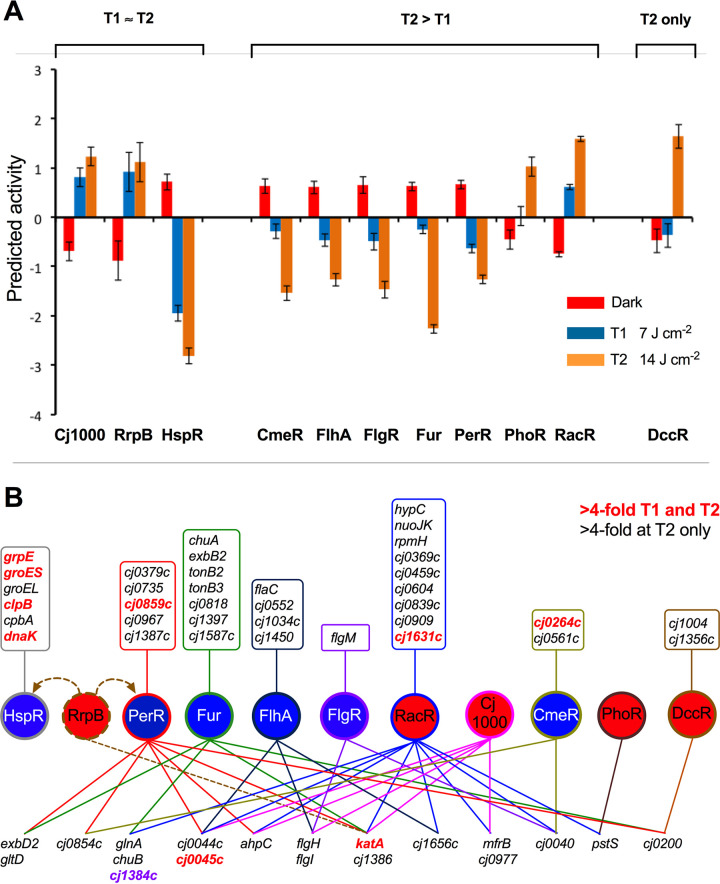
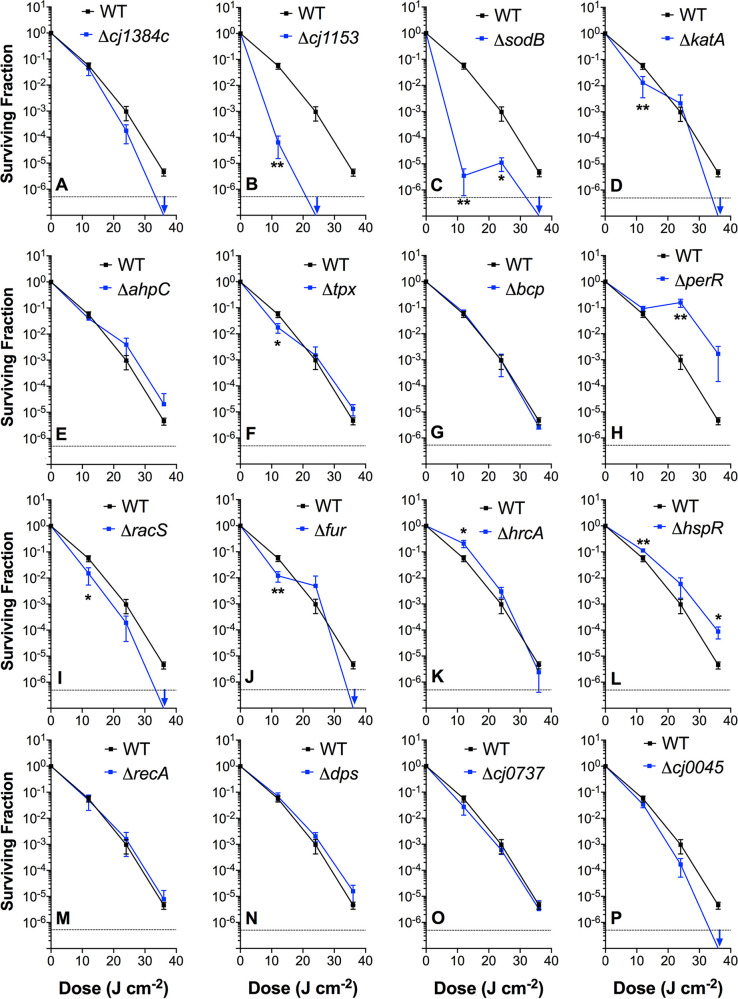
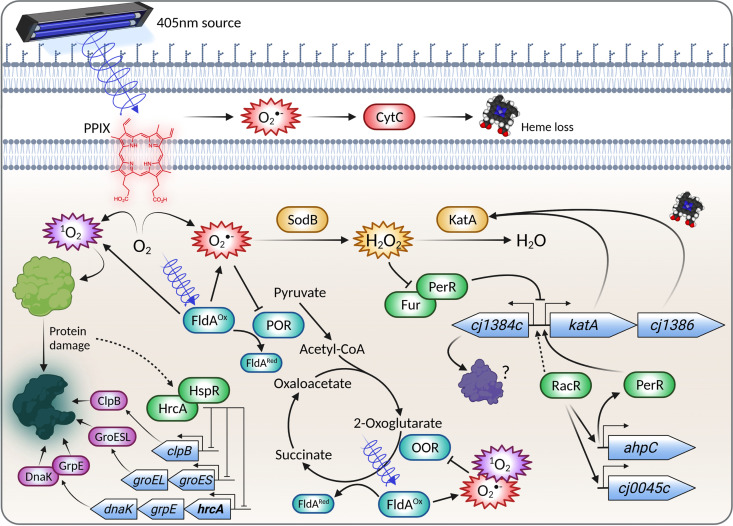
Campylobacter jejuni is a microaerophilic foodborne zoonotic pathogen of worldwide concern as the leading cause of bacterial gastroenteritis. Many strains are increasingly antibiotic resistant and new methods of control are required to reduce food-chain contamination. One possibility is photodynamic inactivation (PDI) using violet-blue (VB) light, to which C. jejuni is highly susceptible. Here, we show that flavin and protoporphyrin IX are major endogenous photosensitizers and that exposure of cells to VB light increases intracellular reactive oxygen species (ROS) to high levels, as indicated by a dichlorodihydrofluorescein reporter. Unusually for an oxygen-respiring bacterium, C. jejuni employs several ROS-sensitive iron-sulfur cluster enzymes in central metabolic pathways; we show that VB light causes rapid inactivation of both pyruvate and 2-oxoglutarate oxidoreductases, thus interrupting the citric acid cycle. Cells exposed to VB light also lose heme from c-type cytochromes, restricting electron transport, likely due to irreversible oxidation of heme-ligating cysteine residues. Evaluation of global gene expression changes by RNAseq and probabilistic modeling showed a two-stage protein damage/oxidative stress response to VB light, driven by specific regulators, including HspR, PerR, Fur, and RacR. Deletion mutant analysis showed that superoxide dismutase and the cytochrome CccA were particularly important for VB light survival and that abolishing repression of chaperones and oxidative stress resistance genes by HcrA, HspR, or PerR increased tolerance to VB light. Our results explain the high innate sensitivity of C. jejuni to VB light and provide new insights that may be helpful in exploiting PDI for novel food-chain interventions to control this pathogen. IMPORTANCE Campylobacteriosis caused by C. jejuni is one of the most widespread zoonotic enteric diseases worldwide and represents an enormous human health and economic burden, compounded by the emergence of antibiotic-resistant strains. New interventions are urgently needed to reduce food-chain contamination. Although UV light is well known to be bactericidal, it is highly mutagenic and problematic for continuous exposure in food production facilities; in contrast, narrow spectrum violet-blue (VB) light is much safer. We confirmed that C. jejuni is highly susceptible to VB light and then identified some of the global regulatory networks involved in responding to photo-oxidative damage. The identification of damaged cellular components underpins efforts to develop commercial applications of VB light-based technologies.

Keywords: RNAseq; flavin; microaerophile; oxidative stress; photodynamic inactivation; protoporphyrin.


Conflict of interest statement

The authors declare no conflict of interest.

Figures

FIG 1
FIG 1
Light-induced killing, reactive oxygen species (ROS) accumulation, and spectral analysis of intact cells. (A) Comparison of photoinactivation by 405-nm light of C. jejuni (11168H, 81-176, and 81116 strains), S. aureus SH1000, E. coli MG1655, and P. aeruginosa PAO1 grown in liquid medium. (B) Viability changes of C. jejuni on the surface of chicken skin after exposure to either cold water, sodium hypochlorite (NaOCl, 50 ppm available chlorine), or 405-nm violet-blue (VB) light for 2 min. (C) Comparison of ROS accumulation in C. jejuni and E. coli after photoinactivation with 405-nm light. Bacteria were loaded with 10 μM DCFH-DA (2,7-dichlorodihydrofluorescein diacetate) and exposed to 405-nm light at the indicated doses before background-corrected DCF fluorescence was measured. DCFH-DA was exposed to 405-nm light in buffer alone, but no fluorescence increase was detected. Significant differences between C. jejuni and E. coli samples were determined by Student’s t test (**, P ≤ 0.01; ***, P ≤ 0.001; ns, not significant). (D) Absorption spectra of untreated intact cells of C. jejuni 11168H (red spectrum), E. coli MG1655 (black spectrum), and S. aureus SH1000 (blue spectrum). Cells were grown in liquid medium to mid-log growth phase and suspended in sodium phosphate buffer (1 mg · mL−1 total protein). After the addition of a few grains of sodium dithionite, the C. jejuni cells (brown spectrum) show a typical c-type cytochrome spectrum, with maxima of 420 nm (Soret peak), 525 nm (beta peak), and 554 nm (alpha peak); this is very similar to purified and reduced CccA (Cj1153; 10 μM), the most abundant periplasmic c-type cytochrome in C. jejuni (dashed brown spectrum). Values in panels A, B, and C are means of three independent experiments, error bars indicate standard deviation (SD). In some cases in panel A, error bars are too small to be seen.
FIG 2
FIG 2
Identification of endogenous chromophores absorbing 405-nm light. (A) Reversed-phase high-pressure liquid chromatography (HPLC) separation of the three standards flavin mononucleotide (FMN), heme, and protoporphyrin IX (PPIX) with retention times of 7.64, 11.18, and 17.77 min, respectively. (B to D) Extracts from E. coli (B), H. pylori (C), and C. jejuni (D) with pigments detected by the absorption at 405 nm. Samples were normalized based on protein concentration before pigments were extracted using acidified methanol and subjected to reversed-phase HPLC analysis. Peak 1 (retention time of 7.83 min for H. pylori and 7.89 min for C. jejuni) closely matches the retention time of FMN; peak 2 does not match any of the standards used; peak 3 (retention time of 11.25 min for H. pylori and 11.16 for C. jejuni) closely matches the retention time for heme; and peak 4 (retention time of 17.64 min for H. pylori and 17.86 min for C. jejuni) closely matches the retention time for PPIX. (E) To confirm the identity of peaks 1, 3, and 4, their electronic absorption spectra were obtained and compared with the standards. (F to H) Fluorescence analysis of 405-nm absorbing pigments separated by reversed-phase HPLC. Extraction and separation of samples of (F) E. coli, (G) H. pylori, and (H) C. jejuni was carried out as described in the Fig. 2 legend, but with fluorescence emission detection at 635 nm and excitation at 405 nm. Note that the scale for the E. coli trace is 0 to 12.5 arbitrary fluorescence units (AU), while that for H. pylori and C. jejuni is 0 to 125 AU.
FIG 3
FIG 3
VB light causes loss of heme from c-type cytochromes. (A) The UV-VIS dithionite reduced minus ascorbate oxidized absorbance spectra of wild-type C. jejuni periplasmic extracts (1 mg · mL−1 protein) after increasing doses of 405-nm light were given to intact cells. Cytochrome c Soret (418 nm), β- (525 nm), and α- (553 nm) bands are indicated by an arrow. (B) The UV-VIS dithionite reduced minus ascorbate oxidized absorbance spectra of purified C. jejuni CccA (Cj1153) c-type cytochrome in sodium phosphate buffer before (black trace) and after 21-J · cm−2 405-nm light treatment (blue trace) or 10 mM hydrogen peroxide treatment (red trace). (C) 15% SDS-PAGE gel of periplasmic proteins (15 μg per lane) from cells grown in BTS broth were exposed to varied doses of 405-nm light. Left panel: stained with Coomassie blue. Right panel: heme blot (30-s exposure). Lane M, pre-stained protein markers; lane 1, wild-type 0 J · cm−2; lane 2, wild-type 7 J · cm−2, lane 3, wild-type 14 J · cm−2, lane 4, wild-type 21 J · cm−2. The positions of CccA and CccC (identified by their mass and by comparison with data from Liu and Kelly [17]) are indicated by arrows.
FIG 4
FIG 4
VB light inactivates key iron-sulfur cluster enzymes. (A) Central carbon metabolism of C. jejuni modified from Kendall et al. (16). Fe-S cluster enzymes are highlighted in gray or black text boxes. SdaC, serine transporter; SdaA, serine dehydratase; POR, pyruvate:acceptor oxidoreductase; GltA, citrate synthase; Acn, aconitase; Icdh, isocitrate dehydrogenase; Mqo, malate:quinone oxidoreductase; Mdh, malate dehydrogenase; OOR, 2-oxoglutarate:acceptor oxidoreductase; Suc, succinyl-CoA synthetase; Fum, fumarase; Frd, fumarate reductase (Note: in C. jejuni there is no succinate dehydrogenase, but the type B fumarate reductase is bi-directional.) (B) Comparison of ROS accumulation in C. jejuni after treatment with 405-nm light. Bacteria were loaded with 10 μM DCFH-DA and exposed to 405-nm light before fluorescence was measured. DCFH-DA in buffer exposed to 405-nm light in buffer showed no increase in fluorescence. Data are mean values from three independent cultures, with error bars showing standard deviation (**, P ≤ 0.01; ****, P ≤ 0.0001) compared to the unilluminated control (0 J · cm−2). (C) Loss of C. jejuni 11168H viability after exposure to increasing doses of 405-nm light. Data (reduction in log10 CFU) are mean values from three independent cultures, with error bars showing standard deviation (ns, not significant; **, P ≤ 0.01; ***, P ≤ 0.001), compared to the unilluminated control. (D, E) Activities of two key iron sulfur cluster enzymes, POR (D) and OOR (E), in anaerobic cell extracts prepared from mid-log C. jejuni cells. Cells were exposed to 405-nm light in 6-well plates before being lysed, and their enzyme activities were measured. Data are means of three independent replicates and error bars indicate standard deviation. Significant differences are shown as **, P ≤ 0.01 or ***, P ≤ 0.001 compared to the unilluminated control.
FIG 5
FIG 5
Transcriptome analysis of the VB light response. Volcano plots showing RNAseq data for (A) 15 min (T1; 7 J · cm−2) and (B) 30 min after exposure to 405 nm light (T2; 14 J · cm−2) compared to unexposed samples (T0). Genes showing a fold change of ≥4 with a false discovery rate-adjusted P value of ≤0.01 are highlighted (red dots). The 15 most upregulated and 15 most downregulated genes are labeled. The full list of significantly differentially expressed genes is given in Table S1 in the supplemental material.
FIG 6
FIG 6
Inferred transcription factor activity during VB light exposure. (A) The output from the TFInfer program (22) in the dark (T0; red bars) compared to 7 J · cm−2 (T1; blue bars) and 14 J · cm−2 (T2; orange bars) 405-nm light is shown for specific regulators, grouped according to the difference between the T1 and T2 responses. Error bars represent the standard deviation provided by the posterior distributions. (B) Major regulatory networks mediating >4-fold increases in gene expression in response to VB light. Regulators are shown as named circles colored to indicate increased (red) or decreased (blue) activity according to the TFInfer output. Genes responding to more than one regulator are arrayed across the bottom of the diagram and are linked to the relevant regulators by differently colored lines. Genes with only a single regulator are listed in the boxes above the cognate regulator. Genes for which an increase in expression was evident at both T1 and T2 are colored red, whereas genes which only increased in expression at T2 are colored black. The most highly upregulated gene at T2 is colored purple. Dashed arrows for RrpB indicate uncertainty about its regulation of hspR, perR, and katA due to a discrepancy between microarray data (44, 45), used for the connectivity matrix in this study, and RNAseq studies (46).
FIG 7
FIG 7
Photodynamic inactivation profiles of C. jejuni wild-type and isogenic mutants. Cells were suspended in sodium phosphate buffer to an OD600 0.1 and either kept in the dark or exposed to 12, 24, or 36 J · cm−2 doses of 405-nm light from a commercial photodiode. Data show log reduction means after 20 min light exposure. Three independent cell suspensions were used per strain, each sampled three times for viable count determination. Significant differences calculated by Student’s t test are shown as *, P ≤ 0.05; **, P ≤ 0.01; or ***, P ≤ 0.001.
FIG 8
FIG 8
Model showing some of the major responses to VB light in C. jejuni. Exposure of the microaerophile C. jejuni to VB light (405 nm) results in photoexcitation of protoporphyrin IX (PPIX) and the FMN cofactor of the flavodoxin, FldA. Energy transfer to molecular oxygen generates highly reactive singlet oxygen, which can cause direct protein (and other macromolecule) damage, as well as other ROS, such as superoxide, resulting in more extensive oxidative damage. The cell responds to protein damage by early induction of the heat shock response system, including GroESL, GrpE, DnaK, ClpB, mediated by the regulators HrcA and HspR (HrcA regulates its own expression [bold] and that of the groES operon in addition to HspR). The iron-sulfur clusters of enzymes such as pyruvate and 2-oxoglutarate oxidoreductase are very susceptible to superoxide, while heme loss from periplasmic c-type cytochromes can also occur. Superoxide dismutase (SodB) is a key protective enzyme in the photo-oxidative stress response, which also involves the peroxide-sensing regulator PerR. PerR, along with Fur, modulates the expression of many genes, but de-repression of the cj1384c-cj1385(katA)-cj1386 cluster seems particularly important. Cj1386 is an ankyrin repeat protein which has a role in heme trafficking to catalase (KatA), promoting the detoxification of hydrogen peroxide. The role of Cj1384 is unknown. Other regulators, such as RacR, also have roles in the response by influencing the expression of various genes which encode oxidative defense proteins, such as the thiol peroxidase AhpC and the hemerythrin Cj0045. The figure shows only some of the many effects of VB light on C. jejuni. Figure was created with BioRender.com.

Similar articles

Cited by

References

    1. Kaakoush NO, Castaño-Rodríguez N, Mitchell HM, Man SM. 2015. Global epidemiology of Campylobacter infection. Clin Microbiol Rev 28:687–720. doi:10.1128/CMR.00006-15. - DOI - PMC - PubMed
    1. Luber P, Brynestad S, Topsch D, Scherer K, Bartelt E. 2006. Quantification of Campylobacter species cross-contamination during handling of contaminated fresh chicken parts in kitchens. Appl Environ Microbiol 72:66–70. doi:10.1128/AEM.72.1.66-70.2006. - DOI - PMC - PubMed
    1. Buzby JC, Allos BM, Roberts T. 1997. The economic burden of Campylobacter-associated Guillain-Barré syndrome. J Infect Dis 176 Suppl 2:S192–S197. doi:10.1086/513785. - DOI - PubMed
    1. Wagenaar JA, French NP, Havelaar AH. 2013. Preventing Campylobacter at the source: why is it so difficult? Clin Infect Dis 57:1600–1606. doi:10.1093/cid/cit555. - DOI - PubMed
    1. Sheppard SK, Dallas JF, Strachan NJ, MacRae M, McCarthy ND, Wilson DJ, Gormley FJ, Falush D, Ogden ID, Maiden MC, Forbes KJ. 2009. Campylobacter genotyping to determine the source of human infection. Clin Infect Dis 48:1072–1078. doi:10.1086/597402. - DOI - PMC - PubMed

Publication types

MeSH terms

LinkOut - more resources