Review
. 2022 Nov;32(6):1013-1026.
doi: 10.1111/jon.13031. Epub 2022 Aug 4.

Brain topography on adult ultrasound images: Techniques, interpretation, and image library

Affiliations
Review

Brain topography on adult ultrasound images: Techniques, interpretation, and image library

Sahil Kapoor et al. J Neuroimaging. 2022 Nov.

Abstract

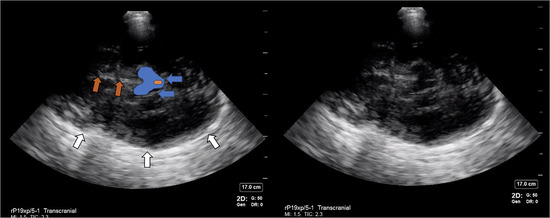
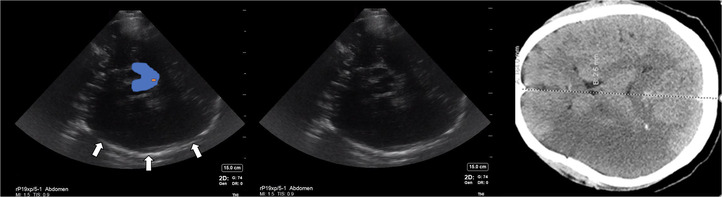
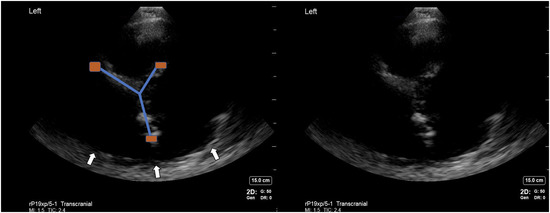
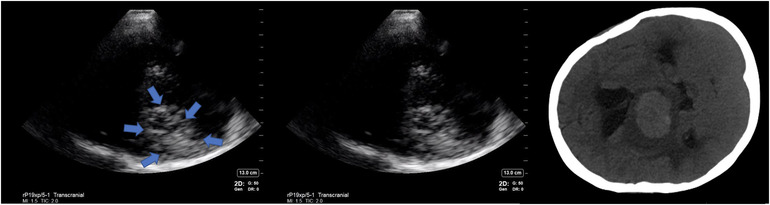
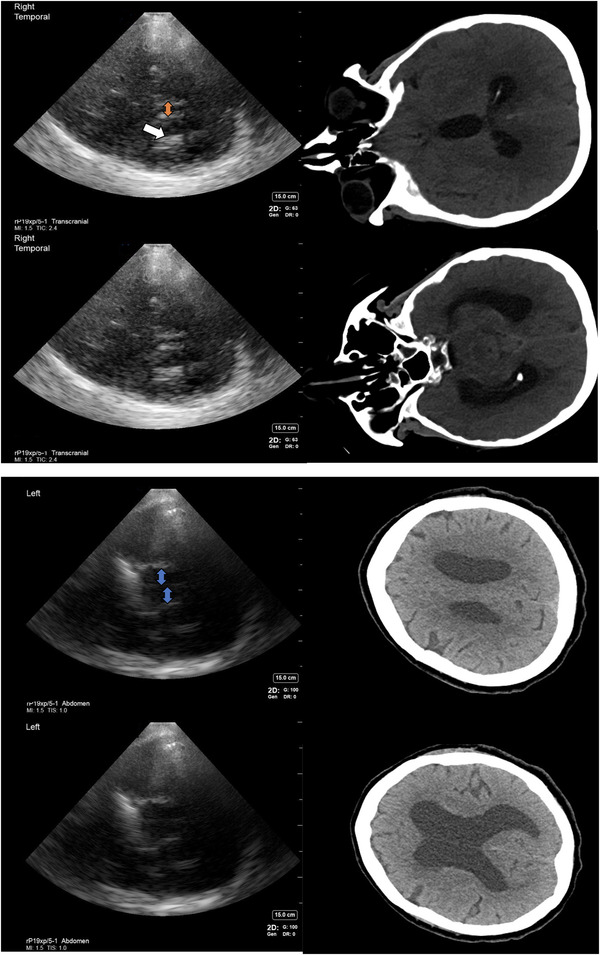
Background and purpose: Many studies have explored the possibility of using cranial ultrasound for discerning intracranial pathologies like tumors, hemorrhagic stroke, or subdural hemorrhage in clinical scenarios where computer tomography may not be accessible or feasible. The visualization of intracranial anatomy on B-mode ultrasound is challenging due to the presence of the skull that limits insonation to a few segments on the temporal bone that are thin enough to allow transcranial transmission of sound. Several artifacts are produced by hyperechoic signals inherent in brain and skull anatomy when images are created using temporal windows.

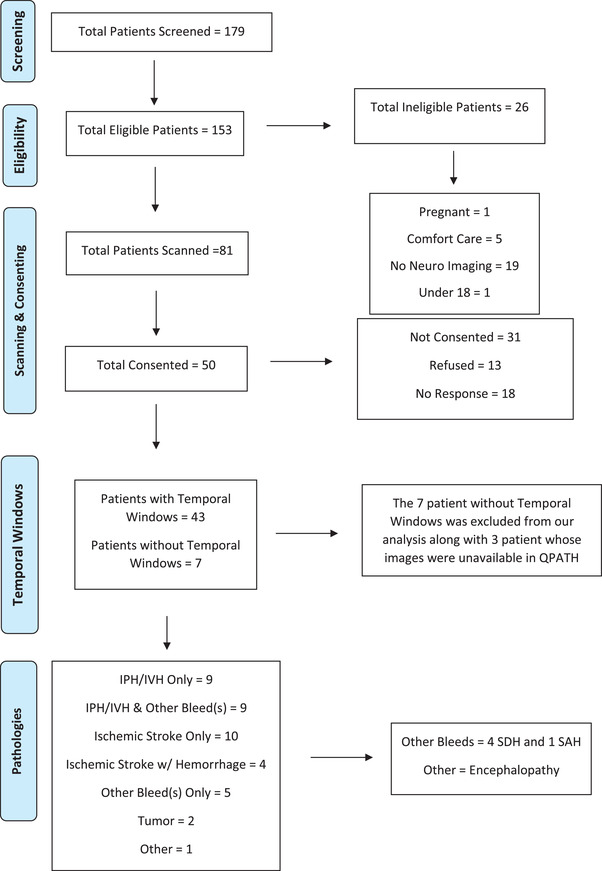
Methods: While the literature has investigated the accuracy of diagnosis of intracranial pathology with ultrasound, we lack a reference source for images acquired on cranial topography on B-mode ultrasound to illustrate the appearance of normal and abnormal structures of the brain and skull. Two investigators underwent hands-on training in Cranial point-of-care ultrasound (c-POCUS) and acquired multiple images from each patient to obtain the most in-depth images of brain to investigate all visible anatomical structures and pathology within 24 hours of any CT/MRI imaging done.

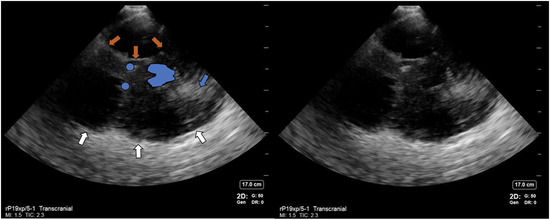
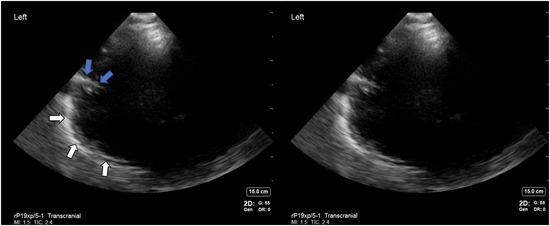
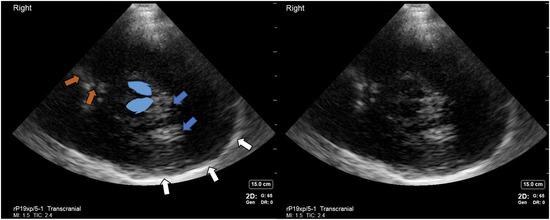
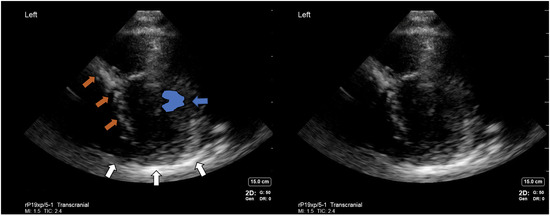
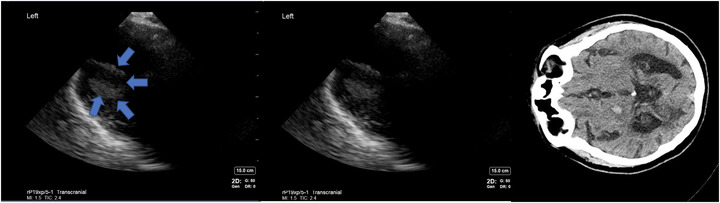
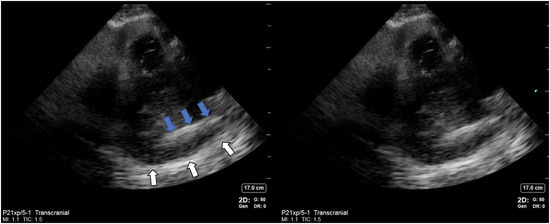
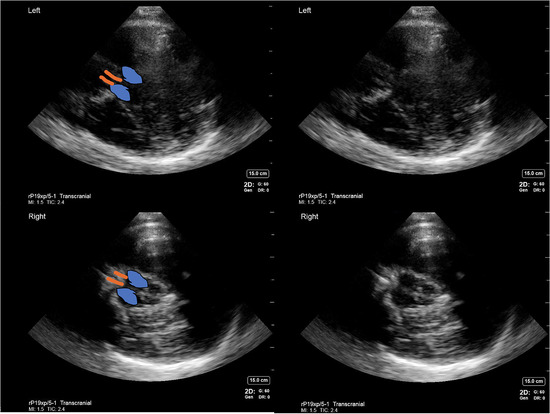
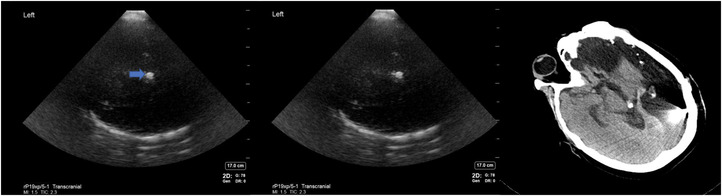
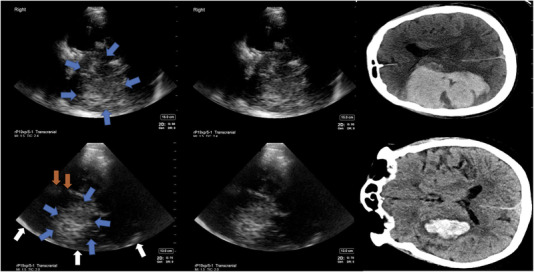
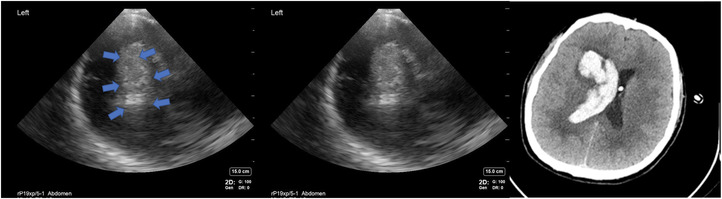
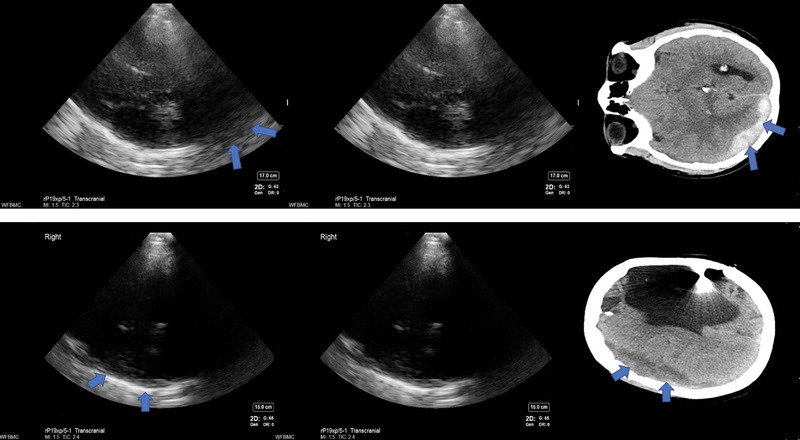
Results: Most reproducible structures visible on c-POCUS included bony parts and parenchymal structures. Transcranial and abdominal presets were equivalent in elucidating anatomical structures. Brain pathology like parenchymal hemorrhage, cerebral edema, and hydrocephalus were also visualized.

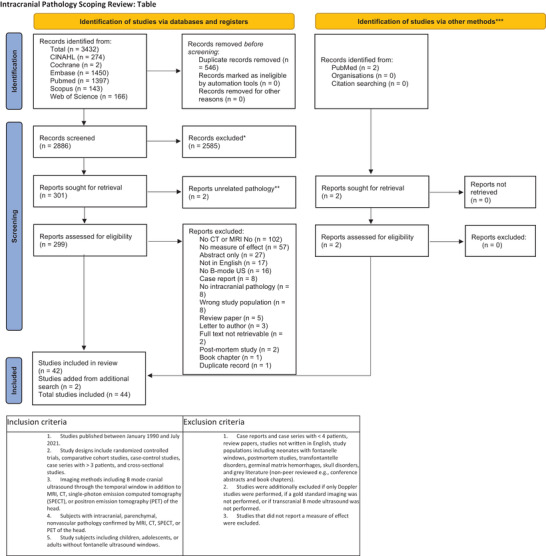
Conclusions: We present an illustrated anatomical atlas of cranial ultrasound B-mode images acquired in various pathologies in a critical care environment and compare our findings with published literature by performing a scoping review of literature on the subject.

Keywords: brain echography; cranial ultrasound; neuro-ultrasound; ultrasonography.


Figures

FIGURE 1
FIGURE 1
CUPIDICU flow diagram displaying the enrollment process. Screened patients from October 1, 2022 to May 12, 2022; paused enrollment between October 7, 2022 and October 18, 2022; November 28, 2021 and January 1, 2022; and March 15, 2022 and May 2, 2022, to work through consents, conduct data analysis, and review images (CUPIDICU, cranial ultrasound for point of care intracranial hemorrhage detection in patients in the intensive care unit; IVH, Intraventricular hemorrhage; IPH, intraparenchymal hemorrhage; SDH, subdural hemorrhage; SAH, subarachnoid hemorrhage).
FIGURE 2
FIGURE 2
PRISMA (Preferred Reporting Items for Systematic Reviews and Meta Analysis) diagram demonstrating the study selection process (n, number of studies; CINAHL, Cumulative Index to Nursing and Allied Health Literature; US, ultrasound)
FIGURE 3
FIGURE 3
Cranial ultrasound image showing opposite skull (white arrows), ipsilateral convex ridge produced by lesser wing of the sphenoid bone and petrous part of the temporal bone (orange arrows), midbrain (butterfly‐shaped blue structure), and clinoid processes (blue dots). Contralateral brain parenchyma is better visualized compared to ipsilateral parenchyma. Trailing bright signal below the midbrain with hyperechoic signals resembling signals produced by a hemorrhage (blue arrow)
FIGURE 4
FIGURE 4
Cranial ultrasound image showing opposite skull frontal bone (white arrows) and falx cerebri (blue arrows) in areas of frontal bone as hyperechoic structure
FIGURE 5
FIGURE 5
Cranial ultrasound image showing opposite skull (white arrows) and falx cerebri (orange arrows) in area of occipital bone as hyperechoic structure. The center of the cranium shows two bean‐shaped structures (blue) corresponding to the thalami. Trailing bright signal below the midbrain with hyperechoic signal resembling signals produced by a hemorrhage (blue arrows)
FIGURE 6
FIGURE 6
Cranial ultrasound image showing contralateral convex ridge produced by the greater wing of the sphenoid bone and petrous part of the temporal bone (orange arrows), midbrain (butterfly‐shaped structure) (blue arrow), and opposite skull (white arrows)
FIGURE 7
FIGURE 7
Cranial ultrasound image showing orbital fossa cavity (blue arrows)
FIGURE 8
FIGURE 8
Cranial ultrasound showing opposite skull (white arrows) and ridge (blue arrows) in the occipital bone marking the transverse venous sinus location
FIGURE 9
FIGURE 9
Cranial ultrasound image showing falx cerebri (orange arrows), opposite skull (white arrows) with midbrain (blue butterfly‐shaped structure), and cerebral aqueduct (orange dot). Contralateral brain parenchyma is better visualized compared to ipsilateral parenchyma. Basal cisterns: Ambient and quadrigeminal cisterns demonstrate hyperechoic signals relative to the adjacent midbrain (blue arrows).
FIGURE 10
FIGURE 10
B‐mode cranial ultrasound image showing no distinguishing features of ischemic stroke with normal appearance of architecture of the brain with attached CT showing changes consistent with ischemia. The opposite skull (white arrows) with midbrain (blue butterfly‐shaped structure) and cerebral aqueduct (orange dot) can be visualized.
FIGURE 11
FIGURE 11
Cranial ultrasound image showing lateral ventricles as Y‐shaped structure with choroid plexus visible (three orange square dots) with the opposite skull (white arrows)
FIGURE 12
FIGURE 12
Cranial ultrasound displaying normal appearance of third ventricle (orange lines) and bean‐shaped structures (blue) corresponding to the thalami
FIGURE 13
FIGURE 13
Cranial ultrasound image showing hyperechoic pineal gland (blue arrow) but no distinct appearance of encephalomalacia when compared with the corresponding CT head
FIGURE 14
FIGURE 14
Cranial ultrasound image showing intracerebral hemorrhage as region of increased echogenicity (blue arrows), opposite skull (white arrows), and falx cerebri (orange arrows) with the corresponding CT for comparison
FIGURE 15
FIGURE 15
Cranial ultrasound image showing intraventricular hemorrhage with intracerebral hemorrhage as region of increased echogenicity (blue arrows) with the corresponding CT for comparison
FIGURE 16
FIGURE 16
Cranial ultrasound image showing indistinct appearance of mixed‐density subdural hygroma and hemorrhage (blue arrows) compared with the corresponding CT head
FIGURE 17
FIGURE 17
Cranial ultrasound displaying thalamic tumor (blue arrows) that has similar appearance to hemorrhagic stroke (false positive) with corresponding CT for comparison
FIGURE 18
FIGURE 18
Cranial ultrasound image showing enlarged lateral ventricles in a patient with hydrocephalus with corresponding CT head. Dilated third ventricle (orange arrow) and choroid plexus visible inside the temporal horn of lateral ventricle (white arrow) can be seen. Dilated lateral ventricles (blue arrows) can be seen close to the vertex.

Similar articles

References

    1. Patel Y, D'Agostino R Jr, Brown P, et al. Exploratory study to assess feasibility of intracranial hemorrhage detection by point of care cranial ultrasound. Under Review Neurocritic Care 2022. - PMC - PubMed
    1. Sarwal A, Elder N. Point‐of‐care cranial ultrasound in a hemicraniectomy patient. Clin Pract Cases Emerg Med Nov 2018;2:375–7. - PMC - PubMed
    1. Alonso‐Canovas A, Lopez‐Sendon Moreno JL, Buisan J, et al. Does normal substantia nigra echogenicity make a difference in Parkinson's disease diagnosis? A real clinical practice follow‐up study. J Neurol 2018;265:2363–9. - PubMed
    1. Bor‐Seng‐Shu E, Pedroso JL, Felicio AC, et al. Substantia nigra echogenicity and imaging of striatal dopamine transporters in Parkinson's disease: a cross‐sectional study. Parkinsonism and Relat Disord 2014;20:477–81. - PubMed
    1. Iranzo A, Lomeña F, Stockner H, et al. Decreased striatal dopamine transporter uptake and substantia nigra hyperechogenicity as risk markers of synucleinopathy in patients with idiopathic rapid‐eye‐movement sleep behaviour disorder: a prospective study. Lancet Neurol 2010;9:1070–7. - PubMed

Publication types