. 2022 Aug 4:11:e79549.
doi: 10.7554/eLife.79549.

The evolution of a counter-defense mechanism in a virus constrains its host range

Affiliations

The evolution of a counter-defense mechanism in a virus constrains its host range

Sriram Srikant et al. Elife. .

Abstract

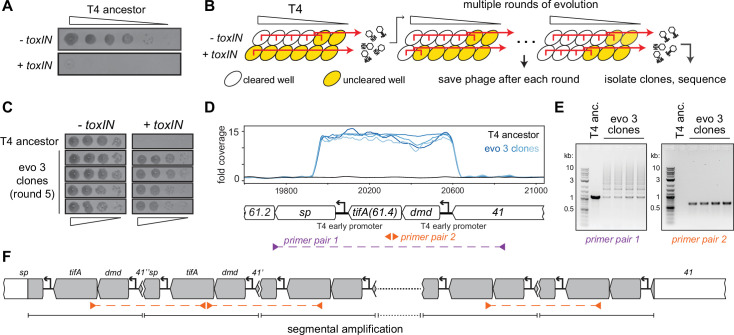
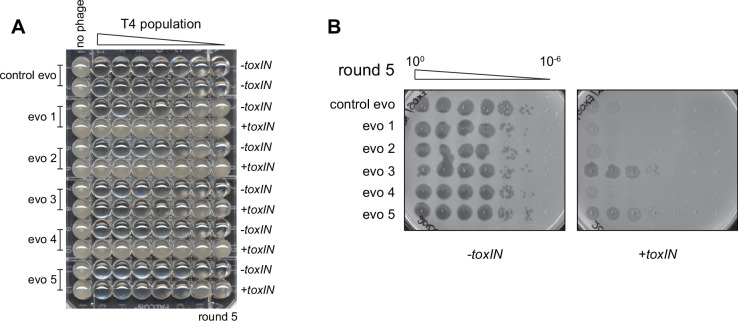
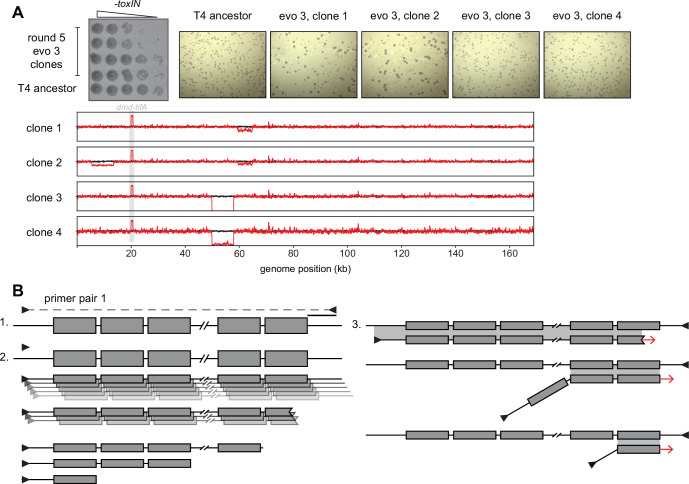
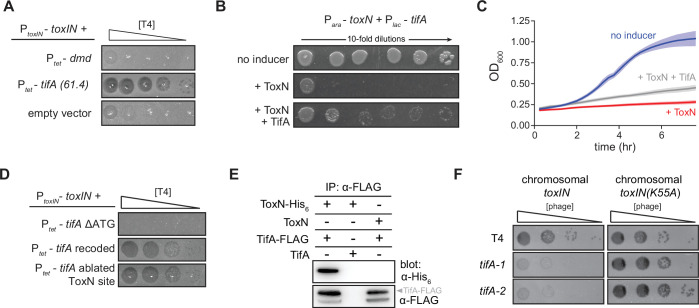
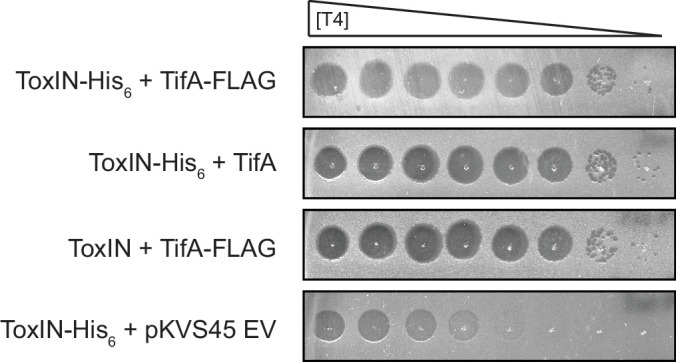
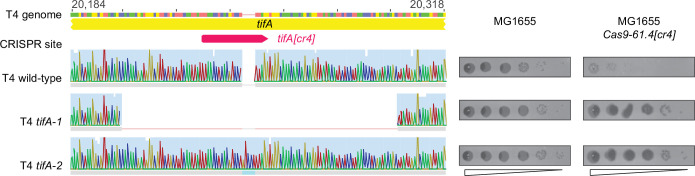
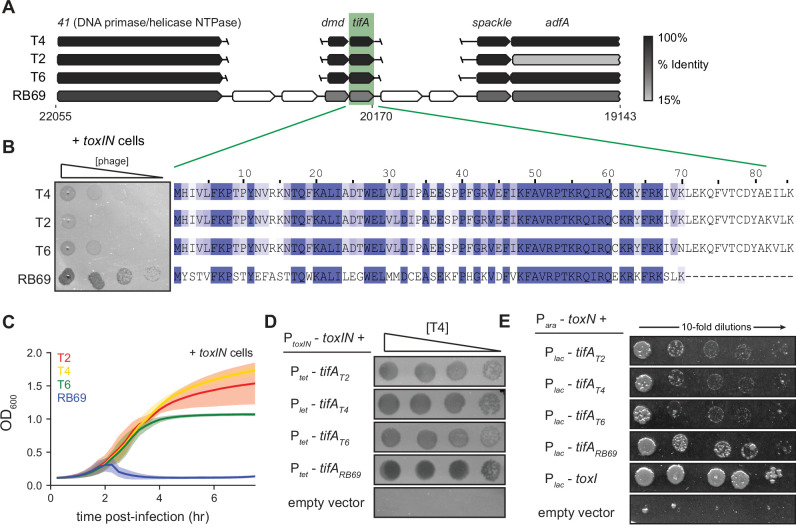
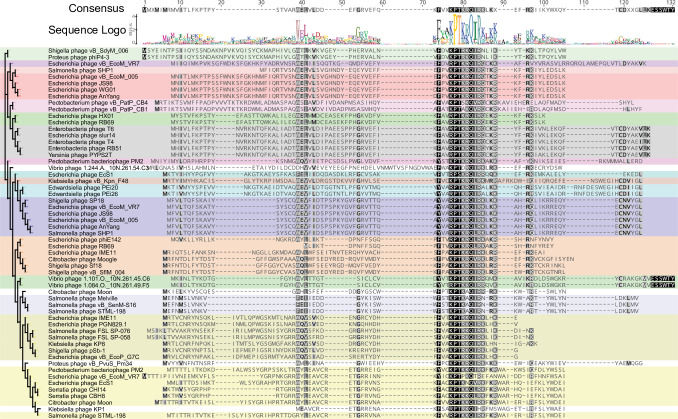
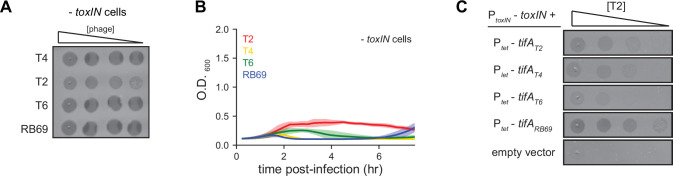
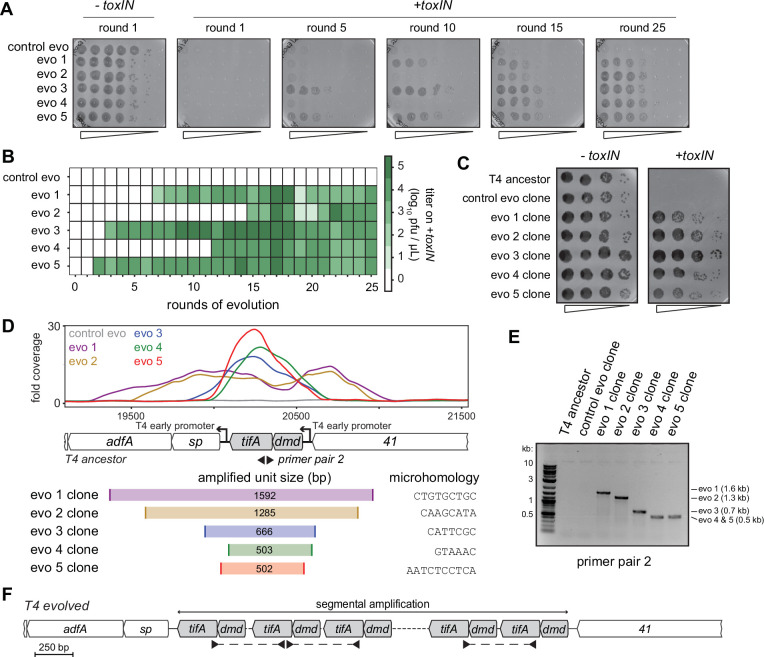
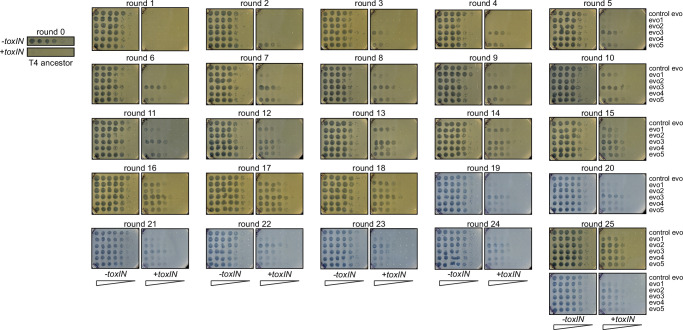
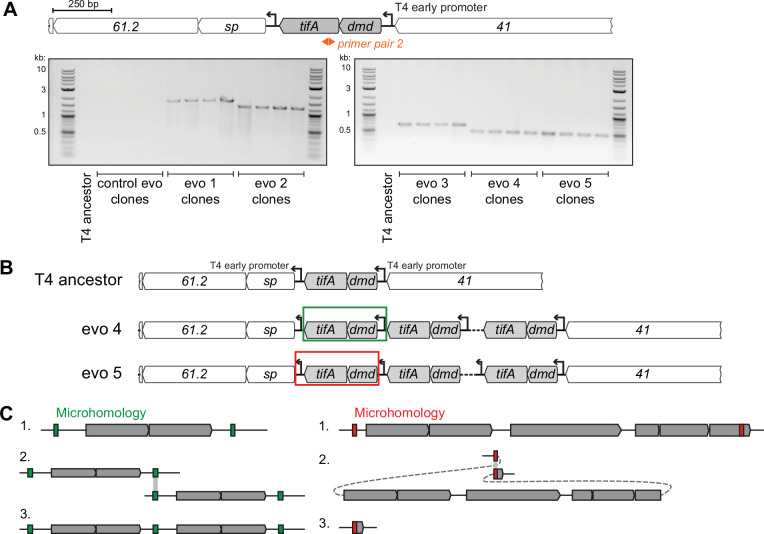
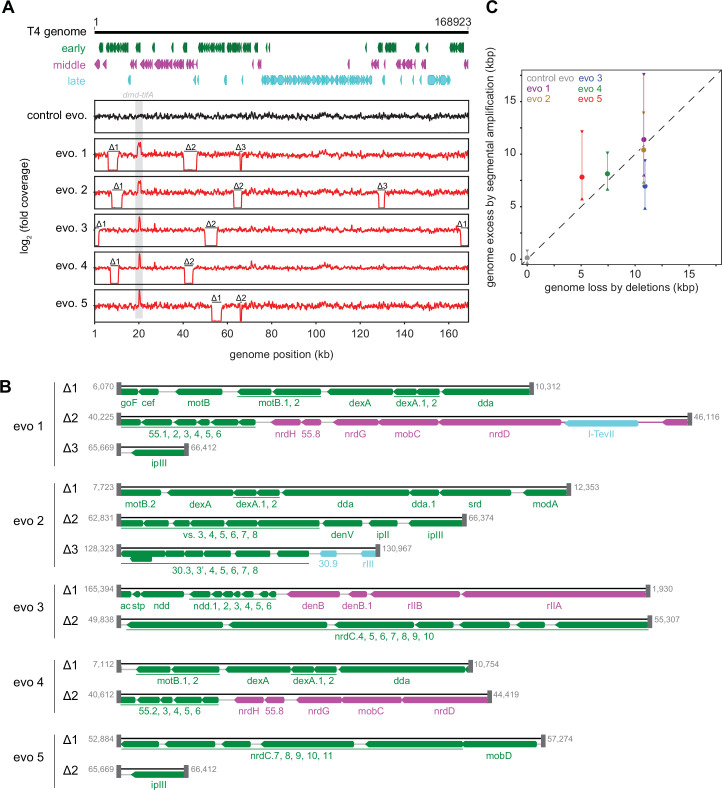
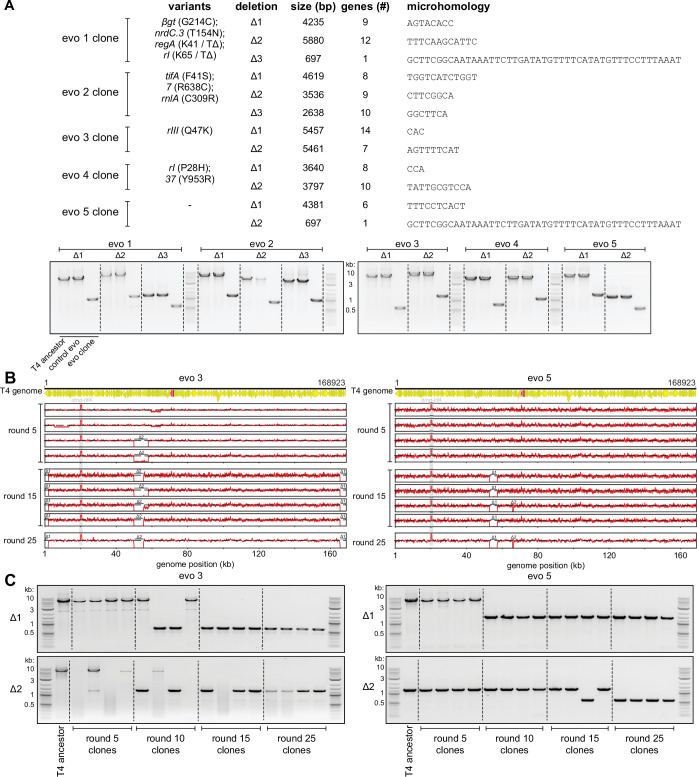
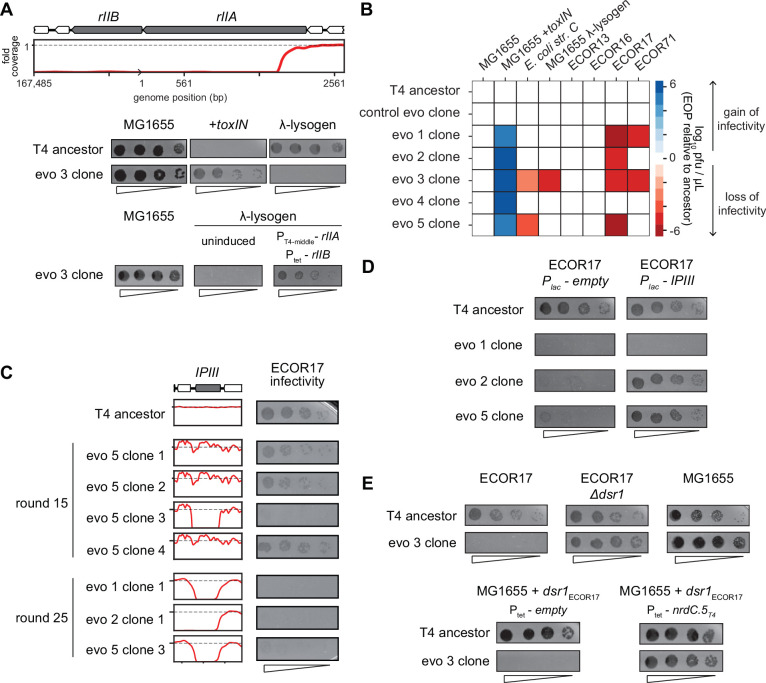
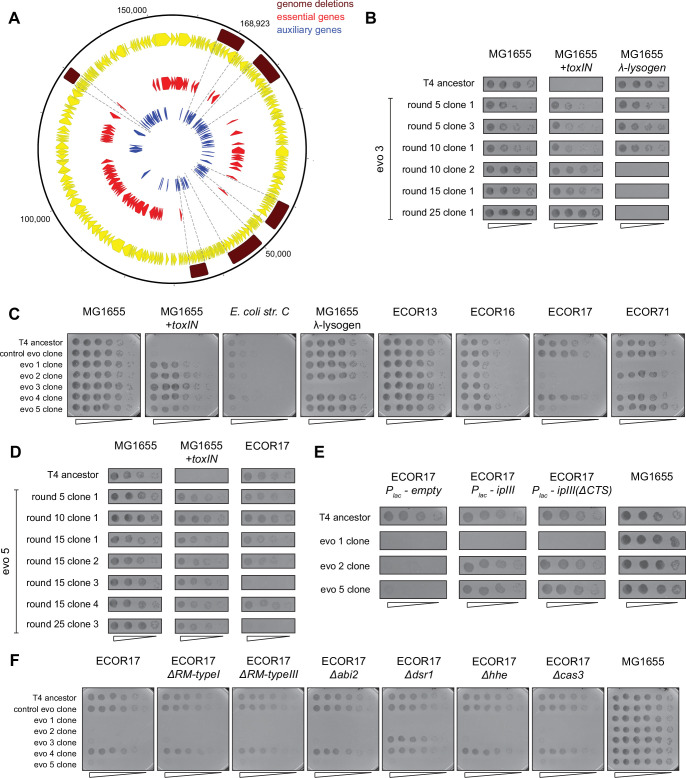
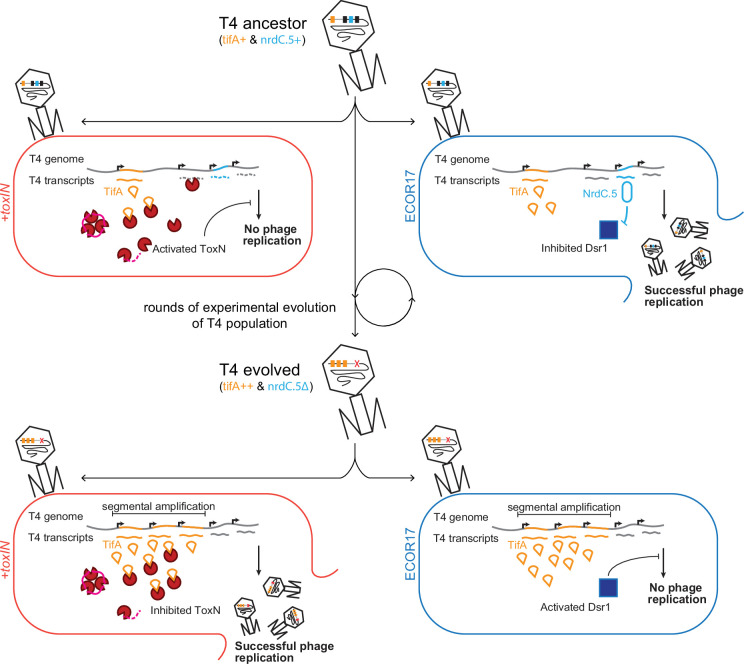
Bacteria use diverse immunity mechanisms to defend themselves against their viral predators, bacteriophages. In turn, phages can acquire counter-defense systems, but it remains unclear how such mechanisms arise and what factors constrain viral evolution. Here, we experimentally evolved T4 phage to overcome a phage-defensive toxin-antitoxin system, toxIN, in Escherichia coli. Through recombination, T4 rapidly acquires segmental amplifications of a previously uncharacterized gene, now named tifA, encoding an inhibitor of the toxin, ToxN. These amplifications subsequently drive large deletions elsewhere in T4's genome to maintain a genome size compatible with capsid packaging. The deleted regions include accessory genes that help T4 overcome defense systems in alternative hosts. Thus, our results reveal a trade-off in viral evolution; the emergence of one counter-defense mechanism can lead to loss of other such mechanisms, thereby constraining host range. We propose that the accessory genomes of viruses reflect the integrated evolutionary history of the hosts they infected.

Keywords: E. coli; T4 phage; anti-phage defense; evolutionary biology; infectious disease; microbiology; phage counter-defense.


Conflict of interest statement

SS, CG No competing interests declared, ML Reviewing editor, eLife

Figures

Figure 1.
Figure 1.. T4 rapidly evolves to overcome toxIN by segmental amplification of the dmd-tifA(61.4) locus.
(A) T4 is restricted by +toxIN E. coli. Serial dilution plaquing assay of T4 spotted on -toxIN and +toxIN cells. (B) Phage evolution protocol to select for T4 that overcomes toxIN-mediated defense. Serial dilutions of T4 are used to infect +toxIN and -toxIN cells at multiple multiplicities of infection (MOIs). The ancestral T4 only clears wells containing -toxIN cells. Phage from all cleared wells, and the last uncleared well, are pooled and used to inoculate the next round of evolution. As the population evolves, it can also infect and clear +toxIN cells. Phage populations from each round are saved to maintain a fossil record; individual clones are isolated on +toxIN cells and sequenced to identify mutations, leading to toxIN resistance. (C) Comparison of plaquing efficiency for ancestral T4 and T4 isolates from one of the evolved populations after five rounds on -toxIN and +toxIN cells. (D) Read coverage at the dmd-tifA(61.4) locus following genome sequencing of multiple clones from one of the evolved populations. Primer pairs used in panel (E) to interrogate the segmental amplification are shown below the locus map. (E) PCR products using the primer pairs indicated in panel (D) for ancestral T4 and evolved clones. (F) Schematic of segmental amplification of dmd-tifA locus in evo 3 clones highlighting binding of primer pair 2 producing a cross-repeat product.
Figure 1—figure supplement 1.
Figure 1—figure supplement 1.. Experimental evolution of T4 to overcome toxIN.
(A) Experimental evolutions were performed in 96-well plates. Pairs of rows were used for each evolving population and contain -toxIN or +toxIN cells in consecutive rows except for the control evolution, which has -toxIN cells in both rows. Plates were imaged after overnight growth with clearing in wells indicating successful phage replication. The plate shown corresponds to round 5. (B) Serial dilutions of evolving populations spotted on -toxIN (left) and +toxIN (right) cells after five rounds of evolution shown as an example of how population size and ability to infect +toxIN cells were monitored.
Figure 1—figure supplement 2.
Figure 1—figure supplement 2.. Segmental amplifications and deletions arising in evolved T4 clones.
(A) Serial dilutions (top left, replicated from Figure 1C) and plaque assays (top right) of plaque clone isolates 1 and 2 from evo 3 after round 5 show dramatic plaque size variability compared to the T4 ancestor. (Below) Fold coverage of evolved clones (red lines) compared to T4 ancestor (black line) highlighting genomic differences across clones and deletions that arise in subpopulations during amplification from a single plaque. (B) Schematic representing generation of laddered products from PCR amplification of template with tandem repeats (step 1). Polymerase extension from an annealed primer generates a complementary strand to the template of length depending on the processivity of the polymerase. With purified polymerases and sufficient extension time, most products cover a large part of the repeated region, but some events generate smaller fragments containing fewer repeats (step 2). These smaller fragments can serve as primers in subsequent rounds of amplification by efficiently annealing to the template, but at mismatched repeats (step 3). This generates all sizes of products differing in the number of repeats with flanking primer annealing sites.
Figure 2.
Figure 2.. TifA (gp61.4) inhibits ToxN toxicity.
(A) Serial dilution plaquing assay of T4 ancestor spotted on +toxIN cells also harboring a plasmid containing dmd or tifA(61.4), or an empty plasmid. Anhydrotetracycline was added to the plates to induce dmd or tifA. (B, C) Representative plating assay (B) and growth curves (C) showing TifA rescue of ToxN. Plasmids harboring toxN and tifA under arabinose- and IPTG-inducible promoters, respectively, were transformed into E. coli MG1655. ToxN, ToxN, and TifA, or neither were induced as indicated. For growth curves in (C), data are the average of three technical replicates each of four biological replicates, with shaded areas indicating standard deviation. (D) Serial dilution plaquing assay of T4 ancestor spotted on +toxIN cells containing plasmids expressing the tifA variants indicated. (E) Western blot of ToxN-His6 and TifA-FLAG (or untagged controls) following an anti-FLAG coimmunoprecipitation of T4-infected cells co-producing ToxN and TifA. The arrowhead highlights the band with a molecular weight matching that expected for TifA-FLAG. The identity of the band below is unknown but may represent a processed or truncated portion of TifA-FLAG. (F) Serial dilution plaquing assay of T4 ancestor and two tifA mutants on E. coli MG1655 with chromosomally encoded toxIN or toxIN(K55A), which harbors an active-site mutation in ToxN.
Figure 2—figure supplement 1.
Figure 2—figure supplement 1.. ToxN-His6 and TifA-FLAG are functional in the context of T4 infection.
Serial dilutions of T4 ancestor on lawns of E. coli MG1655 containing toxIN or toxI-toxN-His6 and co-expressing tifA or tifA-FLAG, or carrying an empty vector, as indicated.
Figure 2—figure supplement 2.
Figure 2—figure supplement 2.. Generation of T4 clones with mutations in tifA.
T4 mutant clones with mutations in tifA. (Left) Sanger sequencing chromatograms of tifA in T4(bgt(II/5-6Δ)), tifA-1 (98 bp deletion), and tifA-2 (5 bp insertion). (Right) Serial dilutions of T4(bgt(II/5-6Δ)) and tifA mutants on MG1655 and MG1655 expressing Cas9 with the tifA[cr4] guide-RNA shown above the chromatograms.
Figure 3.
Figure 3.. RB69 TifA is a more potent inhibitor of ToxN than the T4 homolog.
(A) Schematic of syntenic region containing tifA in closely related T-even phages. Homologous genes are aligned vertically and colored by % identity to the homolog in T4. (B) (Left) Serial dilution plaquing assays of T4, T2, T6, RB69 on +toxIN cells. (Right) Multiple-sequence alignment of TifA homologs from T4, T2, T6, and RB69. (C) Growth curves following infection of +toxIN cells with T4, T2, T6, or RB69 phage, each at a multiplicity of infection (MOI) of 10–3. Data are the average of three biological replicates, with shaded areas indicating standard deviation. (D) Serial dilutions of T4 ancestor spotted on +toxIN cells expressing tifA homologs from T2, T4, T6, RB69, or harboring an empty vector. (E) Serial dilutions of E. coli cells expressing toxN and the tifA homolog from T2, T4, T6, or RB69, toxI, or alone.
Figure 3—figure supplement 1.
Figure 3—figure supplement 1.. Homologs of tifA are found in other phage genomes.
Multiple-sequence alignment of 57 TifA proteins found across sequenced phage genomes. TifA homologs have a conserved central region (highlighted by darker shades of gray) with varied N- and C-terminal regions. Groups of similar sequences, as judged by the tree (left), are shaded with the same color. Sequences were identified by jackhmmer, aligned by MUSCLE, and a pseudo-maximum likelihood tree built with FastTree.
Figure 3—figure supplement 2.
Figure 3—figure supplement 2.. TifA homologs from T-even phages inhibit ToxN, with TifA from RB69 providing the strongest inhibition.
(A) Serial dilution plaquing assays of T4, T2, T6, and RB69 from Figure 3B on -toxIN cells. (B) Growth curves following infection of -toxIN cells with T4, T2, T6, or RB69, each at a multiplicity of infection (MOI) of 10–3. Data are the average of three biological replicates, with shaded areas indicating standard deviation. (C) Serial dilutions of T2 spotted on +toxIN cells expressing tifA homologs from T2, T4, T6, RB69, or harboring an empty vector.
Figure 4.
Figure 4.. Unique recombination events generate dmd-tifA amplifications in replicate T4 evolution experiments.
(A) Serial dilutions of evolving populations (one control evolution and five replicate populations) after rounds 1, 5, 10, 15, and 25 spotted on +toxIN cells. (B) Heat map summarizing the titer of toxIN-resistant T4 as they arise in the independent evolving populations. Titer was estimated by serial dilutions of evolving populations spotted on +toxIN cells (as in panel A). (C) Serial dilutions of isolated clones from evolved populations spotted on -toxIN and +toxIN cells. (D) Fold coverage from genome sequencing of evolved T4 isolates around dmd and tifA. (E) PCR with divergent primers, indicated in panel (D), used to map the size of the repeated unit in the tandem segmental amplifications. (F) Schematic of segmental amplification of dmd-tifA locus in evo clones highlighting binding of primer pair 2 producing a cross-repeat product that depends on the specific location of the microhomology.
Figure 4—figure supplement 1.
Figure 4—figure supplement 1.. Titers of evolving T4 populations remain roughly constant over 25 rounds of evolution.
Population size of replicate evolving T4 populations is determined by the titer estimated on -toxIN lawns and remains roughly constant (105–106 pfu/µL) over 25 rounds. Serial dilutions of evolving populations (control evo, evo 1 to evo 5, top to bottom in each image) spotted on -toxIN and +toxIN lawns. These data were quantified to generate the heat map in Figure 4B; round 0 data replicated from Figure 1A.
Figure 4—figure supplement 2.
Figure 4—figure supplement 2.. T4 replicate evolutions overcome toxIN using similar segmental amplifications of tifA.
(A) PCR products with divergent primers (primer pair 2, used similar to Figure 1) confirm the presence of contiguous repeats in clones isolated from each evolving population (but not in clones from control evo or the T4 ancestor), with different sizes confirming unique repeating units in each evolving population’s amplification. (B) Schematic of repeats in evolved clones that link either the T4 early promoter upstream of dmd-tifA (evo 4, middle) or the T4 early promoter downstream of dmd-tifA (evo 5, bottom) to ensure expression of operon in all repeats. (C) Schematics of recombination events that can lead to segmental amplifications (left) or genome deletions (right). T4 is known to rely on recombination during genome replication at late times and is also used in the concatenation of genomes to enable processive genome packaging. Recombination between short identical sequence repeats, or regions of microhomology (green or red), across or within genome molecules can generate a segmental copy or loss of the intervening region, respectively.
Figure 5.
Figure 5.. Segmental amplifications in the T4 genome are compensated by large genomic deletions.
(A) Fold coverage calculated from genome sequencing of clones from replicate evolved populations plotted across the entire genome, showing regions of increased coverage (dmd-tifA locus) and large genomic deletions manifesting as a loss of coverage. Genes are colored based on their regulation during the phage life cycle; early (green), middle (magenta), and late (cyan). (B) Summary of deleted regions in each evolved clone showing the flanking regions of microhomology (gray rectangles). (C) Scatter plot of increase in genome size estimated from fold coverage across dmd-tifA repeat region (circle represents median and triangles represent interquartile range of coverage) against the size of genome deletion in clones from each population.
Figure 5—figure supplement 1.
Figure 5—figure supplement 1.. Genome deletions fix over the course of the evolution to compensate for amplifications at the dmd-tifA locus.
(A) (Top) Summary of mutations and deletions identified by genome sequencing of isolated clones from each population after 25 rounds of evolution. Boundaries of the deletion, which are short regions of microhomology, are listed along with the deleted genes. (Bottom) PCR with primers flanking each of the deleted regions, to confirm smaller products generated from the corresponding evolved clone compared to T4 ancestor (or clone from control evo). (B) Fold coverage calculated from genome sequencing of clones isolated from populations 3 and 5 after various rounds of evolution (5, 15, 25) to follow amplifications and deletions that arise in evo 3 (left) and evo 5 (right). (C) PCR with primers flanking the deleted regions of evolving populations 3 (left) and 5 (right) performed on evolved clones isolated from rounds of evolution (5, 10, 15, 25) to trace genome configurations over evolutionary time.
Figure 6.
Figure 6.. T4 genes lost during evolution are essential for replication in alternate hosts.
(A) (Top) Fold coverage map for rIIA and rIIB locus in a clone from population 3 (evo 3). (Bottom) Serial dilutions of the T4 ancestor and evo 3 clone 1 on the strains indicated. (B) Heat map quantifying the relative efficiency of plaquing (EOP) of each evolved clone compared to the T4 ancestor for the indicated E. coli strains evaluated as the average of three biological replicates. (C) Fold coverage maps for the IPIII gene in the indicated clones of T4 from evolved populations evo 1, 2, and 5, with the corresponding serial dilutions of each clone on ECOR17. (D) Serial dilutions of evolved isolates with IPIII deletions on ECOR17 and ECOR17 +IPIII cells. (E) (Top) Serial dilutions of T4 ancestor and evo 3 clone 1 on ECOR17, ECOR17 Δdsr1, and MG1655 lawns. (Bottom) Serial dilutions of T4 ancestor and evo 3 clone 1 on MG1655 with plasmid-borne dsr1ECOR17 also harboring a plasmid expressing nrdC.5T4 or empty vector.
Figure 6—figure supplement 1.
Figure 6—figure supplement 1.. Evolved clones of T4 fix genomic deletions that contain genes essential for infecting alternate hosts.
(A) Genome map of T4 with all annotated T4 genes (yellow), highlighting essential (red) and auxiliary (blue) genes. Genome deletions identified in evolved populations do not contain any essential genes. (B) Serial dilutions of T4 evolved clones isolated from evo 3 after various rounds of evolution (5, 10, 15, 25) spotted on MG1655,+toxIN, and λ-lysogen lawns. (C) Serial dilutions of T4 evolved clones (from control evo and evo 1 to evo 5) after round 25 and T4 ancestor spotted on E. coli strains sensitive to T4 ancestor. These data (performed in triplicate) were quantified to generate the heat map in Figure 6A. (D) Serial dilutions of T4 evolved clones isolated from evo 5 after various rounds of evolution (5, 10, 15, 25) spotted on MG1655,+toxIN, and ECOR17 lawns. (E) Serial dilutions of T4 evolved clones and ancestor spotted on ECOR17, ECOR17 expressing IPIII, ECOR17 expressing IPIII(ΔCTS) (mutant that can no longer be packaged into new virions) and MG1655 lawns (data from same experiment as Figure 6D). (F) Serial dilutions of T4 evolved clones (from control evo, evo 1–5) after round 25 and T4 ancestor spotted on lawns of ECOR17 with deletions of computationally annotated phage defense systems (RM type I, RM type III, Abi2, Dsr1, Hhe, CRISPR-Cas type I).
Figure 7.
Figure 7.. Model of T4 evolving to overcome toxIN by genomic variation affecting host range.
The genome of T4 contains a number of accessory genes (tifA, nrdC.5, etc.) that enable infection of hosts by overcoming hosts defenses (toxIN, dsr1, etc.). T4 ancestor is unable to infect +toxIN cells due to inability to inhibit the action of ToxN but can infect an alternate host (ECOR17) using nrdC.5 to overcome the bacterial defense gene dsr1. Experimental evolution to infect +toxIN cells produce T4 evolved clones that have segmental amplifications of the tifA locus and compensatory deletions of nonessential genes like accessory genes needed to infect alternate hosts. A T4 evolved clone can thus infect +toxIN cells by having enough TifA to inhibit ToxN, but has lost nrdC.5 in a deletion, and thus lost the ability to infect ECOR17.

Similar articles

Cited by

References

    1. Anderson RP, Roth JR. Tandem genetic duplications in phage and bacteria. Annual Review of Microbiology. 1977;31:473–505. doi: 10.1146/annurev.mi.31.100177.002353. - DOI - PubMed
    1. Anderson P, Roth J. Spontaneous tandem genetic duplications in Salmonella typhimurium arise by unequal recombination between rRNA (rrn) cistrons. PNAS. 1981;78:3113–3117. doi: 10.1073/pnas.78.5.3113. - DOI - PMC - PubMed
    1. Andersson DI, Slechta ES, Roth JR. Evidence that gene amplification underlies adaptive mutability of the bacterial lac operon. Science. 1998;282:1133–1135. doi: 10.1126/science.282.5391.1133. - DOI - PubMed
    1. Appelmans R. Le dosage du bactériophage. Compt Rend Soc Biol. 1921;85:701
    1. Bair C, Black LW. Exclusion of glucosyl-hydroxymethylcytosine DNA containing bacteriocontaining bacteriophages. Journal of Molecular Biology. 2007;366:779–789. doi: 10.1016/j.jmb.2006.11.049. - DOI - PMC - PubMed

Publication types