. 2022 Aug 31;10(4):e0044622.
doi: 10.1128/spectrum.00446-22. Epub 2022 Aug 4.

Ruminal Microbiota Determines the High-Fiber Utilization of Ruminants: Evidence from the Ruminal Microbiota Transplant

Affiliations

Ruminal Microbiota Determines the High-Fiber Utilization of Ruminants: Evidence from the Ruminal Microbiota Transplant

Xiaodong Chen et al. Microbiol Spectr. .

Abstract

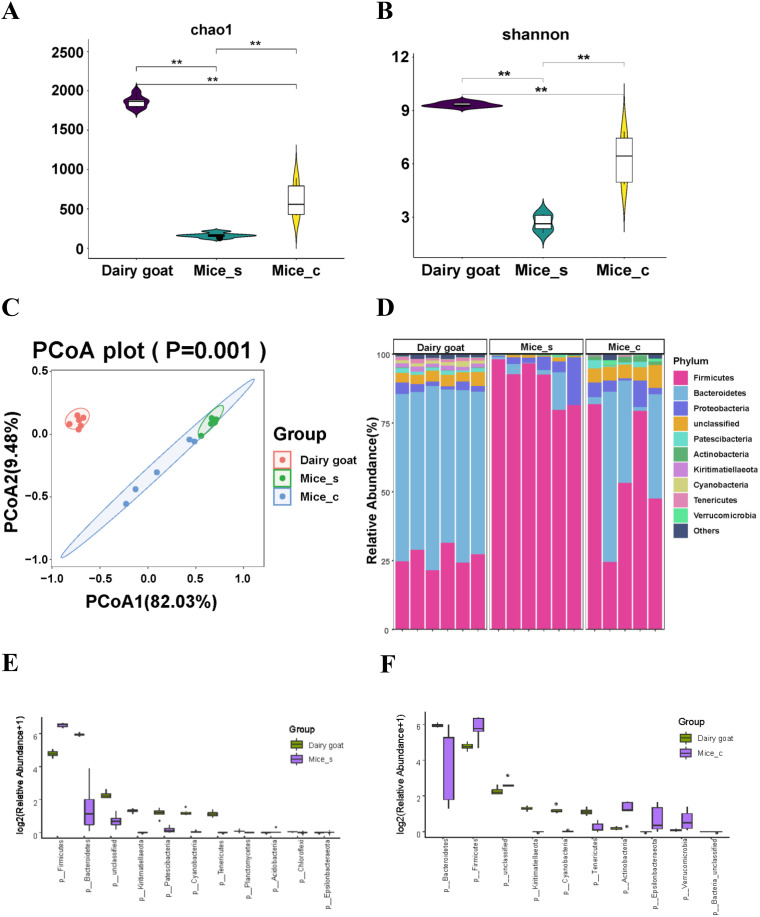
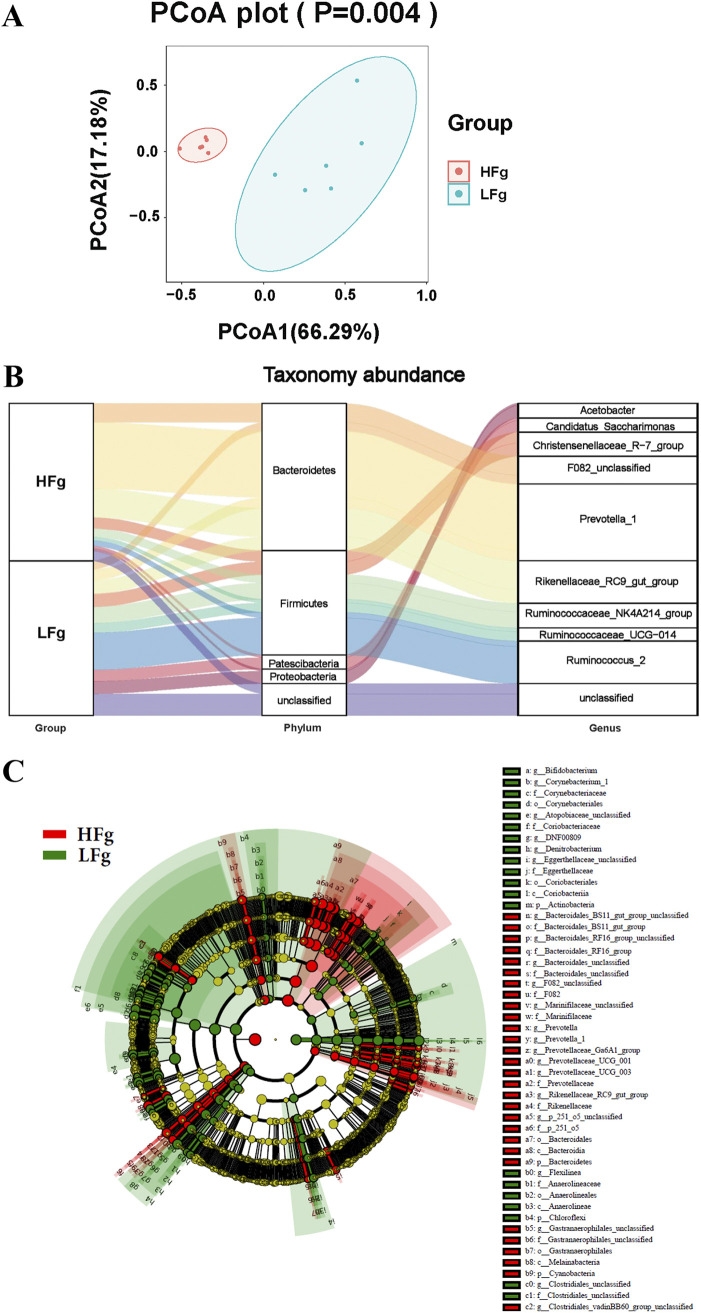
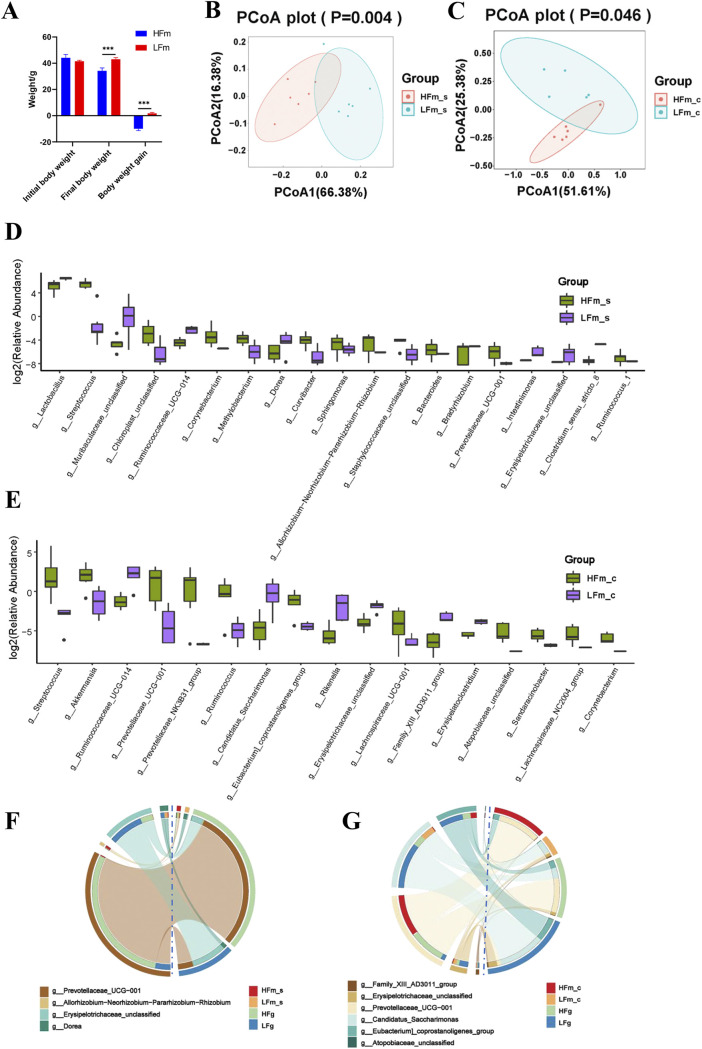
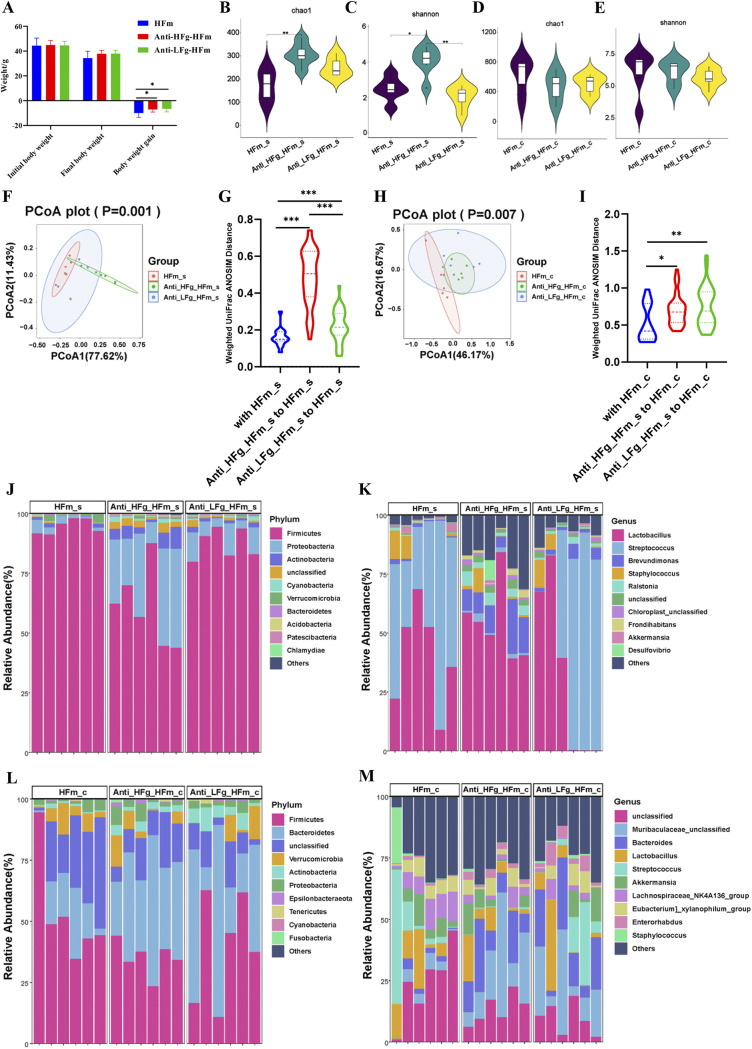
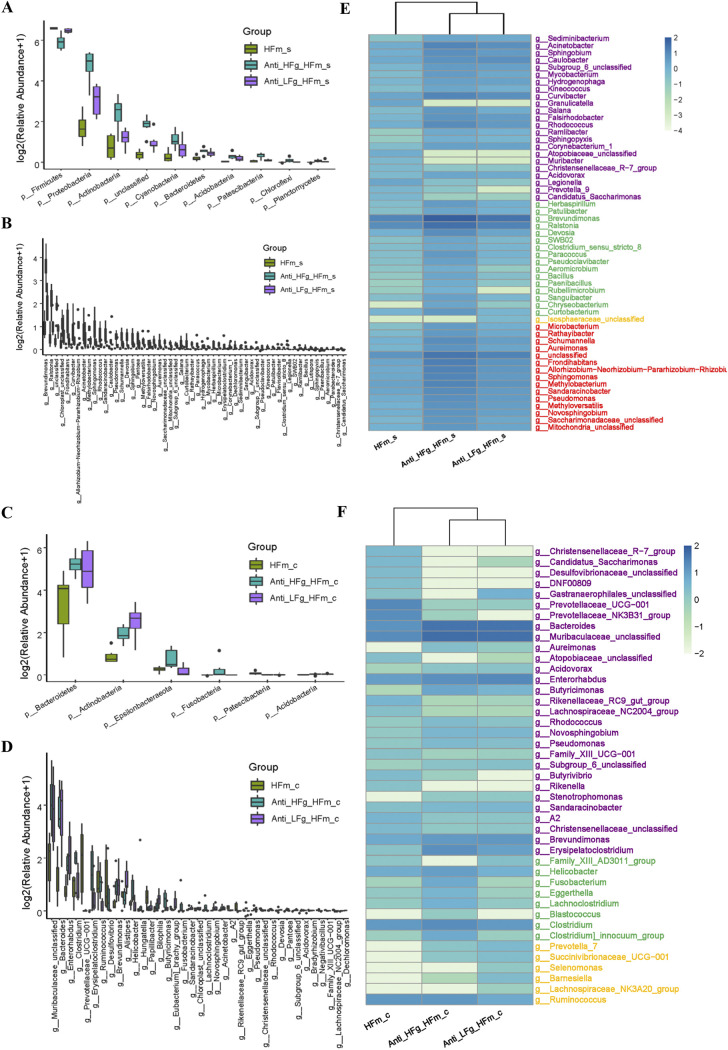
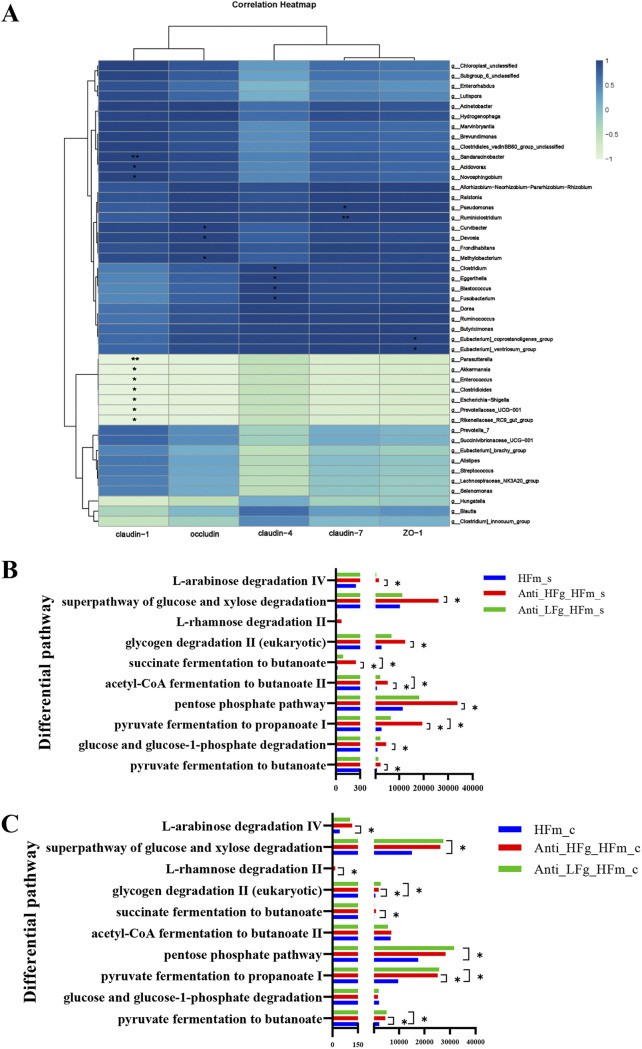
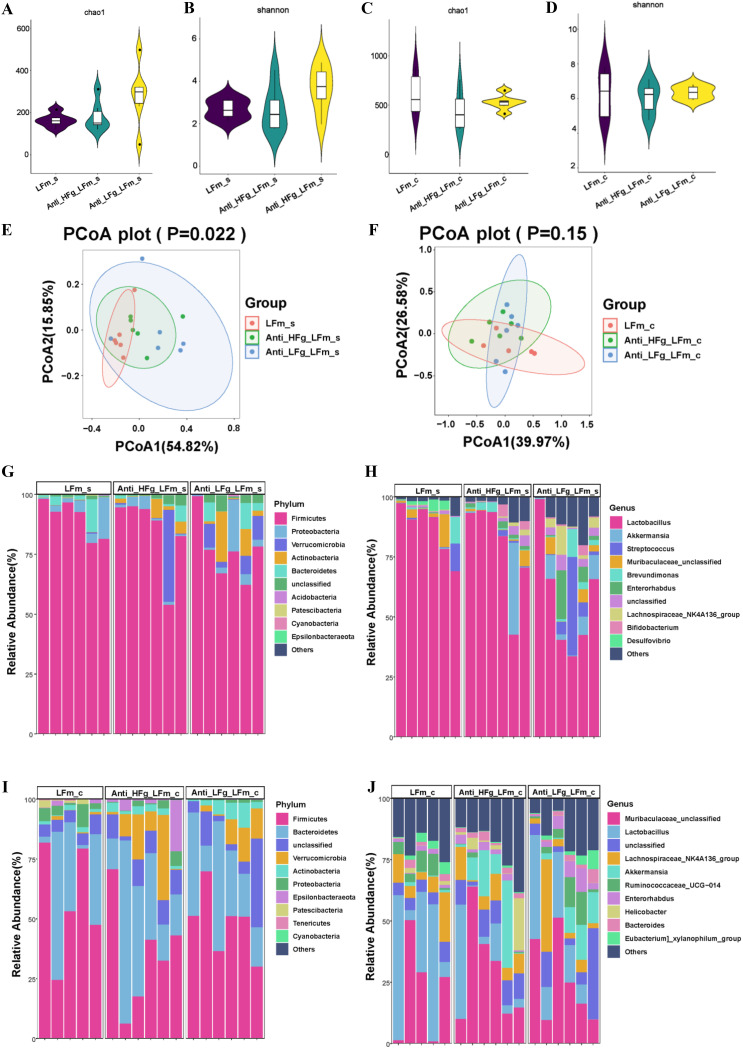
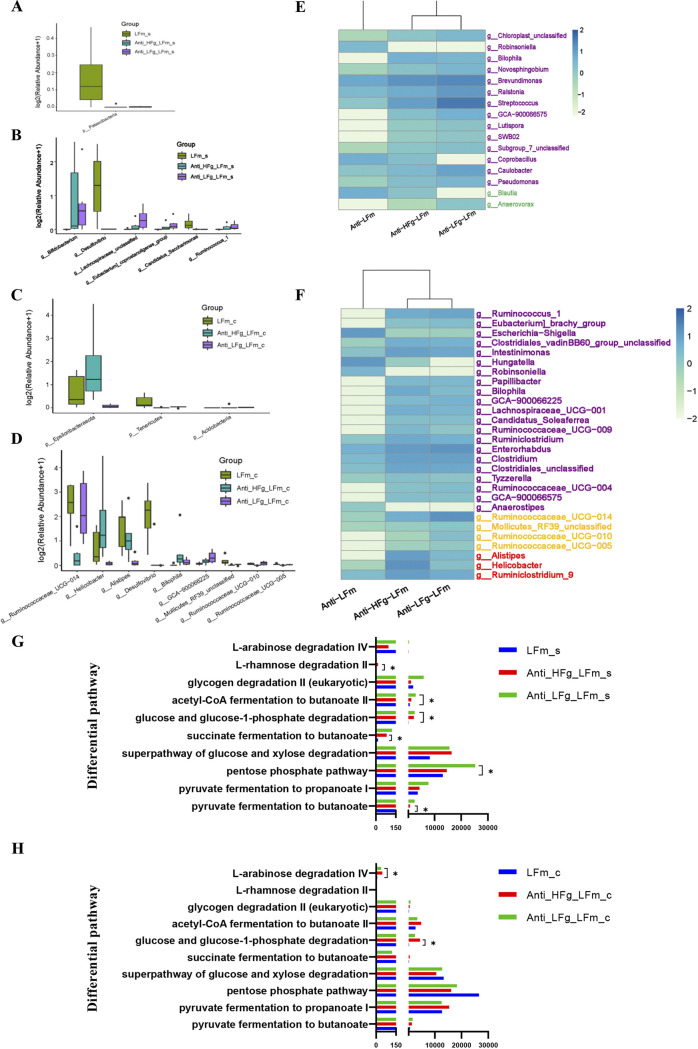
The rumen, which contains a series of prokaryotes and eukaryotes with high abundance, determines the high ability to degrade complex carbohydrates in ruminants. Using 16S rRNA gene sequencing, we compared the ruminal microbiota of dairy goats with that in the foregut and colon of mice and found more Bacteroides identified in the rumen, which helps ruminants to utilize plant-derived polysaccharides, cellulose, and other structural carbohydrates. Furthermore, high-fiber diets did not significantly increase intestinal fiber-degrading bacteria in mice, but did produce higher levels of ruminal fiber-degrading bacteria in dairy goats. Through rumen microbe transplantation (RMT), we found that rumen-derived fiber-degrading bacteria can colonize the intestines of mice to exert their fiber-degrading function, but their colonization efficiency is affected by diet. Additionally, the colonization of these fiber-degrading bacteria in the colon may involve higher content of butyrate in the colon, protecting the colonic epithelial barrier and promoting energy metabolism. Overall, the fiber degradation function of rumen bacteria through RMT was verified, and our results provide new insights into isolating the functional and beneficial fiber-degrading bacteria in the rumen, providing a theoretical basis for the role of dietary fiber in intestinal health. IMPORTANCE Ruminants have a powerful progastric digestive system that converts structural carbohydrates into nutrients useful to humans. It is well known that this phenomenon is due to the fact that the rumen of ruminants is a natural microbial fermenter, which can ferment structural carbohydrates such as cellulose and hemicellulose and transform them into volatile fatty acids to supply energy for host. However, monogastric animals have an inherent disadvantage in utilizing fiber, so screening rumen-derived fiber-degrading bacteria as a fermentation strain for biological feed is needed in an attempt at improving the fiber digestibility of monogastric animals. In this study, a ruminal microbiota transplant experiment from goats to mice proves that ruminal microbiota could serve as a key factor in utilization of high-fiber diets and provides a new perspective for the development of probiotics with fiber degradation function from the rumen and the importance of the use of prebiotics during the intake of probiotics.

Keywords: dairy goats; fiber-degrading bacteria; high-fiber diet; mice; rumen microbe transplantation.


Conflict of interest statement

The authors declare no conflict of interest.

Figures

FIG 1
FIG 1
Comparison between the ruminal microbiota of dairy goats and microbiota of the small intestine and colon in mice. (A and B) Chao1 index (A) and Shannon index (B) comparison among the ruminal microbiota from goats and the small intestinal microbiota and colonic microbiomes from mice. The data were statistically analyzed using the Kruskal-Wallis test with Dunn's post hoc test. (C) Principal-coordinate analysis (PCoA) on rumen microbiota from dairy goats and small intestinal microbiomes and colonic microbiota from mice. The data were statistically analyzed based on ANOSIM. (D) Differences in the relative abundance of bacterial phylum levels among the rumen microbiota from goats and the small intestinal microbiota and colonic microbiota from mice; (E and F) differential bacteria at the phylum level (P < 0.05) between the rumen microbiota from goats and the small intestinal microbiota from mice (E) and the rumen microbiomes from goat and the colonic microbiomes from mice (F). The Mann-Whitney U test was used to identify significantly different bacteria. All bacteria listed here were significantly different, with P values of <0.05 between the two groups. All data are expressed as means with standard deviations.
FIG 2
FIG 2
Effect of high- and low-fiber diets on ruminal microbiota of dairy goats. (A) Principal-coordinate analysis of ruminal microbiota from the groups HFg (goats with high-fiber diets) and LFg (goats with low-fiber diets). The data were statistically analyzed based on ANOSIM. (B) Sankey diagram of the HFg and LFg groups in the dominant bacteria phyla with top 5 abundance and the dominant bacterial genera with top 10 abundance; (C) differential taxonomic abundance between the HFg and LFg groups was analyzed by linear discriminate analysis coupled with effect size measurements (LEfse) as a cladogram. (A linear discriminant analysis [LDA] threshold value of >3 and P value of <0.05 are shown.)
FIG 3
FIG 3
Effect of high- and low-fiber diets on the body weight and intestinal microbiota of mice. (A) Effect of high-fiber diet and low-fiber diet on the weight of mice. The data were analyzed using Student's t test and are expressed as the means with standard errors. (B and C) Principal-coordinate analysis (PCoA) of the small intestinal bacterial community between the groups HFm (high-fiber-fed mice) and LFm (low-fiber-fed mice) (B) and the colonic bacterial community between the HFm and LFm groups (C). The data of panels B and C were statistically analyzed based on ANOSIM. (D and E) Differential bacteria at the genus level (P < 0.05) of the small intestine bacterial community (D) and the colonic bacterial community (E) between the HFm and LFm groups. The Mann-Whitney U test was used to identify significantly different bacteria. All bacteria listed here were significantly differential bacteria with P values of <0.05 between the two groups. All of the data are expressed as means with standard deviations. (F and G) Shared differential bacteria at the genus level between the rumen microbiota of dairy goats from the HFg and LFg groups and the small intestinal microbiota of mice from the HFm and LFm groups (F) and the rumen microbiota of dairy goats from the HFg and LFg groups and the colonic microbiota of mice from the HFm and LFm group (G).
FIG 4
FIG 4
Effects of ruminal microbiota transplant on the significantly changed growth performance and intestinal microbial composition of antibiotic-pretreated mice fed a high-fiber diet compared with the normally fed mice fed a high-fiber diet, but without antibiotics and RMT treatment. (A) Effects of ruminal microbiota transplant on the weight of antibiotic-pretreated mice fed a high-fiber diet compared with the normally fed mice fed a high-fiber diet but without antibiotics and RMT treatment. The data were analyzed using ANOVA. If a significant treatment effect was observed by ANOVA, the significant difference between treatments was identified by Duncan’s multiple-comparison test. All of the data are expressed as means with standard errors. (B and C) Chao1 index (B) and Shannon index (C) of the small intestine bacterial community of mice among the groups HFm (high-fiber-fed mice), Anti-HFg-HFm (antibiotic-pretreated mice that received ruminal microbiota from high-fiber-fed goats and meanwhile were fed high-fiber diets), and Anti-LFg-HFm (antibiotic-pretreated mice that received ruminal microbiota from low-fiber-fed goats and meanwhile were fed high-fiber diets). (D and E) Chao1 index (D) and Shannon index (E) of the colonic bacterial community of mice among the HFm, Anti-HFg-HFm, and Anti-LFg-HFm groups. The data of panels B to E were statistically analyzed using the Kruskal-Wallis test with Dunn's post hoc test. (F) Principal-coordinate analysis of the small intestine bacterial community of mice among the HFm, Anti-HFg_HFm, and Anti_LFg_HFm groups; (G) small intestinal microbial weighted UniFrac ANOSIM distances among the HFm, Anti-HFg-HFm, and Anti-LFg-HFm groups; (H) principal-coordinate analysis of the colonic bacterial community of mice among the HFm, Anti-HFg-HFm, and Anti-LFg-HFm groups; (I) colonic microbial weighted UniFrac ANOSIM distances among the HFm, Anti-HFg-HFm, and Anti-LFg-HFm groups. The data of panels F and H were statistically analyzed based on ANOSIM. The data of panels G and I were statistically analyzed using the Kruskal-Wallis test with Dunn's post hoc test. (J and K) Differences in the relative abundance of the small intestinal bacterial at the phylum level (J) and genus level (K) among the HFm, Anti-HFg-HFm, and Anti-LFg-HFm groups; (L and M) differences in the relative abundance of the colonic bacterial at the phylum level (L) and genus level (M) among the HFm, Anti-HFg-HFm, and Anti-LFg-HFm groups.
FIG 5
FIG 5
Significantly differential bacteria between antibiotic-treated mice receiving RMT treatment compared with the mice without treatment with antibiotics and RMT when they all received a high-fiber diet. (A and B) Small intestinal differential bacteria at the phylum level (A) and the genus level (B) among the groups HFm (high-fiber-fed mice), Anti-HFg-HFm (antibiotic-pretreated mice that received ruminal microbiota from high-fiber-fed goats and meanwhile were fed high-fiber diets), and Anti-LFg-HFm (antibiotic-pretreated mice that received ruminal microbiota from low-fiber-fed goats and meanwhile were fed high-fiber diets); (C and D) colonic differential bacteria at the phylum level (C) and the genus level (D) among the HFm, Anti-HFg-HFm, and Anti-LFg-HFm groups. The data of panels A to D were statistically analyzed using the Kruskal-Wallis test with Dunn's post hoc test. All of the data are expressed as means with standard deviations. (E) Shared differential bacteria in the small intestine of mice among the HFm, Anti-HFg-HFm, and Anti-LFg-HFm groups; (F) shared differential bacteria in the colon of mice among the HFm, Anti-HFg-HFm, and Anti-LFg-HFm groups. The Mann-Whitney U test was used to identify significantly different bacteria. All bacteria listed here were significantly differential bacteria with P values of <0.05 between the two groups. All data in the heat map are processed by log10 and standardized. In detail, the shared differential bacteria in the comparisons of HFm versus Anti-HFg-HFm and HFm versus Anti-LFg-HFm are marked in purple. The shared differential bacteria in the comparisons HFm versus Anti-HFg-HFm and Anti-HFg-HFm versus Anti-LFg-HFm are marked in green. The shared differential bacteria in the comparisons HFm versus Anti-LFg-HFm and Anti-HFg-HFm versus Anti-LFg-HFm are marked in yellow. The shared differential bacteria in the comparisons HFm_s versus Anti-HFg-HFm and HFm versus Anti-LFg-HFm and Anti-HFg-HFm versus Anti-LFg-HFm are marked in red.
FIG 6
FIG 6
Correlation analysis and function prediction of intestinal and colonic microbiota among the HFm, Anti-HFg-HFm, and Anti-LFg-HFm groups. (A) Pearson correlation between the shared differential bacteria in the colon among the HFm, Anti-HFg-HFm, and Anti-LFg-HFm groups and their relative mRNA expression of tight junction proteins in the colon epithelia. An asterisk indicates the correlation is significant (P < 0.05). (B) Prediction of the differential function related to the energy metabolism of the small intestinal microbes among the HFm, Anti-HFg-HFm, and Anti-LFg-HFm groups based on multiple MetaCyc pathways using PICRUSt2; (C) prediction of the differential function related to the energy metabolism of the colonic microbes among the HFm, Anti-HFg-HFm, and Anti-LFg-HFm groups based on multiple MetaCyc pathways using PICRUSt2. The Mann-Whitney U test was used to rank pathways in panels B and C that were significantly differentially changed (P < 0.05) in predicted metagenome pathway analysis.
FIG 7
FIG 7
Effects of ruminal microbiota transplant on the significantly changed intestinal microbial composition of antibiotic-pretreated mice fed a low-fiber diet compared with the normally fed mice fed a low-fiber diet, but without antibiotics and RMT treatment. (A and B) Chao1 index (A) and Shannon index (B) of the small intestinal bacterial community of mice among the groups LFm (low-fiber-fed mice), Anti-HFg-LFm (antibiotic-pretreated mice that received ruminal microbiota from high-fiber-fed goats and meanwhile were fed low-fiber diets), and Anti-LFg-LFm (antibiotic-pretreated mice that received ruminal microbiota from low-fiber-fed goats and meanwhile were fed low-fiber diets); (C and D) Chao1 index (C) and Shannon index (D) of the colonic bacterial community of mice among the LFm, Anti-HFg-LFm, and Anti-LFg-LFm groups. The data of panels A to D were statistically analyzed using the Kruskal-Wallis test with Dunn's post hoc test. (E) Principal-coordinate analysis of the small intestine bacterial community of mice among the LFm, Anti-HFg-LFm, and Anti-LFg-LFm groups; (F) small intestinal microbial weighted UniFrac ANOSIM distances among the LFm, Anti-HFg-LFm, and Anti-LFg-LFm groups; (G) principal-coordinate analysis of the colonic bacterial community of mice among the LFm, Anti-HFg-LFm, and Anti-LFg-LFm groups; (H) colonic microbial weighted UniFrac ANOSIM distances among the LFm, Anti-HFg_LFm, and Anti-LFg-LFm groups. The data of panels E and G were statistically analyzed based on ANOSIM. The data of panels F and H were statistically analyzed using the Kruskal-Wallis test with Dunn's post hoc test. (I and J) Differences in the relative abundance of the colonic bacterial at the phylum level (I) and genus level (J) among the HFm, Anti-HFg-HFm, and Anti-LFg-HFm groups.
FIG 8
FIG 8
Significantly different bacteria between antibiotic-treated mice receiving RMT treatment compared with the mice without treatment with antibiotics when they all received a low-fiber diet. (A and B) Small intestinal differential bacteria at the phylum level (A) and the genus level (B) among the groups LFm (low-fiber-fed mice), Anti-HFg-LFm (antibiotic-pretreated mice that received ruminal microbiota from high-fiber-fed goats and meanwhile were fed low-fiber diets), and Anti-LFg-LFm (antibiotic-pretreated mice that received ruminal microbiota from low-fiber fed goats and meanwhile were fed low-fiber diets); (C and D) colonic differential bacteria at the phylum level (C) and the genus level(D) among the LFm, Anti-HFg-LFm, and Anti-LFg-LFm groups. The data of panels A to D were statistically analyzed using the Kruskal-Wallis test with Dunn's post hoc test. All of the data are expressed as means with standard deviations. (E) Shared differential bacteria in the small intestine of mice among the LFm, Anti-HFg-LFm, and Anti-LFg-LFm groups; (F) shared differential bacteria in the colon of mice among the LFm, Anti-HFg-LFm, and Anti-LFg-LFm groups. The Mann-Whitney U test was used to identify significantly different bacteria. All bacteria listed here were significantly differential bacteria with P values of <0.05 between the two groups. All data in the heat map are processed by log10 and standardized. In detail, the shared differential bacteria in the comparisons LFm versus Anti-HFg-LFm and LFm versus Anti-LFg-LFm are marked in purple. The shared differential bacteria in the comparisons LFm versus Anti-HFg-LFm and Anti-HFg-LFm versus Anti-LFg-LFm are marked in green. The shared differential bacteria in LFm versus Anti-LFg-LFm and Anti-HFg-LFm versus Anti-LFg-LFm are marked in yellow. The shared differential bacteria in LFm versus Anti-HFg-LFm and LFm versus Anti-LFg-LFm and Anti-HFg-LFm versus Anti-LFg-LFm are marked in red. (G) Prediction of the differential function related to the energy metabolism of the small intestinal microbes among the LFm, Anti-HFg-LFm, and Anti-LFg-LFm groups based on multiple MetaCyc pathways using PICRUSt2; (H) prediction of the differential function related to the energy metabolism of the colonic microbes among the LFm, Anti-HFg-LFm, and Anti-LFg-LFm groups based on multiple MetaCyc pathways using PICRUSt2. The Mann-Whitney U test was used to rank pathways of panels G and H that were significantly different (P < 0.05) in predicted metagenome pathway analysis.

Similar articles

Cited by

References

    1. Paone P, Cani PD. 2020. Mucus barrier, mucins and gut microbiota: the expected slimy partners? Gut 69:2232–2243. doi:10.1136/gutjnl-2020-322260. - DOI - PMC - PubMed
    1. Rowland I, Gibson G, Heinken A, Scott K, Swann J, Thiele I, Tuohy K. 2018. Gut microbiota functions: metabolism of nutrients and other food components. Eur J Nutr 57:1–24. doi:10.1007/s00394-017-1445-8. - DOI - PMC - PubMed
    1. Rinninella E, Cintoni M, Raoul P, Lopetuso LR, Scaldaferri F, Pulcini G, Miggiano GAD, Gasbarrini A, Mele MC. 2019. Food components and dietary habits: keys for a healthy gut microbiota composition. Nutrients 11:2393. doi:10.3390/nu11102393. - DOI - PMC - PubMed
    1. Cui Z, Wu S, Li J, Yang Q-E, Chai S, Wang L, Wang X, Zhang X, Liu S, Yao J. 2020. Effect of alfalfa hay and starter feeding intervention on gastrointestinal microbial community, growth and immune performance of yak calves. Front Microbiol 11:994. doi:10.3389/fmicb.2020.00994. - DOI - PMC - PubMed
    1. Moraïs S, Mizrahi I. 2019. Islands in the stream: from individual to communal fiber degradation in the rumen ecosystem. FEMS Microbiol Rev 43:362–379. doi:10.1093/femsre/fuz007. - DOI - PMC - PubMed

Publication types

LinkOut - more resources