. 2022 Aug 31;10(4):e0089722.
doi: 10.1128/spectrum.00897-22. Epub 2022 Aug 4.

Triosephosphate Isomerase and Its Product Glyceraldehyde-3-Phosphate Are Involved in the Regulatory Mechanism That Suppresses Exit from the Quiescent State in Yeast Cells

Affiliations

Triosephosphate Isomerase and Its Product Glyceraldehyde-3-Phosphate Are Involved in the Regulatory Mechanism That Suppresses Exit from the Quiescent State in Yeast Cells

Guoyu Liu et al. Microbiol Spectr. .

Abstract

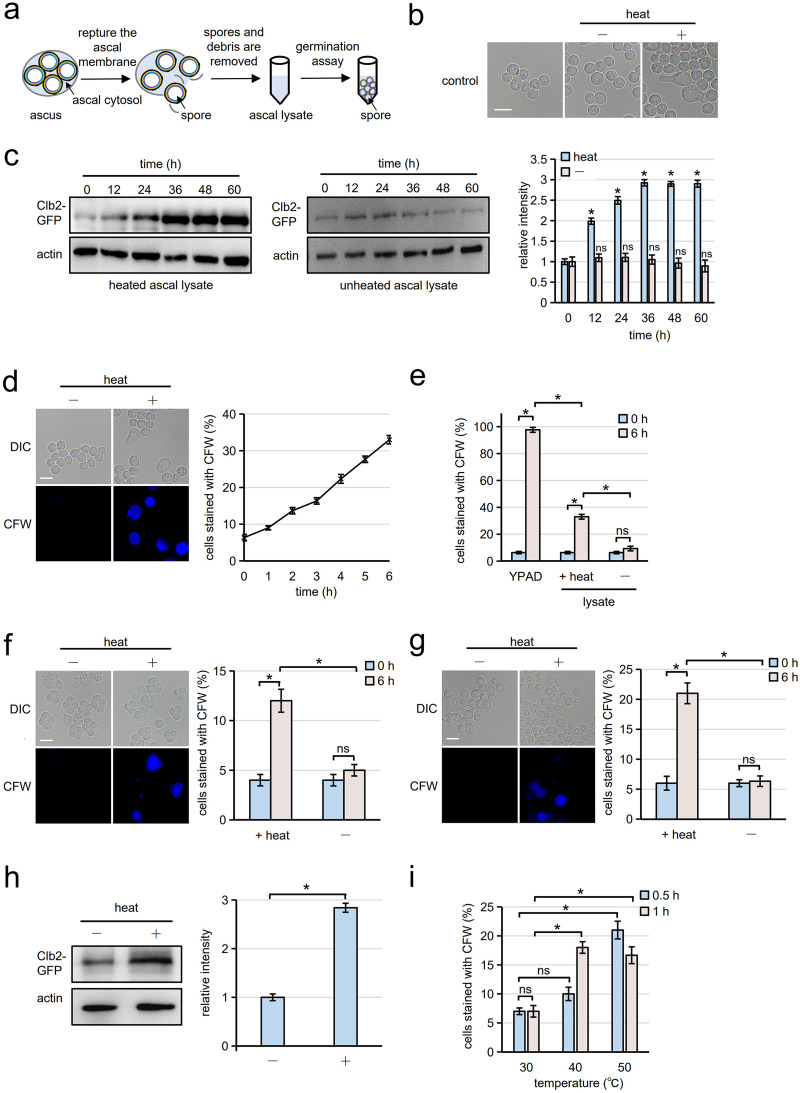
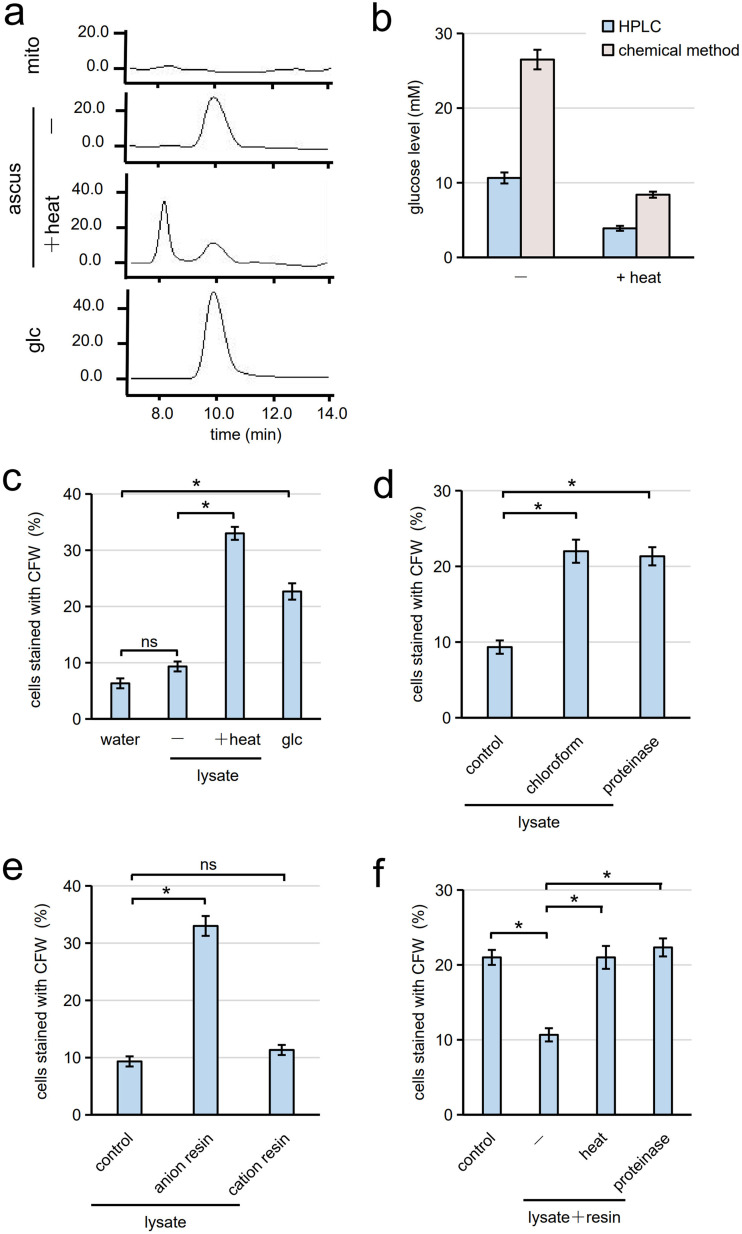
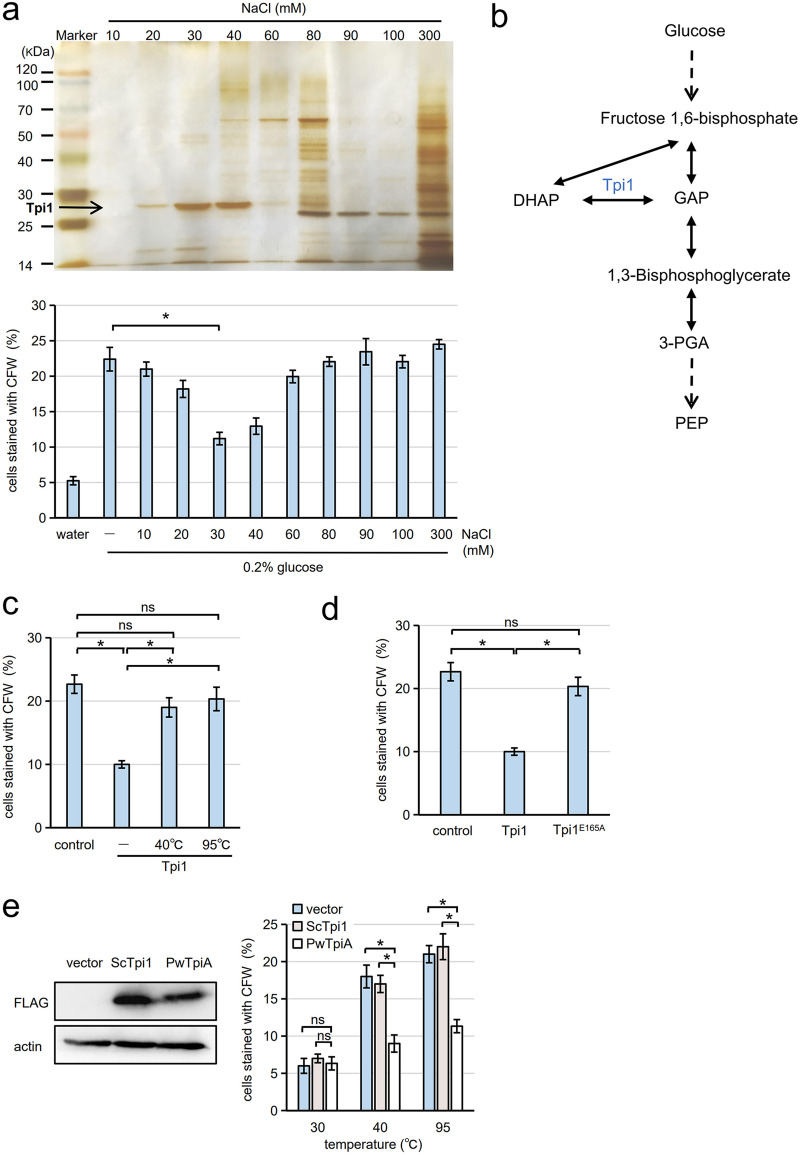
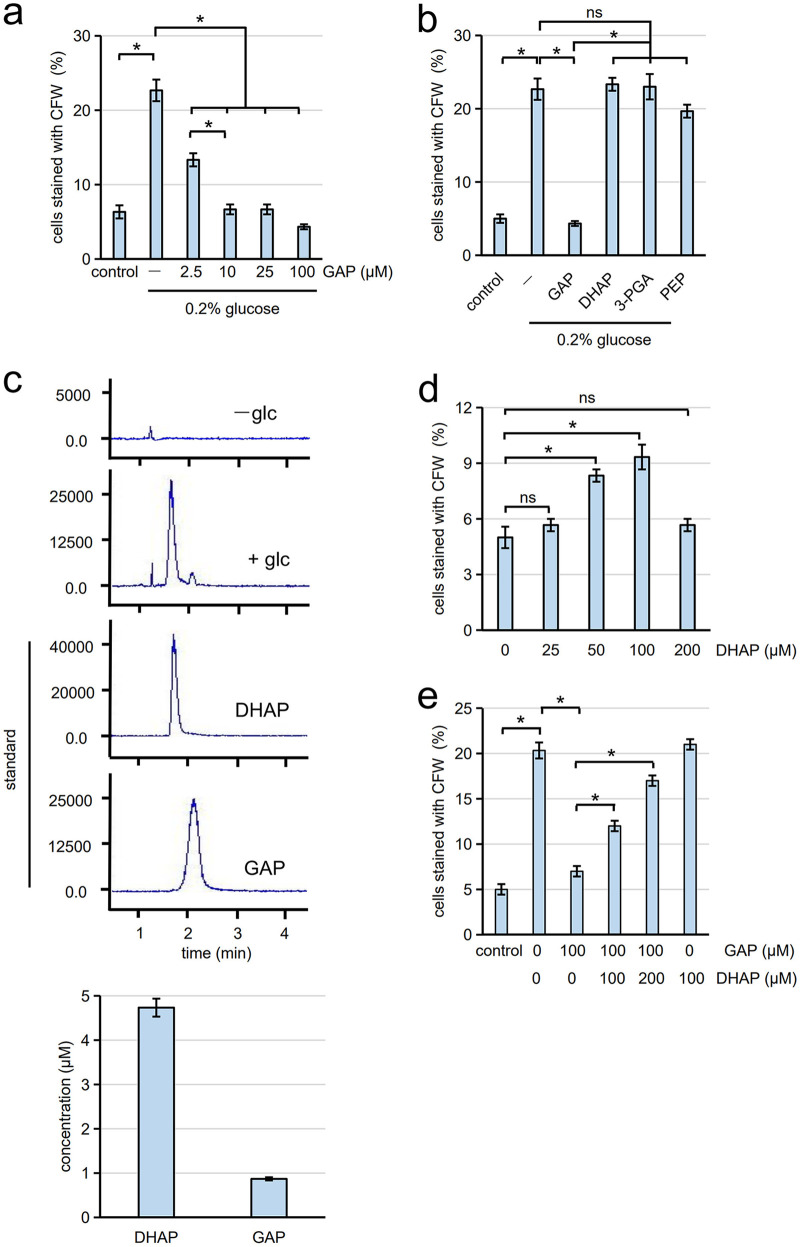
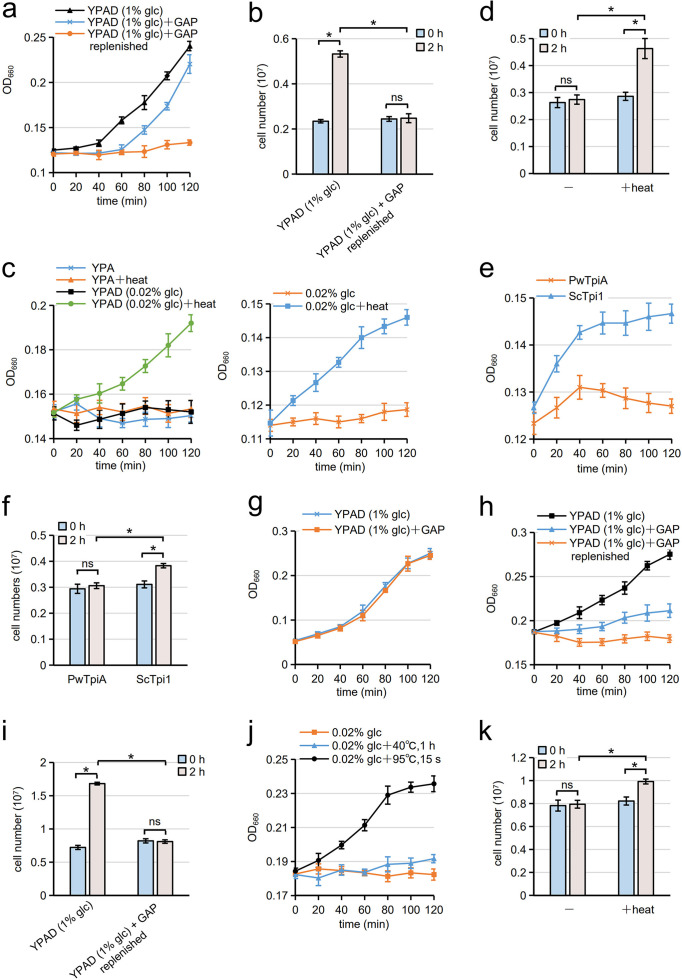
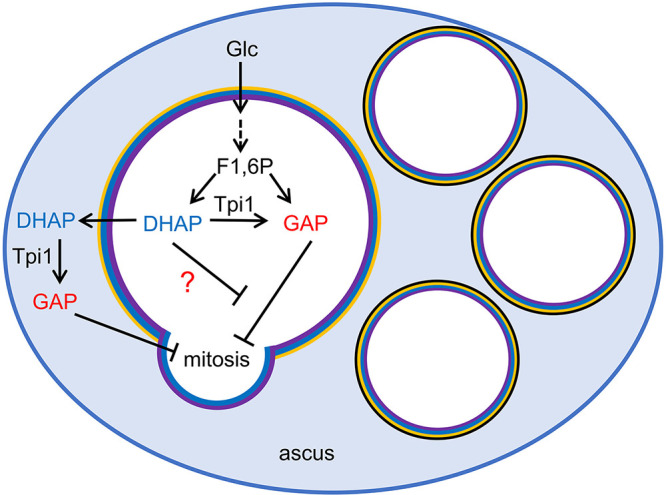
Cells of the budding yeast Saccharomyces cerevisiae form spores or stationary cells upon nutrient starvation. These quiescent cells are known to resume mitotic growth in response to nutrient signals, but the mechanism remains elusive. Here, we report that quiescent yeast cells are equipped with a negative regulatory mechanism which suppresses the commencement of mitotic growth. The regulatory process involves a glycolytic enzyme, triosephosphate isomerase (Tpi1), and its product, glyceraldehyde-3-phosphate (GAP). GAP serves as an inhibitory signaling molecule; indeed, the return to growth of spores or stationary cells is suppressed by the addition of GAP even in nutrient-rich growth media, though mitotic cells are not affected. Reciprocally, dormancy is abolished by heat treatment because of the heat sensitivity of Tpi1. For example, spores commence germination merely upon heat treatment, which indicates that the negative regulatory mechanism is actively required for spores to prevent premature germination. Stationary cells of Candida glabrata are also manipulated by heat and GAP, suggesting that the regulatory process is conserved in the pathogenic yeast. IMPORTANCE Our results suggest that, in quiescent cells, nutrient signals do not merely provoke a positive regulatory process to commence mitotic growth. Exit from the quiescent state in yeast cells is regulated by balancing between the positive and negative signaling pathways. Identifying the negative regulatory pathway would provide new insight into the regulation of the transition from the quiescent to the mitotic state. Clinically, quiescent cells are problematic because they are resistant to environmental stresses and antibiotics. Given that the quiescent state is modulated by manipulation of the negative regulatory mechanism, understanding this process is important not only for its biological interest but also as a potential target for antifungal treatment.

Keywords: glyceraldehyde-3-phosphate; quiescent cells; spores; triosephosphate isomerase; yeasts.


Conflict of interest statement

The authors declare no conflict of interest.

Figures

FIG 1
FIG 1
Germination of S. cerevisiae spores is induced by heat. (a) Schematic diagram for preparation of the ascal lysate and the germination assay using the ascal lysate. To prepare the ascal lysate, asci suspended in water were ruptured by sonication. After centrifugation, the supernatant, which contained the ascal cytosol (shown in blue), was incubated with spores to assay germination. (b) Spores were incubated with ascal lysate treated with (+) or without (−) heat (90°C, 10 min). The suspensions were incubated at 30°C for 6 h and observed by differential interference contrast (DIC) microscopy. Spores before incubation with ascal lysate are shown as controls (control). Scale bar, 5 μm. (c, Left panels) Spores were incubated in ascal lysate treated with or without heat (90°C, 10 min). The spore suspension was incubated at 30°C for indicated times, and Clb2-GFP was detected by Western blotting using an anti-GFP antibody. Actin was detected as loading control. (c, Right) Relative intensities of Clb2-GFP signals detected by Western blotting. The amount of Clb2-GFP detected in the lysate with 0 h of incubation was taken as 1. Student’s t test was performed between 0 h and each time point. (d) Spores were incubated with ascal lysate treated with (+) or without (−) heat (90°C, 10 min). The suspensions were incubated at 30°C for 6 h. After staining with CFW, DIC and fluorescence microscopy (CFW) images were obtained. Scale bar, 5 μm (left panels). The percentage of CFW-stained spores incubated in ascal lysate treated with heat was measured over time (right panel). Three hundred spores were analyzed for each assay. (e) Percentage of cells stained with CFW before (0 h) and after 6 h of incubation with heated (+heat) or unheated (−) lysate. Spores incubated with YPAD were also assayed. Three hundred spores were analyzed for each assay. (f, Left) Asci were treated with (+) or without (−) heat (at 95°C, 15 s) and incubated at 30°C for 6 h. After staining with CFW, DIC and fluorescence microscopy (CFW) images were obtained. Scale bar, 5 μm. (f, Right) Percentage of cells stained with CFW before (0 h) and after 6 h of incubation. Three hundred asci were analyzed for each assay. (g, Left) Spores released from asci were treated with (+) or without (−) heat (95°C, 15 s) and incubated at 30°C for 6 h. After staining with CFW, DIC and fluorescence microscopy (CFW) images were obtained. Scale bar, 5 μm. (g, Right) Percentage of cells stained with CFW before (0 h) and after 6 h of incubation. Three hundred spores were analyzed for each assay. (h, Left) Spores expressing Clb2-GFP were treated with heat (95°C, 15 s) and incubated at 30°C for 36 h. Clb2-GFP was detected in the lysate by Western blotting using an anti-GFP antibody. Actin was detected as a loading control. (h, Right) Relative intensities of Clb2-GFP signals detected by Western blotting. The level of Clb2-GFP detected in the lysate with 0 h of incubation was taken as 1. (i) Spores were incubated at the indicated temperatures for 0.5 or 1 h. The spores were incubated at 30°C for 6 h, and germination efficiency was assayed with CFW staining. Three hundred spores were analyzed for each assay. The data in panels c to i are presented as the mean ± SE; n = 3. Statistical analysis was performed by two-tailed unpaired Student’s t tests; *, P < 0.05; ns, not significant.
FIG 2
FIG 2
Ascal lysate contains an inhibitor to suppress germination. (a) Detection of glucose in mitotic cell lysate (mito) and ascal lysate (ascus) before (−) or after (+heat) heat treatment (90°C, 10 min) by HPLC. Glucose solution (glc) was used as a standard. (b) The glucose concentration in ascal lysate before (−) and after (+heat) heat treatment was measured by HPLC or chemical methods. (c) Spores suspended in water, 0.2% glucose solution (glc), or ascal lysate (lysate) treated with (+heat) or without (−) heat (90°C, 10 min) were incubated at 30°C for 6 h. After staining with CFW, cells stained with CFW were counted under the microscope. Three hundred spores were analyzed for each assay. (d) Spores were suspended in ascal lysate treated with or without (control) chloroform extraction (chloroform) or proteinase. These spore suspensions were incubated at 30°C for 6 h, and germination efficiency was assayed with CFW staining. Three hundred spores were analyzed for each assay. (e) Ascal lysate incubated with or without (control) anion or cation exchange resin was centrifuged, and the supernatant was then incubated with spores. After incubation at 30°C for 6 h, germination efficiency was assayed with CFW staining. Three hundred spores were analyzed for each assay. (f) Anion exchange resin was incubated with ascal lysate (lysate). The resin was collected and treated with or without (−) heat (95°C, 15 s) or proteinase. The resins and spores were suspended in 0.2% glucose solution and incubated at 30°C for 6 h. Germination efficiency was assayed with CFW staining. As a control, spores were incubated with anion exchange resin in 0.2% glucose solution. Three hundred spores were analyzed for each assay. The data in panels b to f are presented as the mean ± SE; n = 3. Statistical analysis was performed by two-tailed unpaired Student’s t tests. *, P < 0.05; ns, not significant.
FIG 3
FIG 3
Tpi1 is the inhibitor present in ascal lysate. (a, Top) Ascal lysate treated as shown in Fig. S5a in the supplemental material was applied to anion exchange resin column. Proteins eluted with indicated concentration of NaCl solutions were separated by SDS-PAGE and detected with silver staining. The arrow indicates the Tpi1 band. (a, Bottom) Spores were incubated with the eluents in the presence of 0.2% glucose, and germination efficiency was assayed with CFW staining. As controls, germination efficiencies of spores incubated with water or 0.2% glucose solution (−) are shown. Three hundred spores were analyzed for each assay. (b) Schematic of glycolytic pathway from glucose to phosphoenolpyruvate (PEP). (c) Spores were incubated in 0.2% glucose solution supplemented with or without (control) recombinant Tpi1. Tpi1 was treated with or without (−) heat (40°C for 1 h or 95°C for 15 s). The spore suspensions were incubated at 30°C for 6 h. After staining with CFW, cells stained with CFW were counted under the microscope. Three hundred spores were analyzed for each assay. (d) Spores were incubated in 0.2% glucose solution with or without (control) wild-type Tpi1 or Tpi1E165A. The spore suspensions were incubation at 30°C for 6 h, and germination efficiency was assayed with CFW staining. Three hundred spores were analyzed for each assay. (e, Left panels) S. cerevisiae TPI1-FLAG (ScTpi1) or P. woesei tpiA-FLAG (PwTpiA) expressed in yeast cells was detected by Western blotting (FLAG). Yeast cells harboring empty vector (vector) were used as a control. Actin was detected as a loading control. (e, Right) After cells harboring the plasmids sporulated, the spores released from asci were heated at 30°C for 1 h, 40°C for 1 h, or 95°C for 15 s. Then, the spores were incubated at 30°C for 6 h, and germination efficiency was assayed with CFW staining. Three hundred spores were analyzed for each assay. The data in panels a and c through e are presented as the mean ± SE; n = 3. Statistical analysis was performed by two-tailed unpaired Student’s t tests. *, P < 0.05; ns, not significant.
FIG 4
FIG 4
GAP can inhibit germination. (a) Spores were incubated with water (control) or 0.2% glucose supplemented with the indicated concentrations of GAP. After incubation at 30°C for 6 h, germination efficiency was measured with CFW staining. Three hundred spores were analyzed for each assay. (b) Spores were incubated with water (control) or 0.2% glucose supplemented with 100 μM GAP, DHAP, 3-PGA, or PEP. After incubation at 30°C for 6 h, germination efficiency was assayed with CFW staining. Three hundred spores were analyzed for each assay. (c, Top panels) Spores were incubated with 0.2% glucose solution (+glc) or water (−glc) at 30°C for 1 h. The supernatant of the spore suspensions was subjected to LC-MS to detect DHAP, and liquid chromatography data are shown. Mass spectrometry data are shown in Fig. S6 in the supplemental material. DHAP and GAP were subjected to LC-MS as standard samples. (c, Bottom panels) Quantification of DHAP and GAP detected in the assay solution. (d) Spores were suspended in water supplemented with the indicated amount of DHAP and incubated at 30°C for 6 h. Germination efficiency was assayed with CFW staining. Three hundred spores were analyzed for each assay. (e) Spores treated with or without (control) heat (40°C, 1 h) were suspended in water supplemented with indicated amounts of GAP and DHAP. After incubation at 30°C for 6 h, germination efficiency was assayed with CFW staining. Three hundred spores were analyzed for each assay. The data are presented as the mean ± SE; n = 3. Statistical analysis was performed by two-tailed unpaired Student’s t tests. *, P < 0.05; ns, not significant.
FIG 5
FIG 5
Exit from stationary state is suppressed by the negative regulatory process. (a and b) Stationary S. cerevisiae cells (haploid cells) were incubated in YPAD (1% glucose) supplemented with or without GAP at 30°C. The initial concentration of GAP in the medium was 50 μM. GAP was either replenished (0.1 μmol of GAP was added every 20 min) or not. (a) Cell growth was assayed by measuring turbidity. (b) Cell number was counted with a platelet counter before (0 h) and after (2 h) the incubation in YPAD or YPAD replenished with GAP every 20 min. (c) Stationary S. cerevisiae cells (haploid cells) treated with (heat) or without heat (40°C, 1 h) were incubated in YPA (glucose free) or YPAD (0.02% glucose) (left) or in water supplemented with 0.02% glucose (right). Cells were incubated at 30°C, and their growth was assayed by measuring turbidity. (d) Stationary S. cerevisiae cells (haploid cells) treated with (+heat) or without (−) heat (40°C, 1 h) were incubated in water supplemented with 0.02% glucose at 30°C for 2 h. Cell number was counted with a platelet counter before (0 h) and after (2 h) the incubation. (e and f) Stationary S. cerevisiae cells harboring TPI1-FLAG (ScTpi1) or P. woesei tpiA-FLAG (PwTpiA) (diploid cells used in Fig. 3e) were treated with (+heat) or without heat (40°C, 1 h). (e) The cells were incubated in water supplemented with 0.02% glucose at 30°C, and their growth was assayed by measuring turbidity. (f) Cell number was counted with a platelet counter before (0 h) and after (2 h) the incubation. (g) S. cerevisiae cells (haploid cells) in the logarithmic growth phase were incubated in YPAD (1% glucose) supplemented with or without GAP at 30°C, and their growth was assayed by measuring turbidity. We replenished 0.1 μmol of GAP every 20 min. The initial concentration of GAP in the medium was 50 μM. (h and i) Stationary C. glabrata cells were incubated in YPAD (1% glucose) supplemented with or without GAP at 30°C. The initial concentration of GAP was 50 μM. GAP was either replenished (0.1 μmol of GAP was added every 20 min) or not. (h) Cell growth was assayed by measuring turbidity. (i) Cell number was counted with a platelet counter before (0 h) and after (2 h) the incubation in YPAD or YPAD replenished with GAP every 20 min. (j and k) Stationary C. glabrata cells treated with (+heat) or without (−) heat (40°C for 1 h or 95°C for 15 s) were incubated in water supplemented with 0.02% glucose. (j) Cells were incubated at 30°C, and their growth was assayed by measuring turbidity. (k) Cell number was counted with a platelet counter before (0 h) and after (2 h) the incubation for the cells treated with (+ heat) or without (−) heat (95°C, 15 s). The data are presented as the mean ± SE; n = 3. Statistical analysis was performed by two-tailed unpaired Student’s t tests. *, P < 0.05; ns, not significant.
FIG 6
FIG 6
Model of the mechanism to suppress germination in the ascus. Tpi1 and GAP are involved in the negative regulatory process to suppress reentry into mitosis. In asci, GAP is also produced in the ascal cytosol by Tpi1 because Tpi1 is present in the ascal cytosol, and DHAP is secreted from spores. GAP generated in ascal cytosol is internalized in spores and inhibits germination.

Similar articles

References

    1. Werner-Washburne M, Braun E, Johnston GC, Singer RA. 1993. Stationary phase in the yeast Saccharomyces cerevisiae. Microbiol Rev 57:383–401. doi:10.1128/mr.57.2.383-401.1993. - DOI - PMC - PubMed
    1. Klosinska MM, Crutchfield CA, Bradley PH, Rabinowitz JD, Broach JR. 2011. Yeast cells can access distinct quiescent states. Genes Dev 25:336–349. doi:10.1101/gad.2011311. - DOI - PMC - PubMed
    1. Lillie SH, Pringle JR. 1980. Reserve carbohydrate metabolism in Saccharomyces cerevisiae: responses to nutrient limitation. J Bacteriol 143:1384–1394. doi:10.1128/jb.143.3.1384-1394.1980. - DOI - PMC - PubMed
    1. Choder M. 1991. A general topoisomerase I-dependent transcriptional repression in the stationary phase in yeast. Genes Dev 5:2315–2326. doi:10.1101/gad.5.12a.2315. - DOI - PubMed
    1. Fuge EK, Braun EL, Werner-Washburne M. 1994. Protein synthesis in long-term stationary-phase cultures of Saccharomyces cerevisiae. J Bacteriol 176:5802–5813. doi:10.1128/jb.176.18.5802-5813.1994. - DOI - PMC - PubMed

Publication types