

Autocorrection if→of function words in reading aloud: A novel marker of Alzheimer's risk
- PMID: 35925735
- PMCID: PMC9898462
- DOI: 10.1037/neu0000829
Autocorrection if→of function words in reading aloud: A novel marker of Alzheimer's risk
Abstract
Objective: The present study investigated cognitive mechanisms underlying the ability to stop "autocorrect" errors elicited by unexpected words in a read-aloud task, and the utility of autocorrection for predicting Alzheimer's disease (AD) biomarkers.
Method: Cognitively normal participants (total n = 85; n = 64 with cerebrospinal fluid [CSF] biomarkers) read aloud six short paragraphs in which 10 critical target words were replaced with autocorrect targets, for example, The player who scored that final [paint] for the local team reported [him] experience. Autocorrect targets either replaced the most expected/dominant completion (i.e., point) or a less expected/nondominant completion (i.e., basket), and within each paragraph half of the autocorrect targets were content words (e.g., point/paint) and half were function words (e.g., his/him). Participants were instructed to avoid autocorrecting.
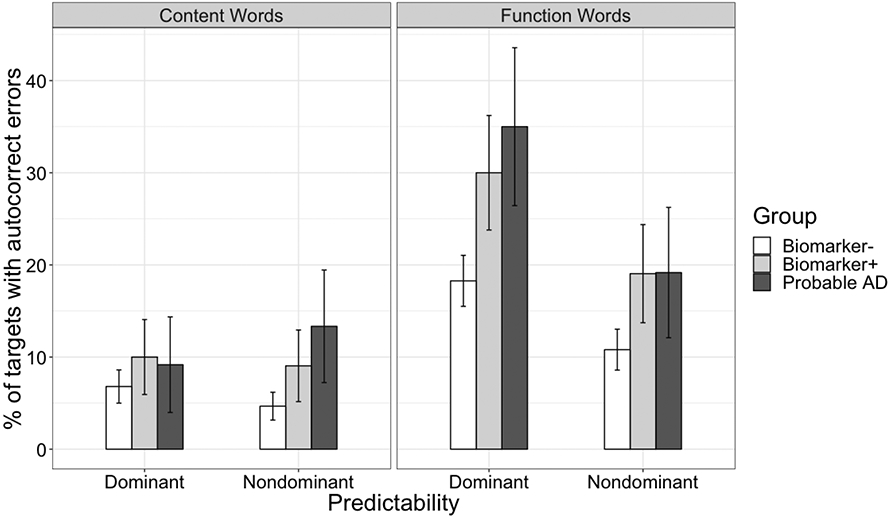
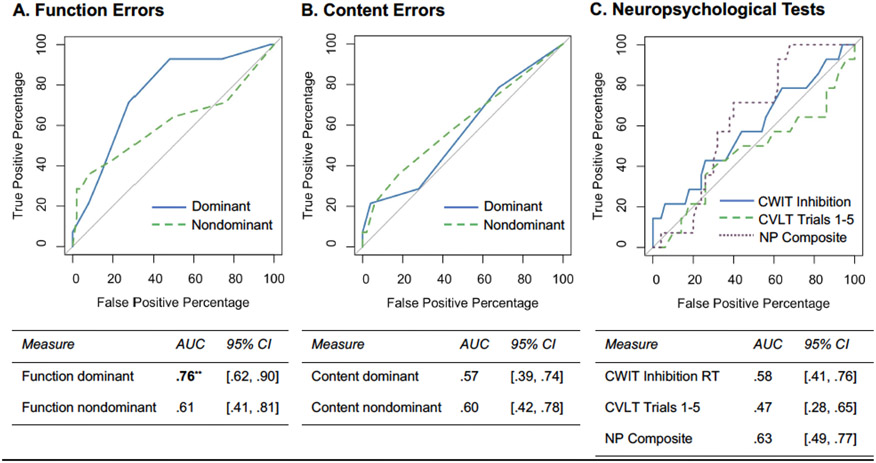
Results: Participants produced more autocorrect errors in paragraphs with dominant than with nondominant targets, and with function than with content targets. Cognitively normal participants with high CSF Tau/Aβ42 (i.e., an AD-like biomarker profile) produced more autocorrect total errors than those below the Tau/Aβ42 threshold, an effect also significant with dominant-function targets alone (e.g., saying his instead of him). A logistic regression model with dominant-function errors and age showed errors as the stronger predictor of biomarker status (sensitivity 83%; specificity 85%).
Conclusions: Difficulty stopping autocorrect errors is associated with biomarkers indicating preclinical AD, and reveals promise as a diagnostic tool. Greater vulnerability of function over content words to autocorrection in individuals with AD-like biomarkers implicates monitoring and attention (rather than semantic processing) in the earliest of cognitive changes associated with AD risk. (PsycInfo Database Record (c) 2023 APA, all rights reserved).
Conflict of interest statement
We have no conflicts of interest to disclose.
Figures
Similar articles
-
Failure to stop autocorrect errors in reading aloud increases in aging especially with a positive biomarker for Alzheimer's disease.Psychol Aging. 2020 Nov;35(7):1016-1025. doi: 10.1037/pag0000550. Epub 2020 Jun 25. Psychol Aging. 2020. PMID: 32584071 Free PMC article.
-
Intact reversed language-dominance but exaggerated cognate effects in reading aloud of language switches in bilingual Alzheimer's disease.Neuropsychology. 2020 Jan;34(1):88-106. doi: 10.1037/neu0000592. Epub 2019 Sep 23. Neuropsychology. 2020. PMID: 31545627 Free PMC article.
-
Effect of Cognitive Reserve on Age-Related Changes in Cerebrospinal Fluid Biomarkers of Alzheimer Disease.JAMA Neurol. 2015 Jun;72(6):699-706. doi: 10.1001/jamaneurol.2015.0098. JAMA Neurol. 2015. PMID: 25893879 Free PMC article.
-
Longitudinal structural cerebral changes related to core CSF biomarkers in preclinical Alzheimer's disease: A study of two independent datasets.Neuroimage Clin. 2018 Apr 16;19:190-201. doi: 10.1016/j.nicl.2018.04.016. eCollection 2018. Neuroimage Clin. 2018. PMID: 30023169 Free PMC article.
-
Cognitive Variability Predicts Incident Alzheimer's Disease and Mild Cognitive Impairment Comparable to a Cerebrospinal Fluid Biomarker.J Alzheimers Dis. 2018;61(1):79-89. doi: 10.3233/JAD-170498. J Alzheimers Dis. 2018. PMID: 29125485 Free PMC article.
Cited by
-
Language switching and speaking a nondominant language challenge executive control: Preliminary data for novel behavioral markers of Alzheimer's risk in Spanish-English bilinguals.Neuropsychology. 2024 May;38(4):322-336. doi: 10.1037/neu0000943. Epub 2024 Feb 8. Neuropsychology. 2024. PMID: 38330361 Free PMC article.
-
Estimating the rate of failure to notice function word errors in natural reading.Psychon Bull Rev. 2025 Apr;32(2):847-854. doi: 10.3758/s13423-024-02586-1. Epub 2024 Sep 30. Psychon Bull Rev. 2025. PMID: 39349743
References
-
- Aschenbrenner AJ, Balota DA, Fagan AM, Duchek JM, Benzinger TL, Morris JC (2015). Alzheimer Disease Cerebrospinal Fluid Biomarkers Moderate Baseline Differences and Predict Longitudinal Change in Attentional Control and Episodic Memory Composites in the Adult Children Study. Journal of the International Neuropsychological Society, 21(8), 573–83. doi: 10.1017/S1355617715000776. - DOI - PMC - PubMed
-
- Aschenbrenner AJ, Gordon BA, Fagan AM, Schindler SE, Balota DA, Morris JC, Hassenstab JJ (2020). Neurofilament Light Predicts Decline in Attention but Not Episodic Memory in Preclinical Alzheimer's Disease. Journal of Alzheimer’s Disease, 74(4), 1119–1129. doi: 10.3233/JAD-200018. - DOI - PMC - PubMed
-
- Bates D, Mächler M, Bolker B, Walker S (2015). “Fitting Linear Mixed-Effects Models Using lme4.” Journal of Statistical Software, 67(1), 1–48. doi: 10.18637/jss.v067.i01. - DOI
