. 2024 Apr;153(4):889-912.
doi: 10.1037/xge0001265. Epub 2022 Aug 4.

The developmental trajectories of children's reorientation to global and local properties of environmental geometry

Affiliations

The developmental trajectories of children's reorientation to global and local properties of environmental geometry

Matthew G Buckley et al. J Exp Psychol Gen. 2024 Apr.

Abstract

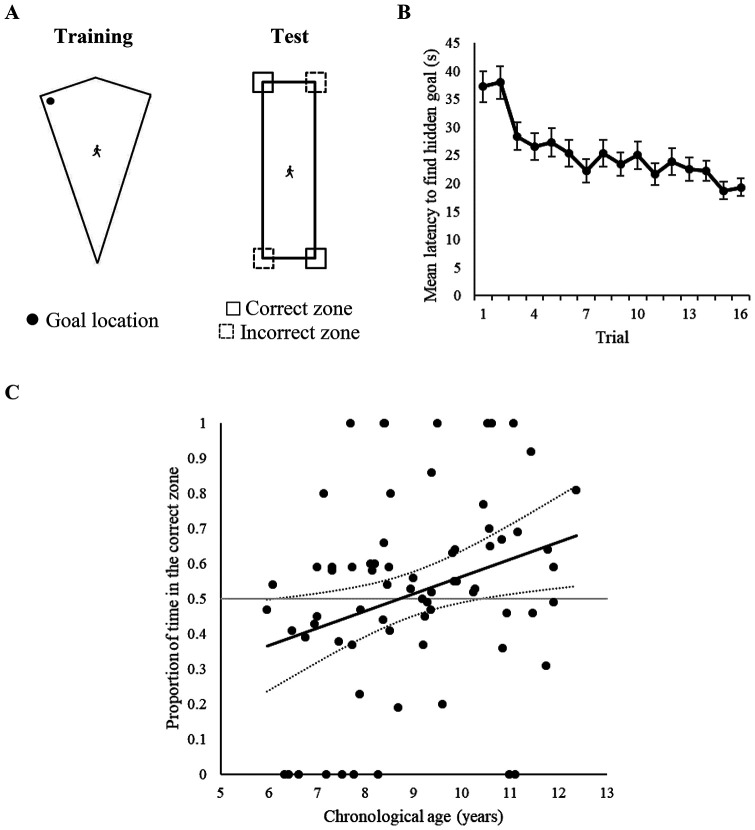
The way in which organisms represent the shape of their environments during navigation has been debated in cognitive, comparative, and developmental psychology. While there is evidence that adult humans encode the entire boundary shape of an environment (a global-shape representation), there are also data demonstrating that organisms reorient using only segments of the boundary that signal a goal location (a local-shape representation). Developmental studies offer unique insights into this debate; however, most studies have used designs that cannot dissociate the type of boundary-shape representation that children use to guide reorientation. Thus, we examined the developmental trajectories of children's reorientation according to local and global boundary shape. Participants aged 6-12 years were trained to find a goal hidden in one corner of a virtual arena, after which they were required to reorient in a novel test arena. From 10.5 years, children performed above chance when the test arena permitted reorientation based only on local-shape (Experiment 2), or only global-shape (Experiment 3) information. Moreover, when these responses were placed into conflict, older children reoriented with respect to global-shape information (Experiment 4). These age-related findings were not due to older children being better able to reorient in virtual environments per se: when trained and tested within the same environment (Experiment 1), children performed above chance from 6 years. Together, our results suggest (a) the ability to reorient on the basis of global- and local-shape representations develops in parallel, and (b) shape-based information is weighted to determine which representation informs reorientation. (PsycInfo Database Record (c) 2024 APA, all rights reserved).


Figures

Figure 1
Figure 1. Screenshots of the Reorientation Task Used in Experiments 1–4, Which Was Framed as a “Ghost-Hunter” Computer Game
Note. (A) The inside of the kite-shaped arena that was used for training in Experiments 1–3, and at test in Experiment 1. (B) The inside of the rectangle-shaped arena that was used at test in Experiment 2. (C) The outside of the kite-shaped arena that was used at test in Experiment 3. (D and E) The inside and outside of the cross-shaped arena that was used for training and test, respectively, in Experiment 4. (F) The screen displayed to participants when they had found the goal location on each training trial, with the trial counter that allowed participants to track their progress through the “game.” See the online article for the color version of this figure.
Figure 2
Figure 2. Design and Data From Experiment 1
Note. (A) Schematic diagrams of the training and test environments. The location of the person indicates whether children were navigating on the inside or outside of the environment. (B) Mean latencies to find the goal during training, collapsed across all participant ages. Error bars represent ±1 SEM. (C) Proportion of time spent in the correct zone at test, plotted by individual ages. The solid black line represents the linear regression model of age predicting proportion scores, and the dotted lines represent the upper and lower 95% confidence intervals of the model. The solid gray line indicates chance performance at test.
Figure 3
Figure 3. Design and Data From Experiment 2
Note. (A) Schematic diagrams of the training and test environments. The location of the person indicates whether children were navigating on the inside or outside of the environment. (B) Mean latencies to find the goal during training, collapsed across all participant ages. Error bars represent ±1 SEM. (C) Proportion of time spent in the correct zone at test, plotted by individual ages. The solid black line represents the linear regression model of age predicting proportion scores, and the dotted lines represent the upper and lower 95% confidence intervals of the model. The solid gray line indicates chance performance at test.
Figure 4
Figure 4. Design and Data From Experiment 3
Note. (A) Schematic diagrams of the training and test environments. The location of the person indicates whether children were navigating on the inside or outside of the environment. (B) Mean latencies to find the goal during training, collapsed across all participant ages. Error bars represent ±1 SEM. (C) Proportion of time spent in the correct zone at test, plotted by individual ages. The solid black line represents the linear regression model of age predicting proportion scores, and the dotted lines represent the upper and lower 95% confidence intervals of the model. The solid gray line indicates chance performance at test.
Figure 5
Figure 5. Design and Data From Experiment 4
Note. (A) Schematic diagrams of the training and test environments. The location of the person indicates whether children were navigating on the inside or outside of the environment. (B) Mean latencies to find the goal during training, collapsed across all participant ages. Error bars represent ±1 SEM. (C) Proportion of time spent in the Global Correct zone at test, plotted by individual ages. The solid black line represents the linear regression model of age predicting proportion scores, and the dotted lines represent the upper and lower 95% confidence intervals of the model. The solid gray line indicates chance performance at test.

Similar articles

References

    1. Ayaz H., Allen S. L., Platek S. M., & Onaral B. (2008). Maze Suite 1.0: A complete set of tools to prepare, present, and analyze navigational and spatial cognitive neuroscience experiments. Behavior Research Methods, 40(1), 353–359. 10.3758/BRM.40.1.353 - DOI - PubMed
    1. Buckley M. G., Austen J. M., Myles L. A. M., Smith S., Ihssen N., Lew A. R., & McGregor A. (2021). The effects of spatial stability and cue type on spatial learning: Implications for theories of parallel memory systems. Cognition, 214, Article 104802. 10.1016/j.cognition.2021.104802 - DOI - PubMed
    1. Buckley M. G., & Bast T. (2018). A new human delayed-matching-to-place test in a virtual environment reverse-translated from the rodent watermaze paradigm: Characterization of performance measures and sex differences. Hippocampus, 28(11), 796–812. 10.1002/hipo.22992 - DOI - PubMed
    1. Buckley M. G., Haselgrove M., & Smith A. D. (2015). The developmental trajectory of intramaze and extramaze landmark biases in spatial navigation: An unexpected journey. Developmental Psychology, 51(6), 771–791. 10.1037/a0039054 - DOI - PMC - PubMed
    1. Buckley M., Holden L., Smith A., & Haselgrove M. (2022). The developmental trajectories of children’s reorientation to global and local properties of environmental geometry [Dataset]. 10.17605/OSF.IO/Q83N7/ - DOI - PMC - PubMed