. 2023 Jan 1;32(1):93-103.
doi: 10.1093/hmg/ddac182.

De novo variants cause complex symptoms in HSP-ATL1 (SPG3A) and uncover genotype-phenotype correlations

Affiliations

De novo variants cause complex symptoms in HSP-ATL1 (SPG3A) and uncover genotype-phenotype correlations

Julian E Alecu et al. Hum Mol Genet. .

Erratum in

Abstract

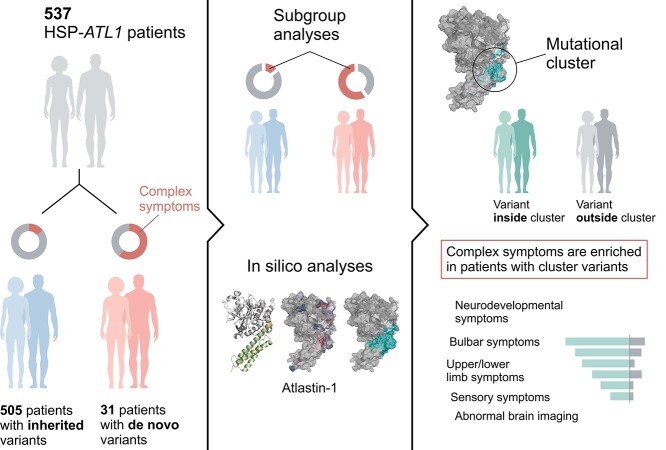
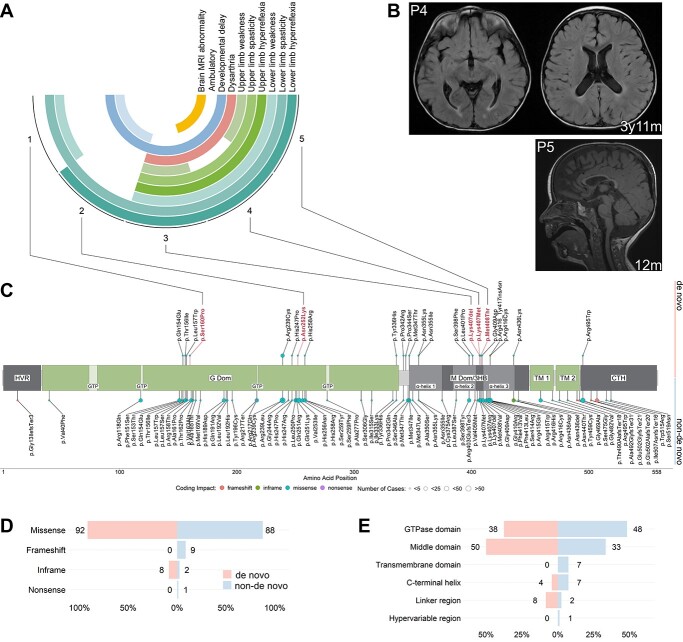
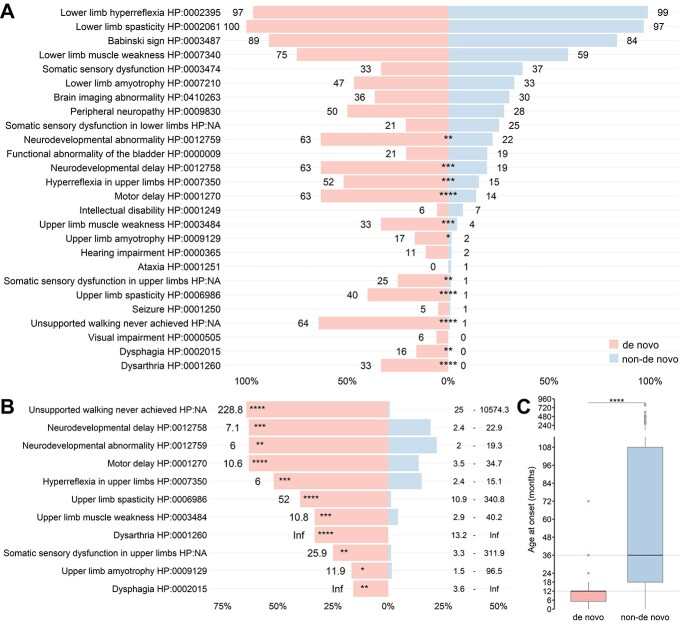
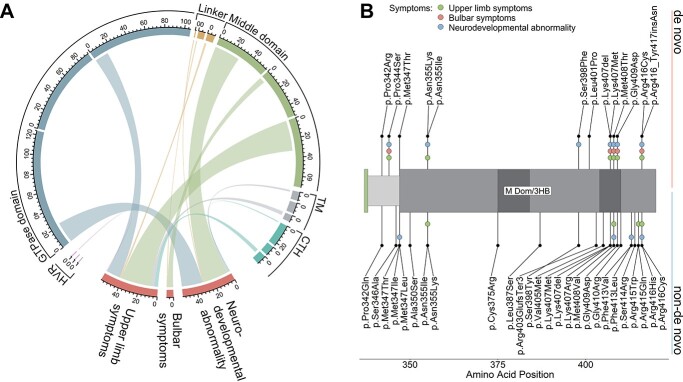
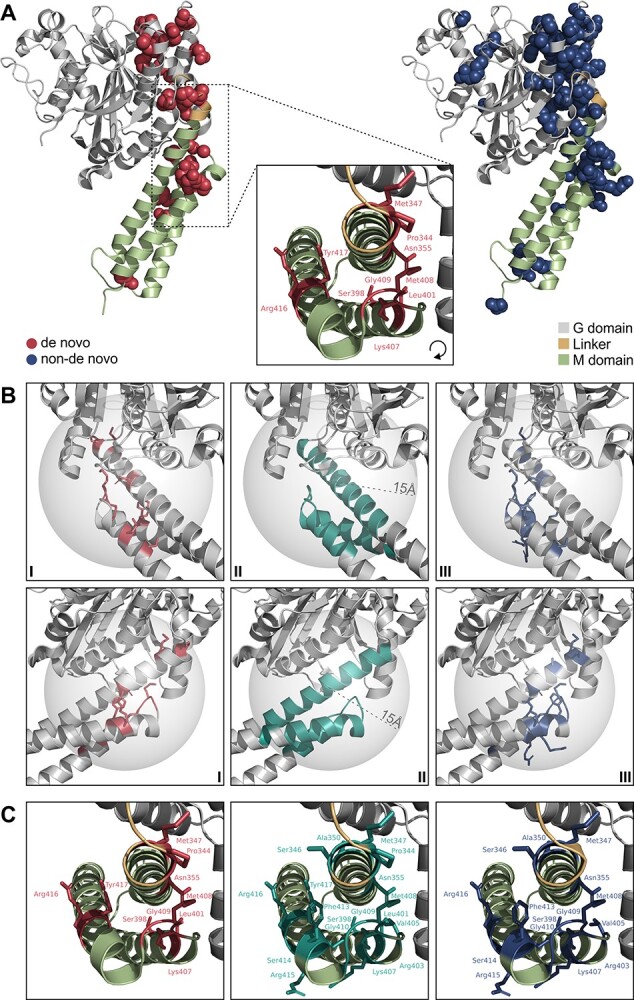
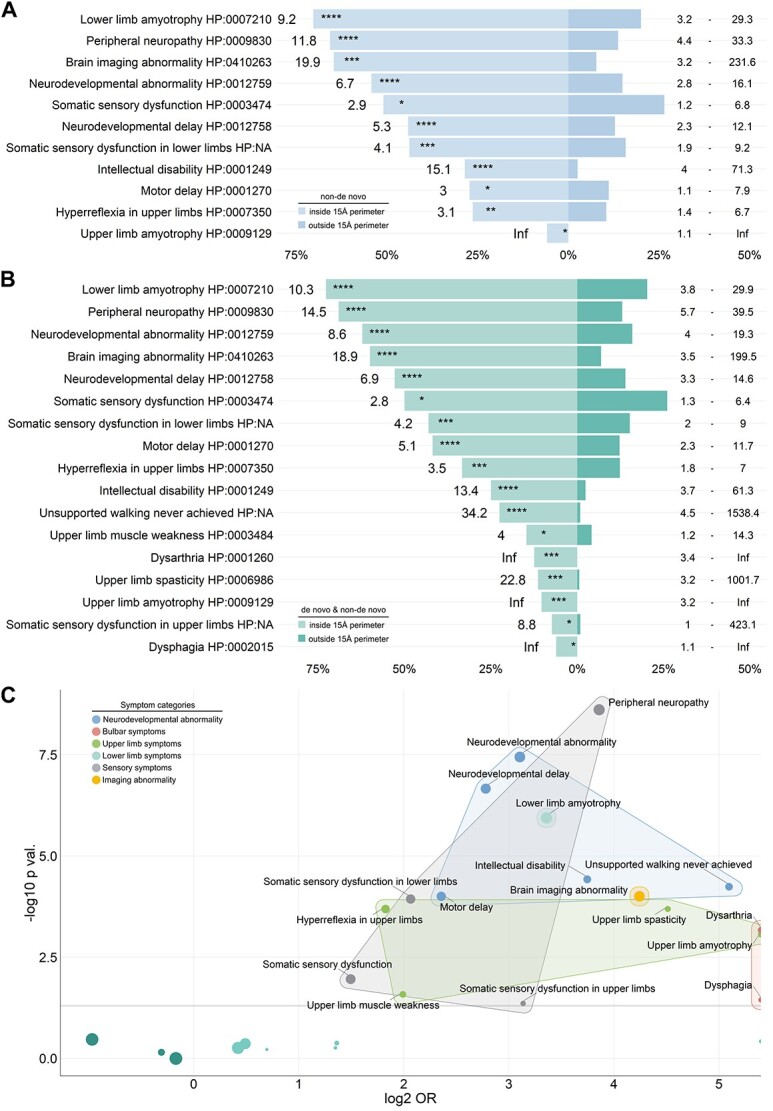
Pathogenic variants in ATL1 are a known cause of autosomal-dominantly inherited hereditary spastic paraplegia (HSP-ATL1, SPG3A) with a predominantly 'pure' HSP phenotype. Although a relatively large number of patients have been reported, no genotype-phenotype correlations have been established for specific ATL1 variants. Confronted with five children carrying de novo ATL1 variants showing early, complex and severe symptoms, we systematically investigated the molecular and phenotypic spectrum of HSP-ATL1. Through a cross-sectional analysis of 537 published and novel cases, we delineate a distinct phenotype observed in patients with de novo variants. Guided by this systematic phenotyping approach and structural modelling of disease-associated variants in atlastin-1, we demonstrate that this distinct phenotypic signature is also prevalent in a subgroup of patients with inherited ATL1 variants and is largely explained by variant localization within a three-dimensional mutational cluster. Establishing genotype-phenotype correlations, we find that symptoms that extend well beyond the typical pure HSP phenotype (i.e. neurodevelopmental abnormalities, upper limb spasticity, bulbar symptoms, peripheral neuropathy and brain imaging abnormalities) are prevalent in patients with variants located within this mutational cluster.


Figures

Graphical Abstract
Graphical Abstract
Figure 1
Figure 1
Phenotypes observed in probands and schematic of the atlastin-1 primary protein structure with novel variants and variant distribution. (A) Summary of the phenotypes observed in the five probands with de novo variants. Outer circle: proband number (Supplementary Material, Tables S1 and S2). Second to 11th circles: clinical symptoms, phenotype. White cells represent normal findings/absence of phenotype. (B) MR images of patients 4 and 5. Top row: Axial T2-weighted FLAIR images showing periventricular white matter changes in patient 4 at the age of 3 years and 11 months. Bottom right: Sagittal T1-weighted image showing thinning of the anterior aspects of the corpus callosum in patient 5 at the age of 12 months. (C) Disease-associated variants identified in the literature are annotated along the protein with dot color representing coding impact and dot size representing the number of cases identified. De novo variants are depicted towards the top and non-de novo variants downwards. Variants found in the probands appear in bold red letters. (D) Frequencies of coding impacts in de novo and non-de novo ATL1 variants depicted as percentage of all distinct variants shown in (C). (E) Frequencies of mutations in the functional domains of atlastin-1 depicted as percentage of all distinct variants shown in (C).
Figure 2
Figure 2
Comparison of the phenotypic spectrum in patients with de novo and non-de novo ATL1 variants. A total of 536 patients (nde novo = 31, nnon-de novo = 505; including the five probands identified in this study) were examined. (A) Frequencies of phenotypic features depicted as percentage of all patients (only patients who were explicitly examined for the feature were included in this retrospective analysis). Rounded percentages are depicted next to each bar. Statistical testing was performed using Fisher’s exact test followed by multiple hypothesis testing correction using the Benjamini–Hochberg procedure. (B) Estimated odds ratios for 11 phenotypic features significantly more frequent in patients with de novo variants compared to patients with inherited variants. Estimated odds ratios depicted to the left of each bar and 95%-confidence intervals depicted to the right end of each line. (C) Patients with de novo variants have a significantly earlier onset of symptoms (nde novo = 26, median = 12 months [IQR = 6.75]) compared to patients with non-de novo variants (nnon-de novo = 257, median = 36 months, [IQR = 93]); Mann–Whitney-U, P = 1.9e−9.
Figure 3
Figure 3
Variants associated with complex phenotypes are unevenly distributed among functional ATL1 domains. (A) Chord diagram depicting association of variant localization with the three symptom categories enriched in patients with de novo variants (Supplementary Material, Fig. S3). Each subsector reflects the absolute number of patients examined for symptoms of the respective symptom category, in relation to respective variant locations. Clockwise order of subsectors for each domain sector: developmental abnormality, bulbar symptoms, upper limb symptoms. Chord widths reflect the absolute number of patients positive for at least one symptom of the respective symptom category. (B) Section of the atlastin-1 primary structure depicting the linker region and N-terminal middle domain. De novo variants are depicted towards the top and non-de novo variants downwards. Colored dots indicate symptoms associated with respective variants. Abbreviations: HVR, hypervariable region; M Dom/3HB, middle domain/3 helix bundle; TM, transmembrane domain; CTH, C-terminal helix.
Figure 4
Figure 4
Variant distribution in three dimensional atlastin-1 structures. De novo variants associated with distinct, severe phenotypes, three-dimensionally cluster in the linker region and N-terminal M domain. (A) Wildtype prefusion GDP/Pi- and Mg2+-bound atlastin-1 (PDB 3Q5E, residues 1–447) with sites of de novo variants depicted as red spheres (left) and non-de novo variants as blue spheres (right). Black box indicating zoom-in view of the linker/middle (M) domain region, where variants associated with severe phenotypes cluster. (B) Localization of the cluster is approximated by creating the smallest possible sphere (radius 15 Å) containing all de novo variants associated with severe symptoms in this region (I, II). Hereby, non-de novo variants located within the cluster are identified (III). Protein region depicted from two different viewing angles (first and second row of panels). (C) Pathogenic variants located within the cluster. De novo variants depicted in red (left), non-de novo variants in blue (right) and all pathogenic variants within the cluster in teal (middle).
Figure 5
Figure 5
ATL1 variants located within the modelled cluster are associated with distinct and severe phenotypes. (A) Frequencies and odds ratios for phenotypic features significantly more frequent in patients with non-de novo variants located inside compared to variants located outside the perimeter of the modelled cluster. Estimated odds ratios depicted to the left and 95%-confidence intervals depicted to the right of each bar. Bar lengths reflect the percentages of patients exhibiting the respective clinical feature (only patients who were explicitly examined for the feature were included; nnon-de novo|inside cluster = 159, nnon-de novo|outside cluster = 346). (B) Frequencies and odds ratios for phenotypic features significantly enriched in patients with variants located inside compared to variants located outside the perimeter of the modelled cluster. Estimated odds ratios depicted to the left and 95%-confidence intervals depicted to the right of each bar. Bar lengths reflect the percentages of patients exhibiting the respective clinical feature (only patients who were explicitly examined for the feature were included; ninside cluster = 172, noutside cluster = 364). (C) Clinical features significantly enriched in patients with variants located within the modelled cluster can be assigned to five major categories. Estimated odds ratios plotted against P values for phenotypic features in patients with variants located inside compared to variants located outside the perimeter of the modelled cluster (significantly enriched features are labelled).

References

    1. Lange, L.M., Gonzalez-Latapi, P., Rajalingam, R., Tijssen, M.A.J., Ebrahimi-Fakhari, D., Gabbert, C., Ganos, C., Ghosh, R., Kumar, K.R., Lang, A.E. et al. (2022) Nomenclature of genetic movement disorders: recommendations of the International Parkinson and Movement Disorder Society Task Force—an update. Mov. Disord. First published on April 28, 2022, 37, 905–935. - PubMed
    1. Shribman, S., Reid, E., Crosby, A.H., Houlden, H. and Warner, T.T. (2019) Hereditary spastic paraplegia: from diagnosis to emerging therapeutic approaches. Lancet Neurol., 18, 1136–1146. - PubMed
    1. Elsayed, L.E.O., Eltazi, I.Z., Ahmed, A.E. and Stevanin, G. (2021) Insights into clinical, genetic, and pathological aspects of hereditary spastic paraplegias: a comprehensive overview. Front. Mol. Biosci. First published on November 26, 2021, 8. 10.3389/fmolb.2021.690899. - DOI - PMC - PubMed
    1. Erfanian Omidvar, M., Torkamandi, S., Rezaei, S., Alipoor, B., Omrani, M.D., Darvish, H. and Ghaedi, H. (2021) Genotype-phenotype associations in hereditary spastic paraplegia: a systematic review and meta-analysis on 13,570 patients. J. Neurol. First published on November 19, 2019, 268, 2065–2082. - PubMed
    1. Namekawa, M., Ribai, P., Nelson, I., Forlani, S., Fellmann, F., Goizet, C., Depienne, C., Stevanin, G., Ruberg, M., Dürr, A. et al. (2006) SPG3A is the most frequent cause of hereditary spastic paraplegia with onset before age 10 years. Neurology, 66, 112–114. - PubMed

Publication types

Supplementary concepts