. 2022 Aug 9;119(32):e2201286119.
doi: 10.1073/pnas.2201286119. Epub 2022 Aug 4.

Heat-hypersensitive mutants of ryanodine receptor type 1 revealed by microscopic heating

Affiliations

Heat-hypersensitive mutants of ryanodine receptor type 1 revealed by microscopic heating

Kotaro Oyama et al. Proc Natl Acad Sci U S A. .

Abstract

Thermoregulation is an important aspect of human homeostasis, and high temperatures pose serious stresses for the body. Malignant hyperthermia (MH) is a life-threatening disorder in which body temperature can rise to a lethal level. Here we employ an optically controlled local heat-pulse method to manipulate the temperature in cells with a precision of less than 1 °C and find that the mutants of ryanodine receptor type 1 (RyR1), a key Ca2+ release channel underlying MH, are heat hypersensitive compared with the wild type (WT). We show that the local heat pulses induce an intracellular Ca2+ burst in human embryonic kidney 293 cells overexpressing WT RyR1 and some RyR1 mutants related to MH. Fluorescence Ca2+ imaging using the endoplasmic reticulum-targeted fluorescent probes demonstrates that the Ca2+ burst originates from heat-induced Ca2+ release (HICR) through RyR1-mutant channels because of the channels' heat hypersensitivity. Furthermore, the variation in the heat hypersensitivity of four RyR1 mutants highlights the complexity of MH. HICR likewise occurs in skeletal muscles of MH model mice. We propose that HICR contributes an additional positive feedback to accelerate thermogenesis in patients with MH.

Keywords: calcium channel; heat-sensing; malignant hyperthermia; microheating; skeletal muscle.


Conflict of interest statement

The authors declare no competing interest.

Figures

Fig. 1.
Fig. 1.
Experimental design to investigate heat sensitivities of various MH mutants of RyR1. (A) Properties of MH mutants of RyR1 investigated in the present study. Ca2+ leakage through RyR1 mutants (higher rank) is greater than that through WT receptors (lowest rank). [Ca2+]i of cells expressing RyR1 mutants is higher than that of HEK 293 cells expressing WT RyR1. The [Ca2+] in sarco/endoplasmic reticulum ([Ca2+]SR/ER) is depleted because of Ca2+ leakage. The rank order of activity was based on the literature (15, 16). (B) Schematic illustration of the fluorescence microscopy setup used in the present study. A 1,455-nm IR laser beam was guided to the sample stage by a dichroic mirror (DM) and an objective lens, and focused on the medium. The temperature in the field of view was elevated locally (Materials and Methods). Sample temperature was controlled by a stage-top incubator. (C) Time courses of ΔT at various distances from the heat source. ΔT was measured on the surface of a glass base dish by thermal quenching of the temperature-sensitive dye europium (III) thenoyltrifluoroacetonate trihydrate. The pink vertical bar indicates the period of heating. Laser power was 25.6 mW. (D) Temperature gradients formed by various laser powers. Bottom panel shows the enlarged view of ΔTs between 0 and 2 °C. EMCCD, electron-multiplying charge-coupled device.
Fig. 2.
Fig. 2.
Heat-induced Ca2+ bursts in HEK293 cells expressing RyR1 mutants. (A and B) Bright-field and fluorescence images of fluo-4-loaded HEK293 cells expressing WT RyR1 (A) and R164C (B). Background intensity was slightly increased during heating due to IR laser-beam scattering (Movie S1). Yellow circles indicate the position of the heat source. Scale bars, 20 µm. (C) Changes in the fluorescence intensity of fluo-4 in cells without induction of RyR1 expression(−Dox) as a control, or with induction of the expression of WT RyR1, or the mutants (Q156K, R164C, or Y523S). Each gray line represents an individual cell. Changes in the background intensities caused by IR laser-beam scattering were subtracted from the fluo-4 signals (for raw data, see SI Appendix, Fig. S2A). Thick, colored lines indicate the average intensities. Pink vertical bars indicate the period of heating. In contrast to R164C cells, Q156K and Y523S cells showed a decrease in the fluorescence intensity during heating. (D) ΔFmax/F0 of fluo-4 during the 20 s after the onset of heating. Horizontal bars and boxes indicate means ± SEM. Statistical significance was determined by comparison with −Dox cells (n = 40) using the Steel test. ***P < 0.001. WT, n = 43 and P = 3.5 × 10⁻⁴; Q156K, n = 25 and P = 5.3 × 10⁻⁸; R164C, n = 27 and P = 1.5 × 10⁻¹¹; Y523S, n = 12 and P = 1.9 × 10⁻⁶. Laser power, 25.6 mW; ΔT = 10 ± 2 °C; T0 = 24 °C. (E) Time course of changes in the fluorescence intensity of fluo-4 in HEK293 cells at 36 °C. Changes in the background intensities caused by IR laser beam scattering were subtracted from the fluo-4 signals (for raw data, see SI Appendix, Fig. S2B). (F) ΔFmax/F0, analyzed from data in (E). Statistical significance was determined by comparison with −Dox cells (n = 49) using the Steel test. ***P < 0.001. n.s., not significant. WT, n = 38 and P = 0.99; Q156K, n = 16 and P = 0.97; R164C, n = 19 and P = 1.9 × 10⁻⁵; Y523S, n = 13 and P = 1.9 × 10⁻⁵. Laser power, 25.6 mW; ΔT = 10 ± 1 °C; T0 = 36 °C. a.u., arbitrary units.
Fig. 3.
Fig. 3.
Heat-induced Ca2+ bursts in R164C cells under various conditions. (A) Time courses of the fluorescence intensity of fluo-4 in HEK293 cells expressing R164C in an untreated condition, in Ca2+-free solution (Ca2+-free), and in the presence of 2 µM thapsigargin (Thap), 100 µM ryanodine (Rya), or 100 µM 2-APB. Each gray line represents an individual cell. Changes in the background intensities caused by IR laser-beam scattering were subtracted from the fluo-4 signals (for raw data, see SI Appendix, Fig. S4A). Thick, colored lines represent averages. Pink vertical bars indicate the period of heating. (B) ΔFmax/F0. Horizontal bars and boxes indicate means ± SEM. Statistical significance was examined by comparison with the untreated cells (n = 19) using the Steel test. ***P < 0.001. n.s., not significant. Ca2+-free: n = 12, P = 0.11; Thap, 4.7 × 10⁻⁴ (n = 7); Rya, 4.1 × 10⁻⁵ (n = 11); and 2-APB, 0.83 (n = 10). Laser power, 25.6 mW; ΔT = 10 ± 1 °C; T0 = 36 °C. Note that despite the lack of a significant difference in maximal amplitudes, the kinetics of the fluo-4 intensity in Ca2+-free solution differed from that in untreated-cells. a.u., arbitrary units.
Fig. 4.
Fig. 4.
Heat-induced Ca2+ release from the ER. (A) ΔF/F0 of G-CEPIA1er in cells expressing WT RyR1, or the mutants (Q156K, R164C, or Y523S). Data in SI Appendix, Fig. S5A were analyzed and plotted. n = 23, 23, 17, and 17 cells for WT, Q156K, R164C, and Y523S, respectively. Each gray line represents an individual cell. Changes in the background intensities caused by IR laser-beam scattering were subtracted from the G-CEPIA1er signals (for raw data, see SI Appendix, Fig. S5A). Thick, colored lines represent averages. Pink vertical bars indicate the period of heating. The second decrease in ΔF/F0 is indicated by an arrowhead in the averaged data (thick curves for WT, Q156K, and R164C). The decrease in ΔF/F0 in some cells (indicated by an open arrow) during heating is presumably the result of thermal quenching of G-CEPIA1er. (B) Minimum relative change in G-CEPIA1er fluorescence intensity −ΔFmin/F0 after heating for 2.4 to 10 s. Statistical significance was determined by comparison with WT using the Steel test. **P < 0.01; ***P < 0.001. n.s., not significant. WT + thapsigargin (Thap), P = 9.0 × 10⁻⁸ (n = 22); Q156K, P = 0.087; R164C, P = 0.0037 (R164C); and Y523S, P = 9.8 × 10⁻⁷. Horizontal bars and boxes indicate means ± SEM. (C) Relationship between the change in [Ca2+]er (−ΔFmin/F0 of G-CEPIA1er) and [Ca2+]iFmax/F0 of fluo-4; Fig. 2F). Correlation coefficient (R) was 0.96 (P = 0.011). Laser power, 25.6 mW; ΔT = 10 ± 1 °C; T0 = 36 °C.
Fig. 5.
Fig. 5.
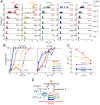
Rank order of RyR1 mutants for heat sensitivity. (A) Histograms showing increases in [Ca2+]iFmax/F0 of fluo-4) in response to heat pulses of various amplitudes in ΔT. The number at the upper right of row in each panel indicates the response probability of cells showing significant increases in [Ca2+]iFmax/F0Fth). Data in SI Appendix, Fig. S6 were analyzed and plotted. T0 = 36 °C. (B) Relationship between ΔT and the response probability. The response probability reached 50% at ΔTth. (C) Relationship between T0 and ΔTth. Rank order in ΔTth at T0 = 36 °C was R164C (1.4 °C) = R164L (1.4 °C) < Y523S (4.3 °C) < Q156K (4.9 °C) < WT (5.8 °C). The rank order at T0 = 24 °C was R164L (1.4 °C) ∼R164C (1.8 °C) < Y523S (3.8 °C) < Q156K (7.9 °C) < WT (11.5 °C). (D) Schematic illustration of proposed positive feedback loop closed by HICR showing MH initiation and progression of the disease. Anesthesia-triggered Ca2+ leak through MH RyR1 mutants induces hyperthermia. The temperature rise destabilizes RyR1 and causes HICR.
Fig. 6.
Fig. 6.
Heat-induced Ca2+ bursts in skeletal muscles expressing RyR1 mutant R2509C. (A) Confocal images of Cal-520–loaded muscles isolated from WT (Top) or R2509C (Bottom) mice before (Left; t = 0 s) and during heating (Middle; t = 5 s). The microscope and Ca2+ indicator employed in this experiment were different from those used for HEK293 cells except for R2508C (SI Appendix, Materials and Methods). The right-most figures indicate the differences in fluorescence intensity between t = 0 and 5 s (ΔF). ΔT = 3.5 °C, T0 = 23 °C. Scale bars, 50 µm. (B) Time course of the fluorescence intensity of Cal-520–loaded muscles isolated from WT (Left) or R2509C (Right) mice. Each gray line represents an individual cell. Thick, colored lines indicate average intensities. Pink vertical bars indicate the periods of the heat pulses. ΔT = 3.5 ± 0.5 °C, T0 = 23 °C. (C) Maximum changes in relative fluorescence intensity of Cal-520 ΔFmax/F0 after the onset of heating. Horizontal bars and boxes indicate means ± SEM. Statistical significance was determined by comparison with WT cells, using the Mann–Whitney U test. ***P < 0.001. WT, n = 18; R2509C, n = 16; and P = 6.2 × 10⁻⁷ for ΔT = 3.5 ± 0.5 °C, T0 = 23 °C. WT, n = 13; R2509C, n = 15; and P = 1.5 × 10⁻⁵ for ΔT = 9 ± 1 °C, T0 = 23 °C. (D) Time course of the fluorescence intensity of Cal-520-loaded muscles isolated from WT (Left) or R2509C (Right) mice at T0 = 36.5 °C. ΔT = 4.0 ± 0.5 °C. (E) Maximum changes in the relative fluorescence intensity of Cal-520 ΔFmax/F0 after the onset of heating. T0 = 36.5 °C; ΔT = 4.0 ± 0.5 °C. Horizontal bars and boxes indicate means ± SEM. Statistical significance was determined by comparison with WT cells, using the Mann–Whitney U test. ***P < 0.001. WT, n = 15; R2509C, n = 21; and P = 1.2 × 10⁻⁶. a.u., arbitrary units.

Similar articles

Cited by

References

    1. Lanner J. T., Georgiou D. K., Joshi A. D., Hamilton S. L., Ryanodine receptors: Structure, expression, molecular details, and function in calcium release. Cold Spring Harb. Perspect. Biol. 2, a003996 (2010). - PMC - PubMed
    1. Rosenberg H., Pollock N., Schiemann A., Bulger T., Stowell K., Malignant hyperthermia: A review. Orphanet J. Rare Dis. 10, 93 (2015). - PMC - PubMed
    1. Hwang J. H., Zorzato F., Clarke N. F., Treves S., Mapping domains and mutations on the skeletal muscle ryanodine receptor channel. Trends Mol. Med. 18, 644–657 (2012). - PubMed
    1. Riazi S., Kraeva N., Hopkins P. M., Malignant hyperthermia in the post-genomics era: New perspectives on an old concept. Anesthesiology 128, 168–180 (2018). - PMC - PubMed
    1. Ibarra Moreno C. A., et al. , An assessment of penetrance and clinical expression of malignant hyperthermia in individuals carrying diagnostic ryanodine receptor 1 gene mutations. Anesthesiology 131, 983–991 (2019). - PMC - PubMed

Publication types

LinkOut - more resources