Economic complexity of cities and its role for resilience
- PMID: 35925920
- PMCID: PMC9352037
- DOI: 10.1371/journal.pone.0269797
Economic complexity of cities and its role for resilience
Abstract
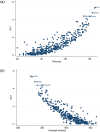
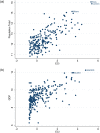
The aim of the paper is to propose the construction of an index that captures the economic complexity of cities over the globe, as well as to explore whether it is a good predictor for a range of city-level economic outcomes. This index aspires to mitigate data scarcity for cities and to provide policy makers with the tools for monitoring the evolving role of cities in the global economy. Analytically, we implement the economic complexity methodology on data for the ownership, location and economic activities of the world's 3,000 largest firms and their subsidiaries to propose a new indicator that quantifies the network of the largest cities worldwide and the economic activities of their globalized firms. We first show that complex cities are the highly diversified cities that host non-ubiquitous economic activities of firms with global presence. Then, in a sample of EU cities, we show that complex cities tend to be more prosperous, have higher population, and are associated with more jobs, human capital, innovation, technology and transport infrastructure. Last, using OLS methodology and accounting for several other confounders, we show that a higher ECI, at the city level, enhances the resilience of cities to negative economic shocks, i.e., their ability to bounce back after a shock. Specifically, we find that the expected increase of the ratio of employment in 2012 over 2006 is 0.01 (mean: 0.992; standard deviation: 0.081) when the ECI increases by 1 unit (mean: 0.371; standard deviation: 1.094), i.e., a satisfactory pace of recovery, in terms of employment. The ability to diversify in the presence of a shock, the reallocation of factors of production to other sectors and the ability to extract rents associated with those diversified activities, uncovers the mechanics of the ECI index.
Conflict of interest statement
The authors have declared that no competing interests exist.
Figures


Similar articles
-
[Third World cities: points of accumulation, centers of distribution].Tiers Monde (1960). 1985 Oct-Dec;26(104):823-40. Tiers Monde (1960). 1985. PMID: 12267619 French.
-
[The evolution of employment in Mexico: 1895-1980].Estud Demogr Urbanos Col Mex. 1987 May-Aug;2(2):189-230, 381. Estud Demogr Urbanos Col Mex. 1987. PMID: 12314997 Spanish.
-
Can urban e-commerce transformation improve economic resilience? a quasi-natural experiment from China.PLoS One. 2024 May 31;19(5):e0304014. doi: 10.1371/journal.pone.0304014. eCollection 2024. PLoS One. 2024. PMID: 38820417 Free PMC article.
-
[The participation of women in urban labor markets in Mexico: 1970-1980].Estud Demogr Urbanos Col Mex. 1989 Sep-Dec;4(3):465-93, 625. Estud Demogr Urbanos Col Mex. 1989. PMID: 12283043 Spanish.
-
Assessing the Impacts of COVID-19 on the Industrial Sectors and Economy of China.Risk Anal. 2022 Jan;42(1):21-39. doi: 10.1111/risa.13805. Epub 2021 Aug 26. Risk Anal. 2022. PMID: 34448216 Free PMC article. Review.
References
-
- Storper M. The regional world: territorial development in a global economy. (Guilford press,1997).
-
- Sit V. & Yang C. Foreign-investment-induced exo-urbanisation in the Pearl River Delta, China. Urban Studies. 34, 647–677 (1997). doi: 10.1080/0042098975961 - DOI
-
- Turnock D. Urban and regional restructuring in Eastern Europe: the role of foreign investment. GeoJournal. 42, 457–464 (1997). doi: 10.1023/A:1006816316788 - DOI
-
- Wu F. Place promotion in Shanghai, PRC. Cities. 17, 349–361 (2000). doi: 10.1016/S0264-2751(00)00031-7 - DOI
-
- Dick H. & Rimmer P. Beyond the third world city: the new urban geography of South-east Asia. Urban Studies. 35, 2303–2321 (1998). doi: 10.1080/0042098983890 - DOI
MeSH terms
LinkOut - more resources
Full Text Sources

