. 2022 Aug 4;17(8):e0272141.
doi: 10.1371/journal.pone.0272141. eCollection 2022.

Characterization of social behavior in young and middle-aged ChAT-IRES-Cre mouse

Affiliations

Characterization of social behavior in young and middle-aged ChAT-IRES-Cre mouse

Cyril Lhopitallier et al. PLoS One. .

Abstract

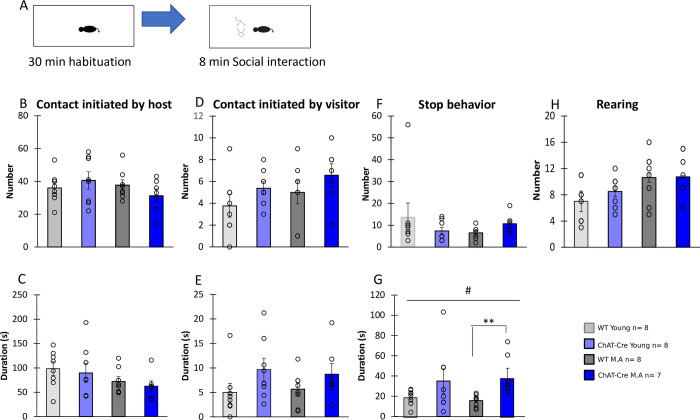
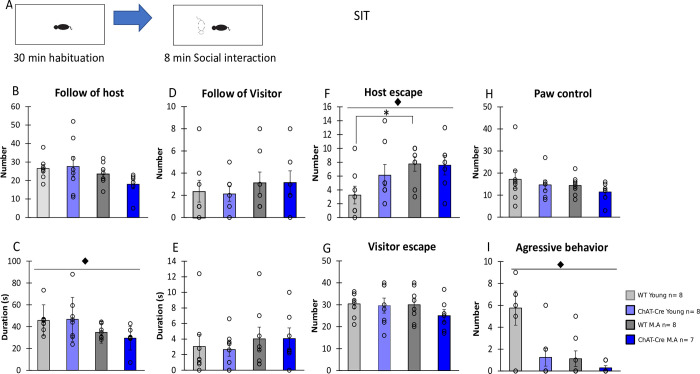
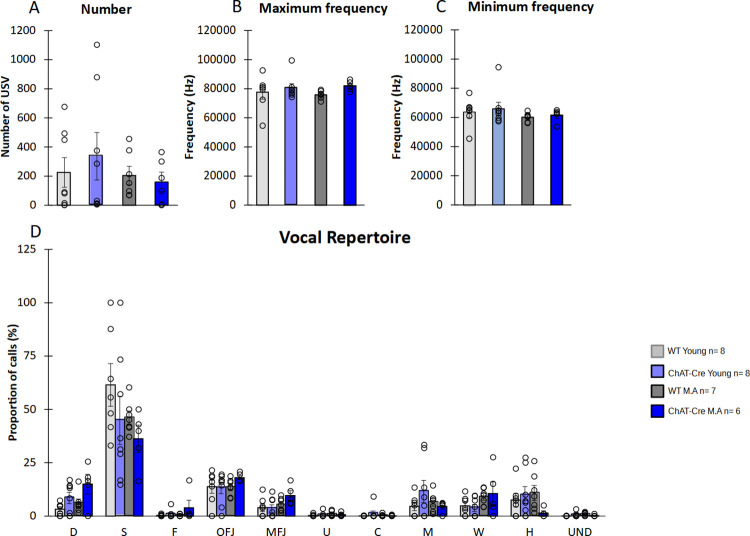
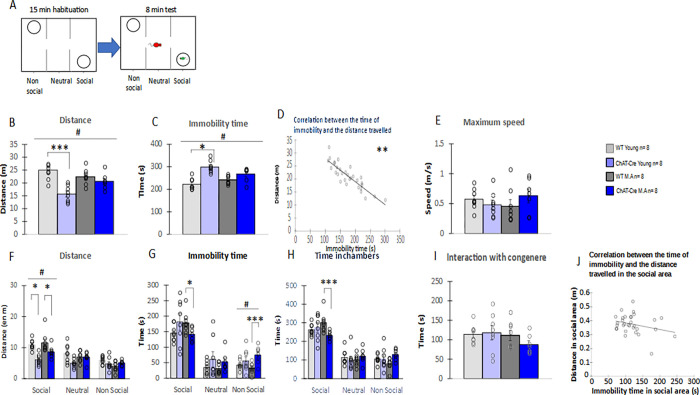
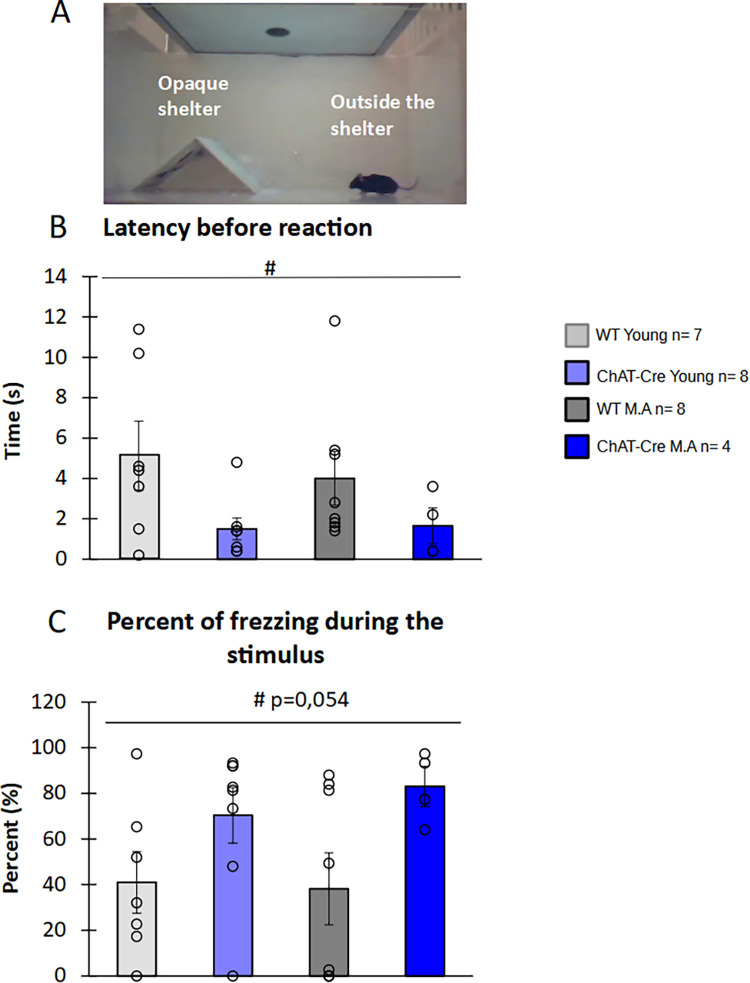
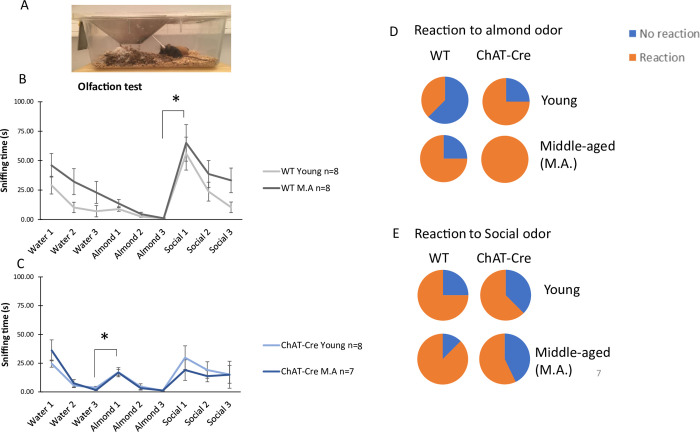
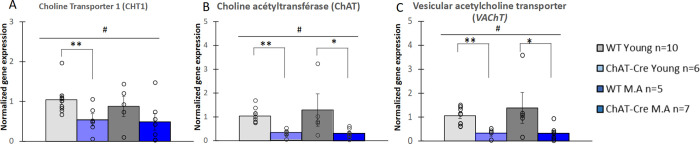
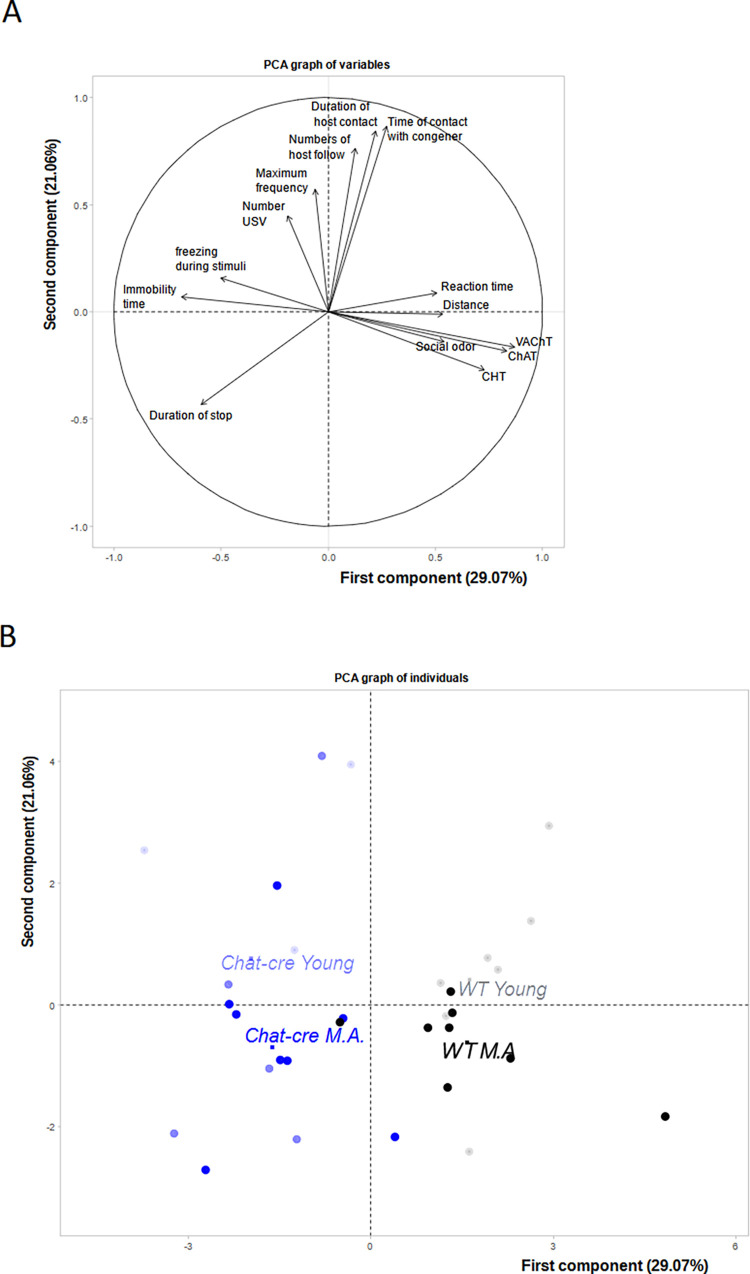
The cholinergic system is an important modulator of brain processes. It contributes to the regulation of several cognitive functions and emotional states, hence altering behaviors. Previous works showed that cholinergic (nicotinic) receptors of the prefrontal cortex are needed for adapted social behaviors. However, these data were obtained in mutant mice that also present alterations of several neurotransmitter systems, in addition to the cholinergic system. ChAT-IRES-Cre mice, that express the Cre recombinase specifically in cholinergic neurons, are useful tools to investigate the role of the cholinergic circuits in behavior. However, their own behavioral phenotype has not yet been fully characterized, in particular social behavior. In addition, the consequences of aging on the cholinergic system of ChAT-IRES-Cre mice has never been studied, despite the fact that aging is known to compromise the cholinergic system efficiency. The aim of the current study was thus to characterize the social phenotype of ChAT-IRES-Cre mice both at young (2-3 months) and middle (10-11 months) ages. Our results reveal an alteration of the cholinergic system, evidenced by a decrease of ChAT, CHT and VAChT gene expression in the striatum of the mice, that was accompanied by mild social disturbances and a tendency towards anxiety. Aging decreased social dominance, without being amplified by the cholinergic alterations. Altogether, this study shows that ChAT-IRES-Cre mice are useful models for studying the cholinergic system's role in social behavior using appropriate modulating technics (optogenetic or DREADD).


Conflict of interest statement

The authors have declared that no competing interests exist.

Figures

Fig 1
Fig 1. Timeline of experiments.
In the social interaction and in the three-chamber tasks, the black mouse represents the Host mouse and the white mouse represents the Visitor mouse.
Fig 2
Fig 2. Contact; stop and exploration in the Social Interaction Task.
A) Schematic representation of the social interaction task. B) Number of contacts initiated by Host mice. C) Duration of contact initiated by Host mice. D) Number of contacts initiated by Visitor mice. E) Duration of contact initiated by Visitor mice. F) Number of stops episodes. G) Duration of stop episodes. H) Number of rearings made by Host mice. Host mice were previously isolated for 3 weeks and exposed to the novel experimental environment for 30 minutes before being presented with a visitor mouse: WT young n = 8, ChAT-Cre young n = 8, WT Middle Age n = 8, ChAT-Cre Middle Age n = 7. Visitor mice (young n = 6 and middle age n = 6) were WTs of same age and sex maintained in a social cage before the experiment. Data are presented as means ± SE; *p < 0.05; **p<0.01; ***p<0.001; Kruskal-Wallis rank-sum test analysis then Wilcoxon and d signed-rank tests were applied when appropriate. # represents the genotype effect and ◆ the age effect. Kruskal-Wallis results were not represented for simplicity.
Fig 3
Fig 3. Behavior in the Social Interaction Task.
A) Schematic representation of the social interaction task procedure. B) Number of follow episodes made by Host mice. C) Duration of follow episodes (i.e., following while making oro-genital contact) made by Host mice. D) Number of follow episodes made by Visitor mice. E) Duration of follow episodes made by Visitor mice. F) Number of escape (i.e., interuption of contact) episodes made by Host mice. G) Number of escape episodes made by Visitor mice H) Number of paw control made by Host mice (i.e., number of times Host mice put their forepaws on the head or back of Visitor mice). I) Number of aggressive episodes of Host mice. WT young n = 8, ChAT-Cre young n = 8, WT Middle Age n = 8, ChAT-Cre Middle Age n = 7. Visitor mice (young n = 6 and middle age n = 6). Data are presented as means ± SE; *p < 0.05; **p<0.01; ***p<0.001; Kruskal-Wallis rank-sum test analysis then Wilcoxon and d signed-rank tests were applied when appropriate. # represents the genotype effect and ◆ the age effect. Kruskal-Wallis results were not represented for simplicity.
Fig 4
Fig 4. Ultrasonic vocalizations (USVs) emitted during SIT.
A) Number of USV. B) Maximum frequency of USVs. C) Minimum frequency of USVs. D) Diversity of USVs recorded. WT young n = 8, ChAT-Cre young n = 8, WT Middle Age n = 8, ChAT-Cre Middle Age n = 7. Visitor mice (young n = 6 and middle age n = 6). Data are presented as means ± SE; *p < 0.05; **p<0.01; ***p<0.001; Kruskal-Wallis rank-sum test analysis then Wilcoxon and d signed-rank tests were applied when appropriate. # represents the genotype effect and ◆ the age effect. Kruskal-Wallis results were not represented for simplicity.
Fig 5
Fig 5. Behavior in the 3-chamber task.
A) Procedure. Host mice used for this experiment were WT Young n = 8; ChAT-Cre Young n = 8; WT Middle Age (M.A) n = 8; ChAT-Cre Middle Age (M.A) n = 7. The visitor mice used were all WTs of same age and sex than host mice (young n = 6, M.A. n = 6) maintained in social cages. B) Distance travelled. C) Immobility time. D) Correlation between the time of immobility and the distance travelled. E) Maximum speed. F) Distance travelled in chambers. G) Immobility time in chambers. H) Time spent in chambers I) Time of interaction with the congener. J) Correlation between the time of immobility and the distance travelled in the social area. Data are presented as means ± SE; *p < 0.05; **p<0.01; ***p<0.001; Kruskal-Wallis rank-sum test analysis then Wilcoxon and d signed-rank tests were applied when appropriate. # represents the genotype effect and υ the age effect. Kruskal-Wallis results were not represented for simplicity.
Fig 6
Fig 6. Behavioral response to threatening stimulus.
A) Schematic representation the looming experiment. B) Latency of flight or freeze responses. C) Percentage of freezing time. Were only considered mice which were outside of the shelter when the looming stimulus occurred. WT young n = 7, ChAT-Cre young n = 8, WT Middle Age n = 8, ChAT-Cre Middle Age n = 4. Data are presented as means ± SE; *p < 0.05; **p<0.01; ***p<0.001; Kruskal-Wallis rank-sum test analysis then Wilcoxon and d signed-rank tests were applied when appropriate. # represents the genotype effect and ◆ the age effect. Kruskal-Wallis results were not represented for simplicity.
Fig 7
Fig 7. Results of olfaction task.
A) Picture of the cotton swabs presentation in home cages. B) Time of sniffing cotton swabs with the successive odor presentation of WT mice. C) Time of sniffing cotton swabs with the successive odor presentation of ChAT-Cre mice. D) Percentage mice reacting to almond odor. E) Percentage mice reacting to social odor. WT young n = 7, ChAT-Cre young n = 8, WT Middle Age (M.A.) n = 8, ChAT-Cre Middle Age n = 4. Data are presented as means ± SE; *p < 0.05; **p<0.01; ***p<0.001; Kruskal-Wallis rank-sum test analysis then Wilcoxon and d signed-rank tests were applied when appropriate. # represents the genotype effect and ◆ the age effect. Kruskal-Wallis results were not represented for simplicity.
Fig 8
Fig 8. Analysis of CHT, ChAT and VAChT gene expression in the dorsal striatum.
Quantification of CHT-mRNAs (A), ChAT-mRNAs (B) and VAChT-mRNAs (C) by RT-qPCR. mRNA levels are presented relative to the young WT group. WT young n = 10, ChAT-Cre young n = 6, WT Middle Age (M.A.) n = 5, ChAT-Cre Middle Age n = 7. Data are presented as means ± SE; *p < 0.05; **p<0.01; ***p<0.001; Kruskal-Wallis rank-sum test analysis then Wilcoxon and d signed-rank tests were applied when appropriate. # represents the genotype effect and ◆ the age effect. Kruskal-Wallis results were not represented for simplicity.
Fig 9
Fig 9. Illustration of principal component analyses performed on behavioral and gene expression parameters.
A) Vector representation of the contribution of each parameters. The coordinates of each variable are the correlation coefficients with the two principal components (described in detail in Table 1). Between vectors and between a vector and an axis, there is positive or a negative significant correlation. B) Individual repartition on each individual in variable factor map. The first component explaining about 30% of the data separates WT from ChAT-Cre mice while the second component explaining about 21% of the data separates young mice from middle age mice.
Fig 10
Fig 10. Repartition of each group on the two main components of PCA.
A) Repartition of each group on the first main component B) Repartition of each group on the second component. WT young n = 8, ChAT-Cre young n = 8, WT Middle Age (M.A.) n = 8, ChAT-Cre Middle Age n = 7. Data are presented as means ± SE; *p < 0.05; **p<0.01; ***p<0.001; Kruskal-Wallis rank-sum test analysis then Wilcoxon and d signed-rank tests were applied when appropriate. # represents the genotype effect and ◆ the age effect. Kruskal-Wallis results were not represented for simplicity.

Similar articles

Cited by

References

    1. Prado VF, Janickova H, Al-Onaizi MA, Prado MAM. Cholinergic circuits in cognitive flexibility. Neuroscience. 14 mars 2017;345:130‑41. doi: 10.1016/j.neuroscience.2016.09.013 - DOI - PubMed
    1. Mesulam MM, Mufson EJ, Wainer BH, Levey AI. Central cholinergic pathways in the rat: an overview based on an alternative nomenclature (Ch1-Ch6). Neuroscience. déc 1983;10(4):1185‑201. doi: 10.1016/0306-4522(83)90108-2 - DOI - PubMed
    1. Bloem B, Poorthuis RB, Mansvelder HD. Cholinergic modulation of the medial prefrontal cortex: the role of nicotinic receptors in attention and regulation of neuronal activity. Front Neural Circuits. 2014;8:17. doi: 10.3389/fncir.2014.00017 - DOI - PMC - PubMed
    1. Gritton HJ, Howe WM, Mallory CS, Hetrick VL, Berke JD, Sarter M. Cortical cholinergic signaling controls the detection of cues. Proc Natl Acad Sci U S A. 23 févr 2016;113(8):E1089‑97. doi: 10.1073/pnas.1516134113 - DOI - PMC - PubMed
    1. dos Santos Coura R, Granon S. Prefrontal neuromodulation by nicotinic receptors for cognitive processes. Psychopharmacology (Berl). mai 2012;221(1):1‑18. doi: 10.1007/s00213-011-2596-6 - DOI - PubMed

LinkOut - more resources