

A skewed literature: Few studies evaluate the contribution of predation-risk effects to natural field patterns
- PMID: 35925978
- PMCID: PMC9545701
- DOI: 10.1111/ele.14075
A skewed literature: Few studies evaluate the contribution of predation-risk effects to natural field patterns
Abstract
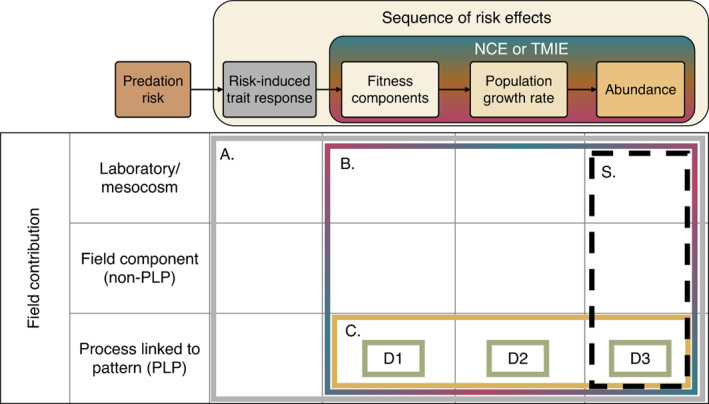
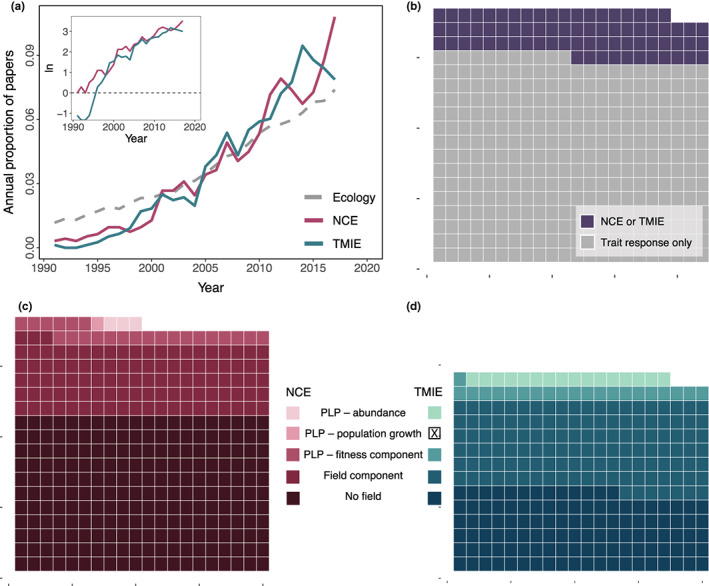
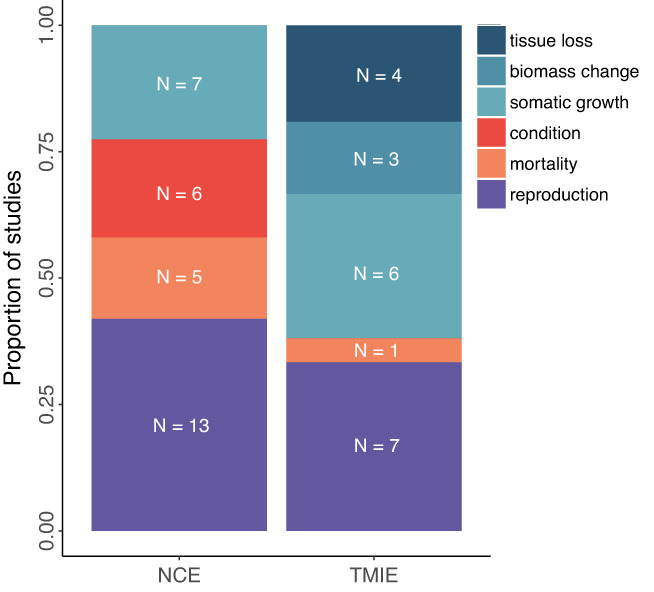
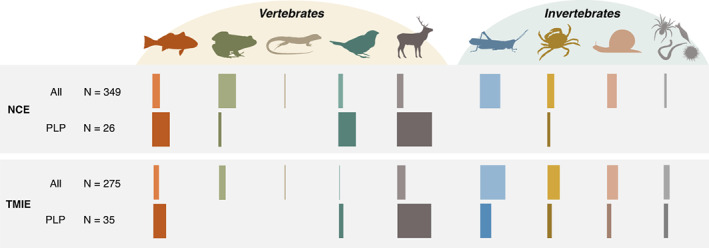
A narrative in ecology is that prey modify traits to reduce predation risk, and the trait modification has costs large enough to cause ensuing demographic, trophic and ecosystem consequences, with implications for conservation, management and agriculture. But ecology has a long history of emphasising that quantifying the importance of an ecological process ultimately requires evidence linking a process to unmanipulated field patterns. We suspected that such process-linked-to-pattern (PLP) studies were poorly represented in the predation risk literature, which conflicts with the confidence often given to the importance of risk effects. We reviewed 29 years of the ecological literature which revealed that there are well over 4000 articles on risk effects. Of those, 349 studies examined risk effects on prey fitness measures or abundance (i.e., non-consumptive effects) of which only 26 were PLP studies, while 275 studies examined effects on other interacting species (i.e., trait-mediated indirect effects) of which only 35 were PLP studies. PLP studies were narrowly focused taxonomically and included only three that examined unmanipulated patterns of prey abundance. Before concluding a widespread and influential role of predation-risk effects, more attention must be given to linking the process of risk effects to unmanipulated patterns observed across diverse ecosystems.
Keywords: fear; natural experiment; non-consumptive; non-lethal; observational; plasticity; predation risk; process from pattern; trait mediated; trait response.
© 2022 The Authors. Ecology Letters published by John Wiley & Sons Ltd.
Figures
Similar articles
-
Non-consumptive predator effects on prey population size: A dearth of evidence.J Anim Ecol. 2020 Jun;89(6):1302-1316. doi: 10.1111/1365-2656.13213. Epub 2020 Apr 20. J Anim Ecol. 2020. PMID: 32215909 Review.
-
A framework and standardized terminology to facilitate the study of predation-risk effects.Ecology. 2020 Dec;101(12):e03152. doi: 10.1002/ecy.3152. Epub 2020 Oct 25. Ecology. 2020. PMID: 32736416
-
Consumptive and non-consumptive effects of predators vary with the ontogeny of their prey.Ecology. 2019 May;100(5):e02649. doi: 10.1002/ecy.2649. Epub 2019 Apr 8. Ecology. 2019. PMID: 30958570
-
Prey state shapes the effects of temporal variation in predation risk.Proc Biol Sci. 2014 Dec 7;281(1796):20141952. doi: 10.1098/rspb.2014.1952. Proc Biol Sci. 2014. PMID: 25339716 Free PMC article.
-
The many faces of fear: a synthesis of the methodological variation in characterizing predation risk.J Anim Ecol. 2017 Jul;86(4):749-765. doi: 10.1111/1365-2656.12680. Epub 2017 May 15. J Anim Ecol. 2017. PMID: 28390066 Review.
Cited by
-
Similar Conditions With Opposite Effects: Predation-Risk Effects on Prey Abundance Are Highly Contingent.Ecol Evol. 2025 Jan 15;15(1):e70861. doi: 10.1002/ece3.70861. eCollection 2025 Jan. Ecol Evol. 2025. PMID: 39823113 Free PMC article.
-
Long-term anti-predator learning and memory differ across populations and sexes in an intertidal snail.Proc Biol Sci. 2024 Oct;291(2032):20240944. doi: 10.1098/rspb.2024.0944. Epub 2024 Oct 9. Proc Biol Sci. 2024. PMID: 39378993 Free PMC article.
-
Early-life, but not late-life, exposure to predator cues reduce the lifespan and reproductive output of freshwater snails.Oecologia. 2025 Aug 7;207(8):139. doi: 10.1007/s00442-025-05779-0. Oecologia. 2025. PMID: 40775115
-
Large mammal behavioral defenses induced by the cues of human predation.PNAS Nexus. 2024 Sep 3;3(9):pgae382. doi: 10.1093/pnasnexus/pgae382. eCollection 2024 Sep. PNAS Nexus. 2024. PMID: 39282006 Free PMC article. Review.
-
Acceleration Data Reveal Behavioural Responses to Hunting Risk in Scandinavian Brown Bears.Ecol Evol. 2025 Jun 4;15(6):e71489. doi: 10.1002/ece3.71489. eCollection 2025 Jun. Ecol Evol. 2025. PMID: 40475876 Free PMC article.
References
-
- Abrams, P.A. (1984) Foraging time optimization and interactions in food webs. American Naturalist, 124, 80–96.
-
- Abrams, P.A. (1991) Life history and the relationship between food availability and foraging effort. Ecology, 72, 1242–1252.
-
- Abrams, P.A. (2008) Measuring the impact of dynamic antipredator traits on predator‐prey‐ resource interactions. Ecology, 89, 1640–1649. - PubMed
-
- Abrams, P.A. (2010) Implications of flexible foraging for interspecific interactions: lessons from simple models. Functional Ecology, 24, 7–17.
-
- Agrawal, A.A. (2001) Phenotypic plasticity in the interactions and evolution of species. Science, 294, 321–326. - PubMed
Publication types
MeSH terms
Grants and funding
LinkOut - more resources
Full Text Sources
Research Materials
