. 2022 Aug 5;377(6606):660-666.
doi: 10.1126/science.abg5645. Epub 2022 Aug 4.

A conserved Bacteroidetes antigen induces anti-inflammatory intestinal T lymphocytes

Affiliations

A conserved Bacteroidetes antigen induces anti-inflammatory intestinal T lymphocytes

Djenet Bousbaine et al. Science. .

Abstract

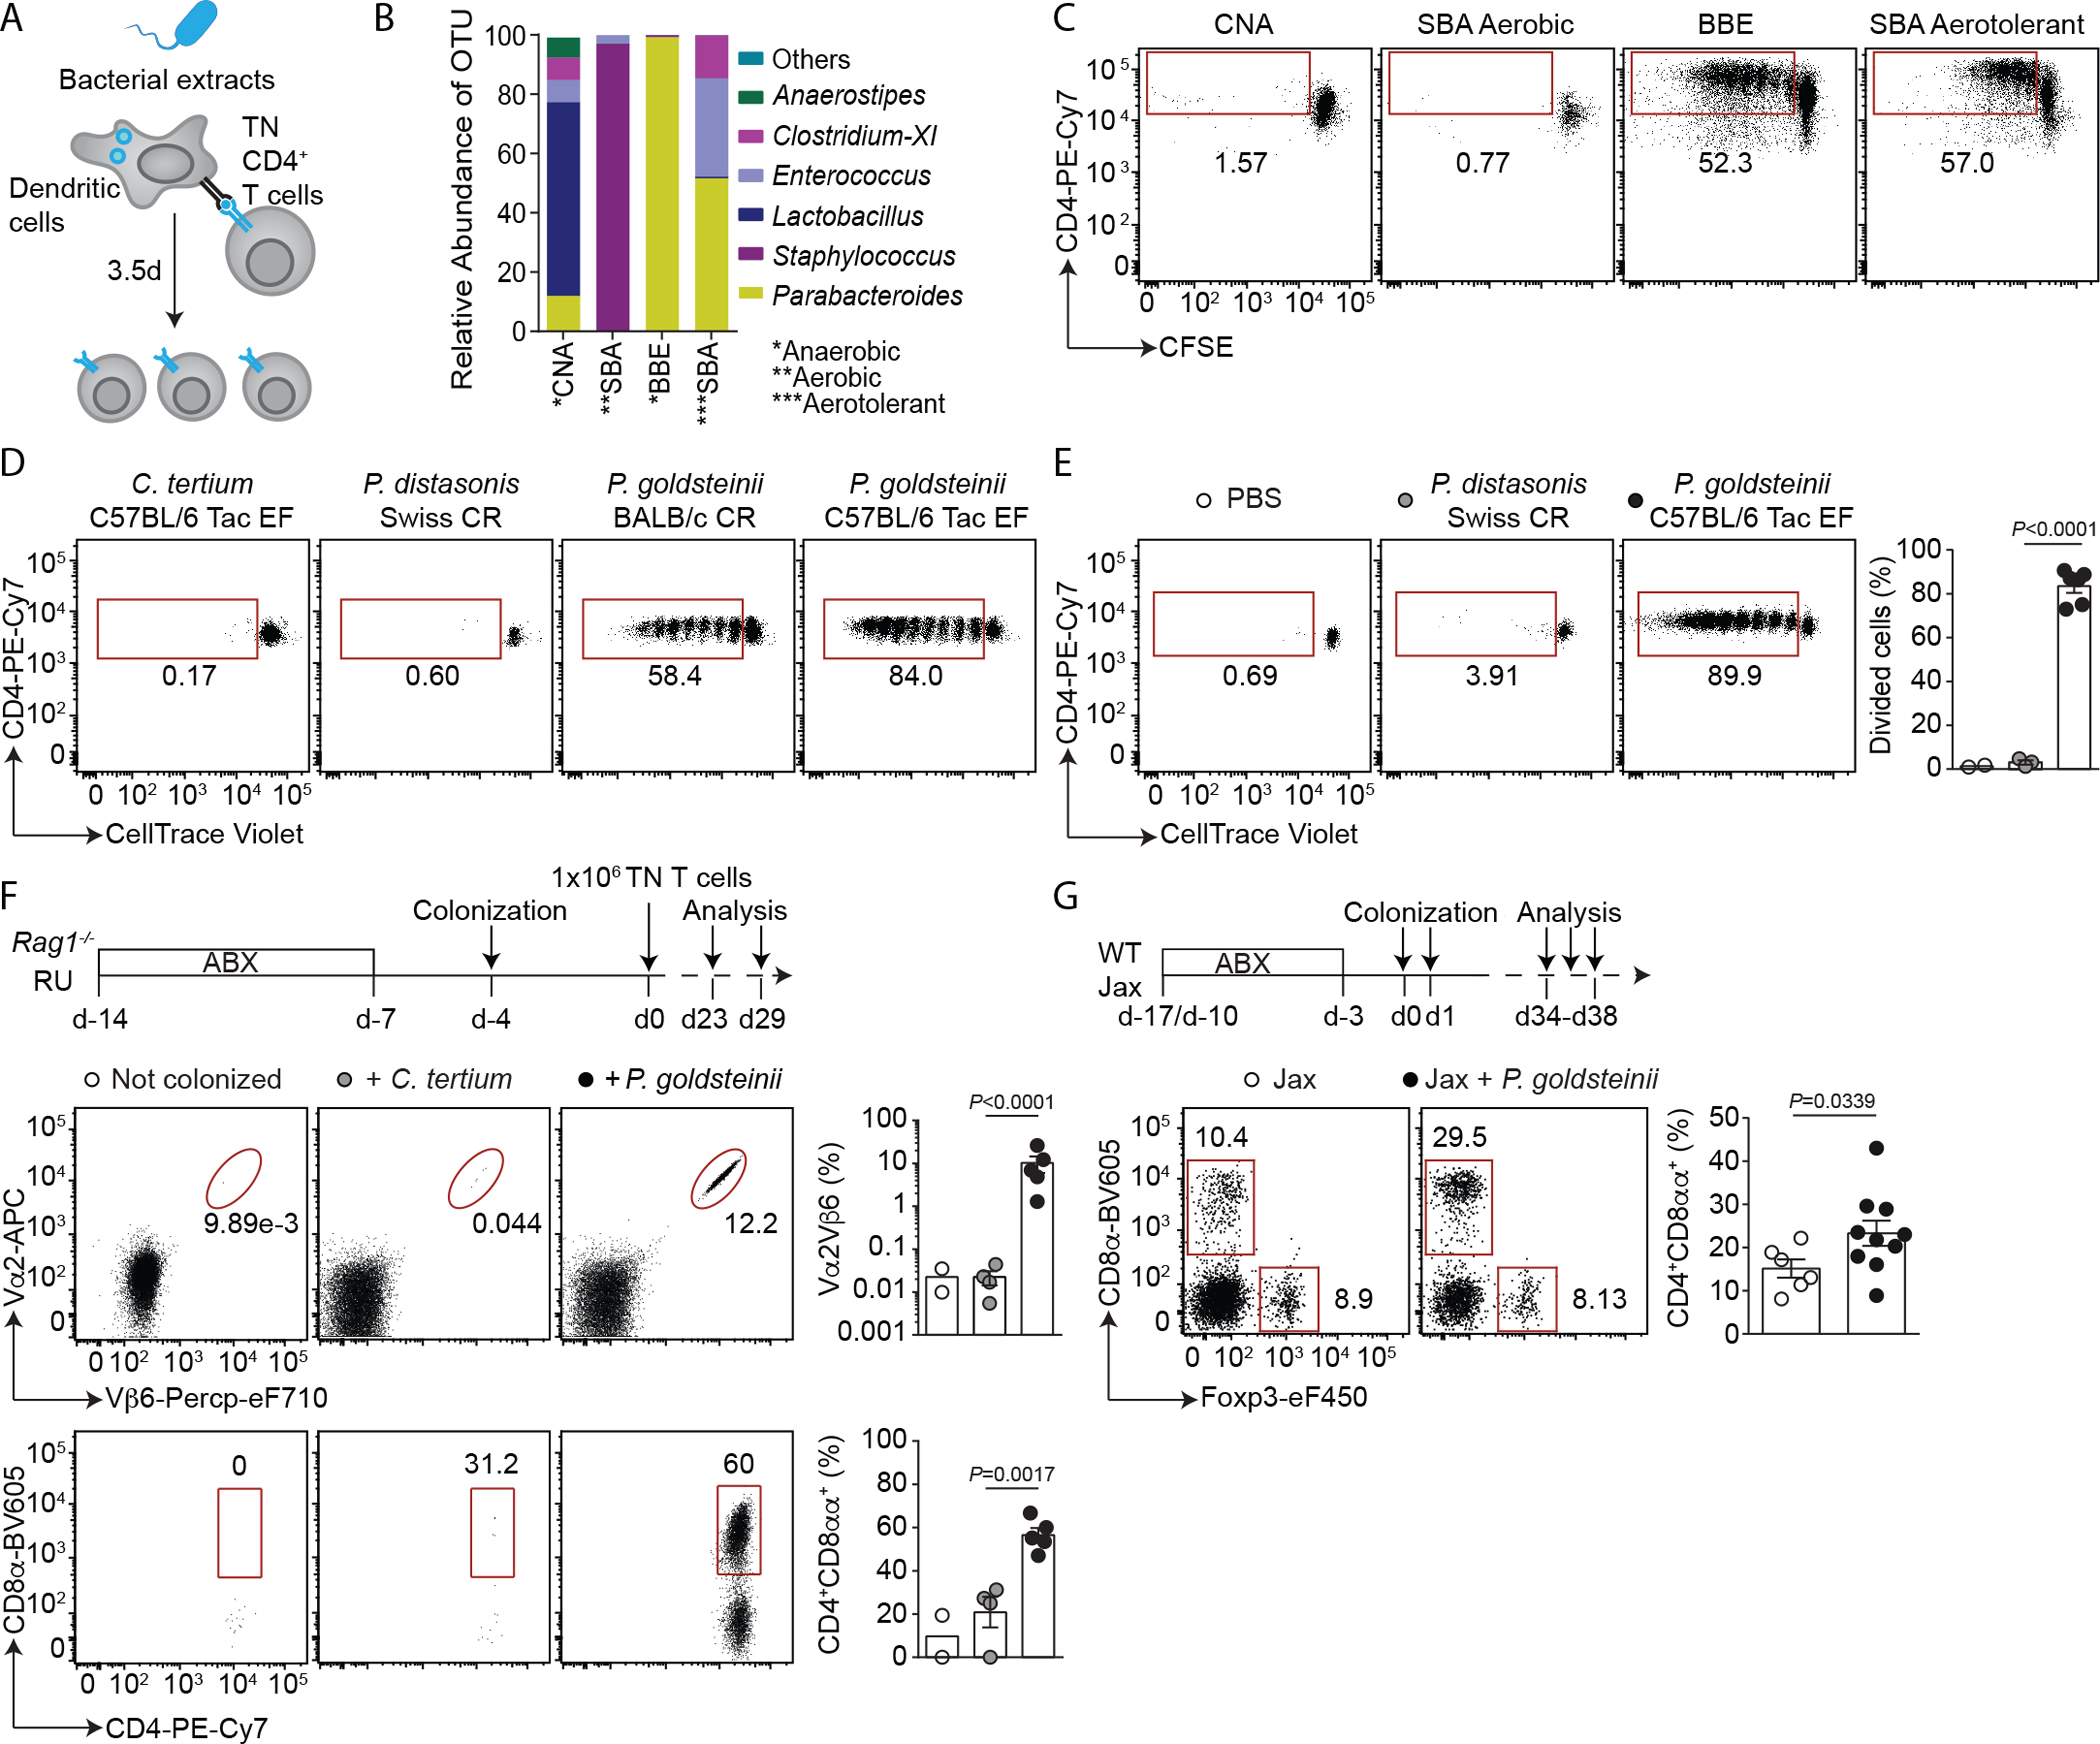
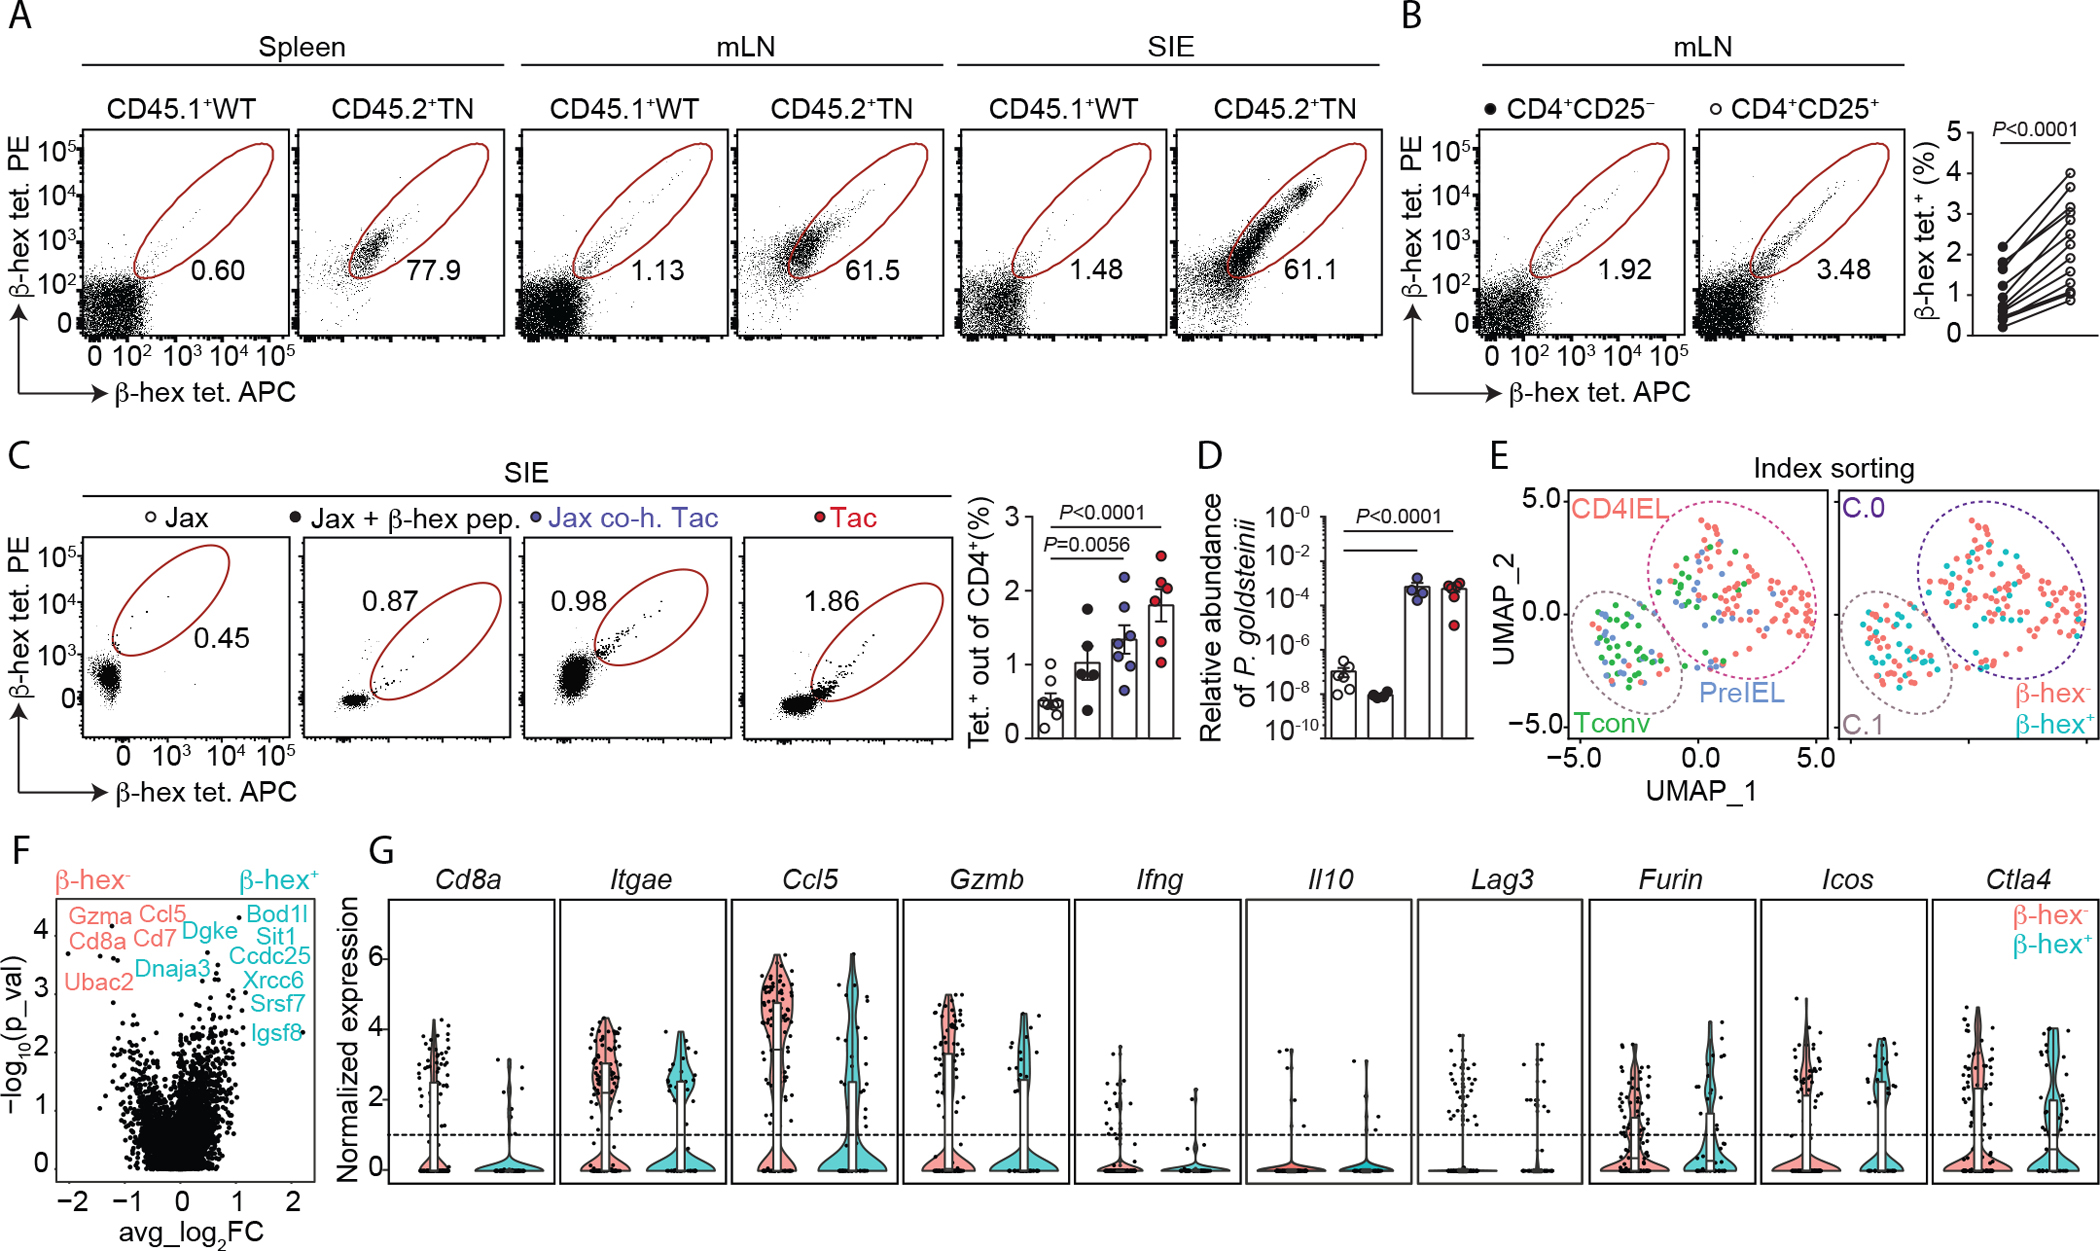
The microbiome contributes to the development and maturation of the immune system. In response to commensal bacteria, intestinal CD4+ T lymphocytes differentiate into functional subtypes with regulatory or effector functions. The development of small intestine intraepithelial lymphocytes that coexpress CD4 and CD8αα homodimers (CD4IELs) depends on the microbiota. However, the identity of the microbial antigens recognized by CD4+ T cells that can differentiate into CD4IELs remains unknown. We identified β-hexosaminidase, a conserved enzyme across commensals of the Bacteroidetes phylum, as a driver of CD4IEL differentiation. In a mouse model of colitis, β-hexosaminidase-specific lymphocytes protected against intestinal inflammation. Thus, T cells of a single specificity can recognize a variety of abundant commensals and elicit a regulatory immune response at the intestinal mucosa.


Conflict of interest statement

Competing interests: E.J.A. is a consultant and has equities at Finch therapeutics. The other authors declare no competing interests. T.K.L. is a co-founder of Senti Biosciences, Synlogic, Engine Biosciences, Tango Therapeutics, Corvium, BiomX, Eligo Biosciences, Bota.Bio, Avendesora, and NE47Bio. T.K.L. also holds financial interests in nest.bio, Armata, IndieBio, CognitoHealth, Quark Biosciences, Personal Genomics, Thryve, Lexent Bio, MitoLab, Vulcan, Serotiny, Avendesora, Pulmobiotics, Provectus Algae, Invaio, and NSG Biolabs.

Figures

Fig. 1.
Fig. 1.. P. goldsteinii induces CD4IELs in both monoclonal and polyclonal SPF mice.
(A) Schematic of the in vitro proliferation assay. (B) 16S rRNA sequencing of isolated bacterial extracts used in C. (C) CFSE dilution among TN cells in response to the indicated bacterial extracts derived from Taconic EF fecal bacteria, isolated using the indicated growth conditions. (D) CellTrace Violet dilution among CD4+ TN T cells in response to the indicated bacteria. (C, D) Representative of flow cytometry dot plots of three experiments. (E) Representative flow cytometry dot plots showing CellTrace Violet dilution (left) and frequency of divided cells (right) among CD4+ TN T cells harvested from the draining inguinal lymph nodes (LNs) of mice immunized with the indicated bacterial extracts (n=2–6 mice per group). (F) Rag1−/− hosts were treated with antibiotics (ABX), then either colonized or not colonized with the indicated bacteria prior to receiving CD4+ TN T cells. Cells from the small intestinal epithelium (SIE) were analyzed by flow cytometry (n=2–5). (top) Experimental design. (middle) Representative flow cytometry dot plots of Vα2 and Vβ6 expression among CD45+ cells and CD4 and CD8α expression among TN cells (Vα2+Vβ6+) in SIE (bottom). (right) Frequency of TN cells among CD45+ cells (top) and frequency of CD4IELs (CD4+CD8αα+) in the SIE among TN CD4+ T cells (bottom) in all mice analyzed in (F). (G) WT Jax mice were treated with ABX and colonized with P. goldsteinii. Cells from the SIE were analyzed by flow cytometry (n=6–10). (top) Experimental design. (bottom) Representative dot plots showing Foxp3 and CD8α expression (left) and frequency of CD4IELs (right) among CD4+ T cells. The graphs in (F, G) show the means ± SEM and each symbol represents a mouse from two to three experiments. P-values were calculated using unpaired two-tailed Student’s t test (E and F) and two-tailed Student’s t test with Welch correction (G). (Tac: Taconic; CR: Charles River; SBA: Schaedler blood agar; BBE: Bacteroides bile esculin; CNA: colistin–nalidixic acid).
Fig. 2.
Fig. 2.. The TN TCR recognizes epitopes from Bacteroidetes β-N-acetylhexosaminidase in complex with I-Ab.
(A) Candidate polypeptides identified by mass spectrometry were recombinantly expressed in E. coli and bacterial extracts were tested in vitro for their ability to activate TN T cells. Representative dot plots (left) and frequency of divided TN T cells in the presence of tested extracts (right). Graph shows means of two technical replicates. (B and C) In vivo proliferation of CD4+ TN T cells in response to 25 μg of bacterial extracts (B, n=3–7) or 2 μg of peptide (C, n=5). Mutations in the core epitope are indicated in red. (D) Same as (A), using peptide concentrations of 500 nM-50 pM in serial 10-fold dilutions (left). Alignment of sequences homologous to the TN epitope (right). “Activity” is the ability of each peptide to induce proliferation of TN T cells in vitro (see left). (E and F) CD45.1+ recipients were treated with antibiotics (ABX) and received CD45.2+ CD4+ TN T cells. The mice were then either colonized or not colonized with the indicated bacteria (n=7–8). Four weeks post-colonization, small intestine intraepithelium lymphocytes (E) and mesenteric lymph nodes (F) were analyzed. Dot plots show CD8α and Foxp3 expression and graphs show the frequency of CD4IELs (CD4+CD8αα+) in the SIE (E) and mLN Tregs (Foxp3+) (F) among TN CD4+ T cells. In vitro experiments are representative of three experiments (A and D). Dot plots for in vivo experiments show one representative mouse and the graphs all mice analyzed in two experiments. Each symbol represents a mouse and graphs show means ± SEM (B, C, and E and F). P-values were calculated using one-way ANOVA with Dunnett’s post-hoc test in (B, E and F) or unpaired two-tailed Student’s t test in (C). (P.g.: P. goldsteinii; P.d.: P. distasonis; P.m.: P. merdae).
Fig. 3.
Fig. 3.
The β-hexosaminidase epitope is recognized by intraepithelial lymphocytes and Tregs. (A) Cells from spleen, mesenteric lymph nodes (mLNs), and the small intestinal epithelium (SIE) were harvested from SPF mice housed at BCH. Cells from CD45.1+ WT mice and CD45.2+ TN mice were mixed at 10:1 (WT:TN) ratio and stained with β-hex tetramers. Gates show the frequency of tetramer+ CD45.1+ or CD45.2+ cells among CD4+ T cells. (B) Representative dot plots of mLNs from Tac SPF mice (n=13) stained with the indicated tetramers (left). Frequencies of tetramer+ cells in the indicated populations among CD4+ T cells isolated from mLNs (right). (C) Tetramer analysis among SIE CD4+ T cells of WT mice sourced from the indicated facilities, co-housed or treated orally with β-hex peptide as indicated (n=5–8 per group). (D) Quantification of P. goldsteinii abundance by qPCR in fecal samples derived from the mice shown in (C). (E-G) scRNAseq analysis of β-hex–specific (β-hex+) and β-hex CD4+ T cells sorted from SIE of three Taconic SPF mice. (E) Uniform manifold approximation and projection (UMAP) plots according to gene expression analysis showing the distribution of conventional T cells (Tconv, CD103 CD8α), PreIEL (CD103+CD8α) and CD4IELs (CD103+CD8α+) according to the index sorting (left) and clustering of β-hex+ and β-hex cells (right). (F) Volcano plot comparing the gene expression of β-hex+ and β-hex cells. (G) Expression of selected genes by β-hex+ and β-hex cells. All mice shown of two (E to G), three (A), five (B), or six (C, D) experiments. Error bars represent means ± SEM. P-values were calculated using paired two-tailed Student’s t tests in (B), one-way ANOVA with Dunnett’s post-hoc test (C, D) and Wilcoxon rank sum test (F, G). (Jax: Jackson; Tac: Taconic; co-h: co-housed).
Fig. 4.
Fig. 4.. β-hexosaminidase–specific T cells confer protection against intestinal inflammation.
(A to D) Taconic SPF Rag2−/− either received or did not receive CD45.2+CD4+ TN T cells (day 0) and naïve CD45.1+ CD4+ T cells from WT mice (day 12). On days 2, 4, and 13, some mice received β-hex peptide orally (n=8–10). (A) Percent of initial weight over time. (B) Fecal lipocalin (LCN-2) levels throughout the experiment (n=5–8). (C) Representative photomicrographs of H&E-stained colonic sections from indicated groups. (D) Histology score of H&E-stained sections of colon. (E to H) Same as (A to D) but using either WT (n=7) or Foxp3DTR (n=10) CD4+ T cells (on day 12 post-transfer of TN T cells). These mice received diphtheria toxin (DT) intraperitoneally once per week throughout the experiment. (E) Percent of initial weight over time. (F) Fecal LCN-2 levels throughout the experiment. (G) Representative photomicrographs of H&E-stained colonic sections from indicated groups. (H) Histology score of H&E-stained sections of colon. (I to L) Same as (A to D) but using either WT (n=5) or Foxp3−/− TN CD4+ cells (n=5, day 0). (I) Percent of initial weight over time. (J) Fecal LCN-2 levels. (K) Representative photomicrographs of H&E-stained sections of colon of indicated groups. (L) Histology scores of H&E-stained sections of colon. (A to L). All mice analyzed in two experiments. Graphs show means ± SEM. P-values were calculated using two-way ANOVA for repeated measures with Tukey post-hoc test in (A, B, E, F, I, and J), Mann-Whitney test (H) and Kruskal–Wallis test followed by Dunn’s multiple comparisons post-hoc test (D, L). (C and G) Scale bar: 200 μm (top), 60 μm (bottom). (K) Scale bar: 200 μm (top), 100 μm (bottom). Low- and high-magnification photomicrographs show two representative mice in each group (C and G and K). ns, not significant.

Comment in

References

    1. Belkaid Y, Harrison OJ, Homeostatic Immunity and the Microbiota. Immunity 46, 562–576 (2017). - PMC - PubMed
    1. Ivanov II, Honda K, Intestinal commensal microbes as immune modulators. Cell Host Microbe 12, 496–508 (2012). - PMC - PubMed
    1. Geuking MB, Burkhard R, Microbial modulation of intestinal T helper cell responses and implications for disease and therapy. Mucosal Immunology 13, 855–866 (2020). - PubMed
    1. Ansaldo E et al., Akkermansia muciniphila induces intestinal adaptive immune responses during homeostasis. Science 364, 1179–1184 (2019). - PMC - PubMed
    1. Sefik E et al., MUCOSAL IMMUNOLOGY. Individual intestinal symbionts induce a distinct population of RORgamma(+) regulatory T cells. Science 349, 993–997 (2015). - PMC - PubMed