. 2022 Aug 5;377(6606):eabn5800.
doi: 10.1126/science.abn5800. Epub 2022 Aug 5.

The continuum of Drosophila embryonic development at single-cell resolution

Affiliations

The continuum of Drosophila embryonic development at single-cell resolution

Diego Calderon et al. Science. .

Abstract

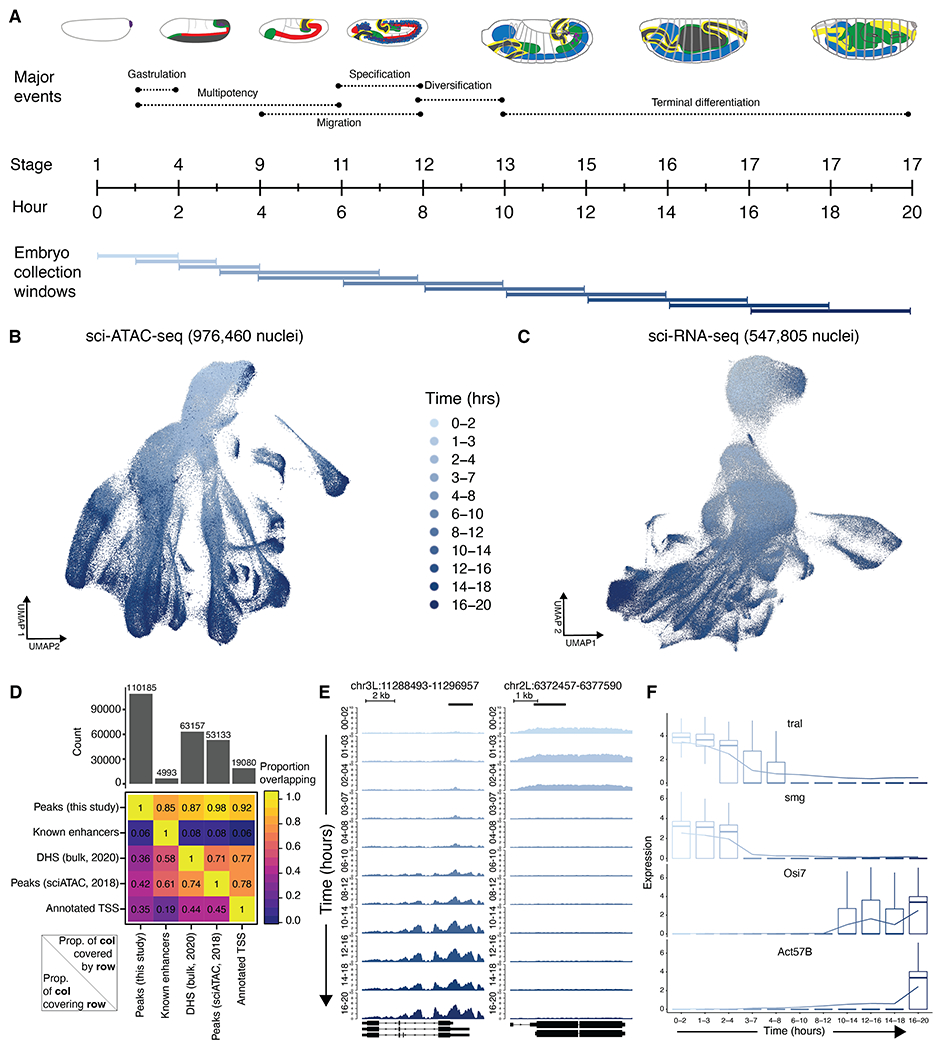
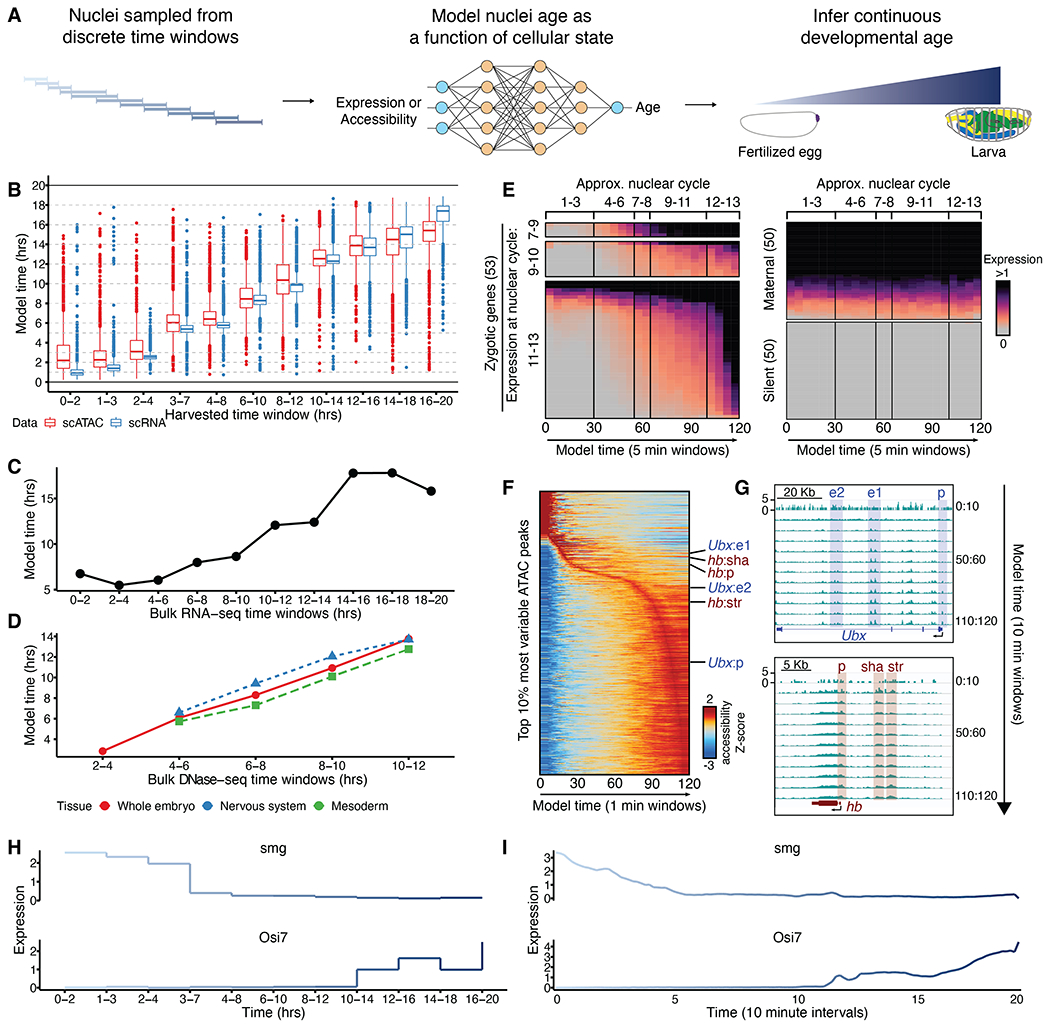
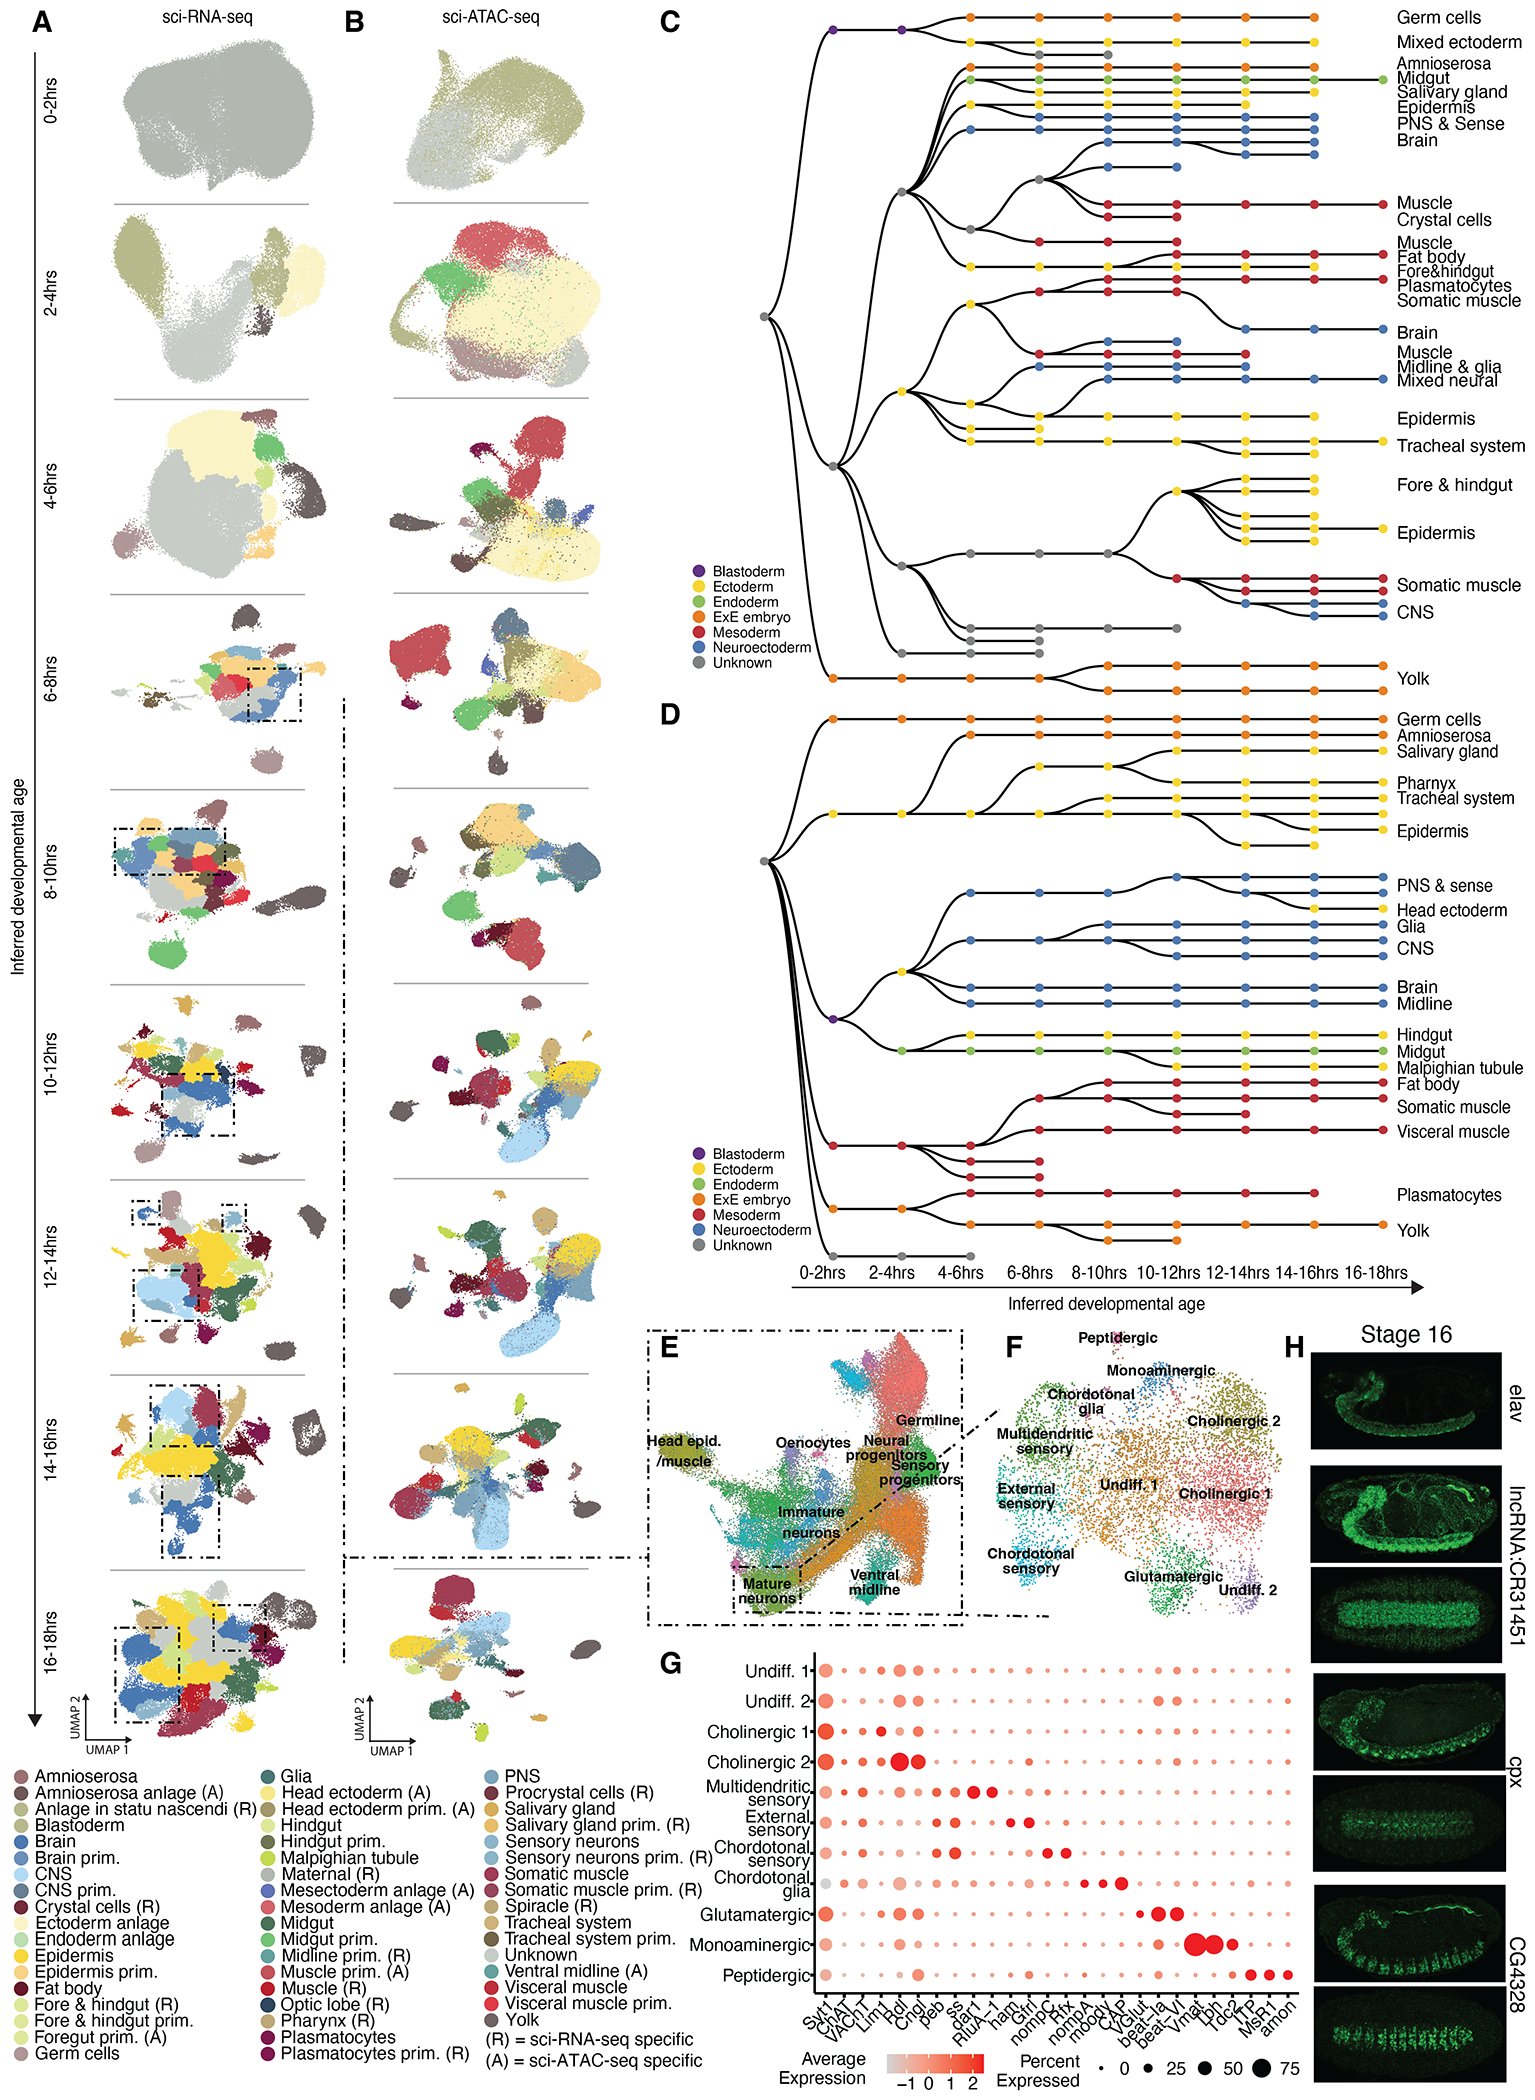
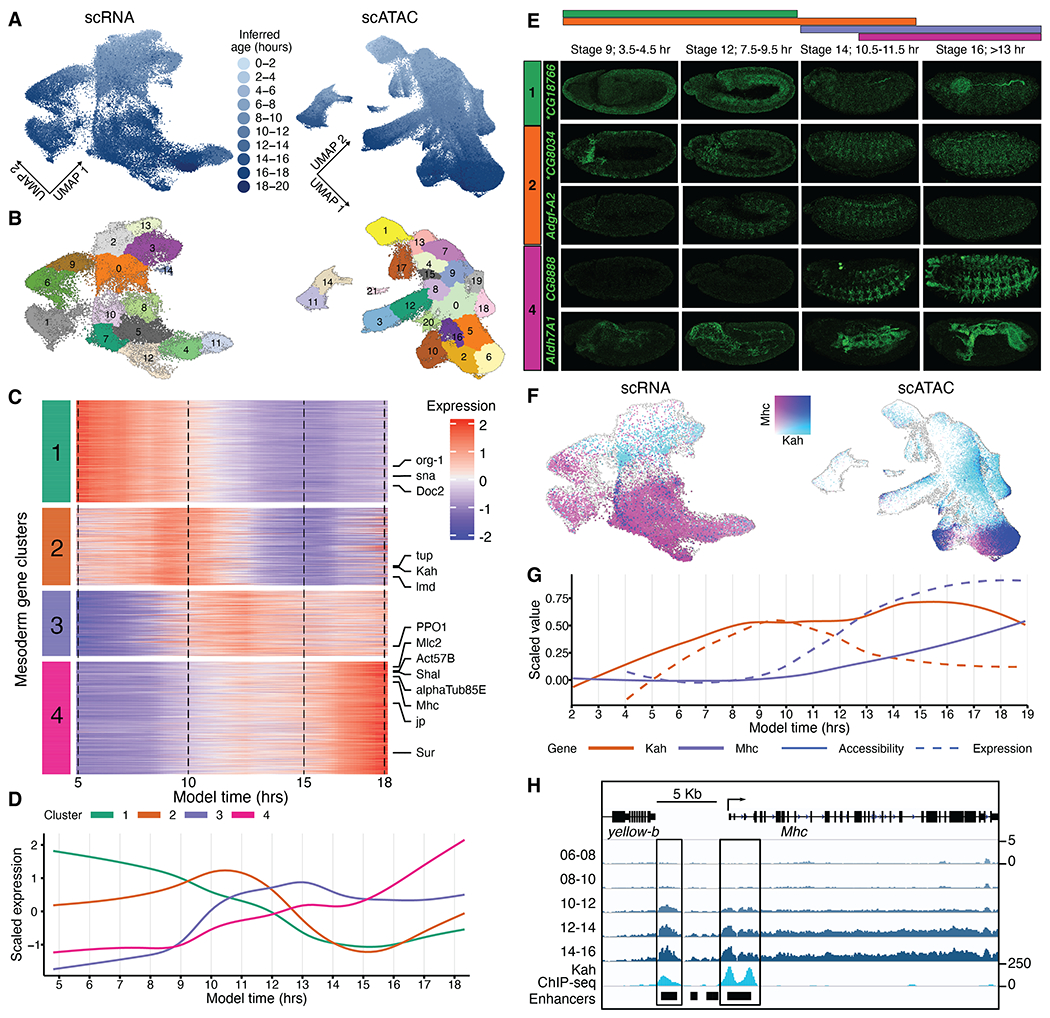
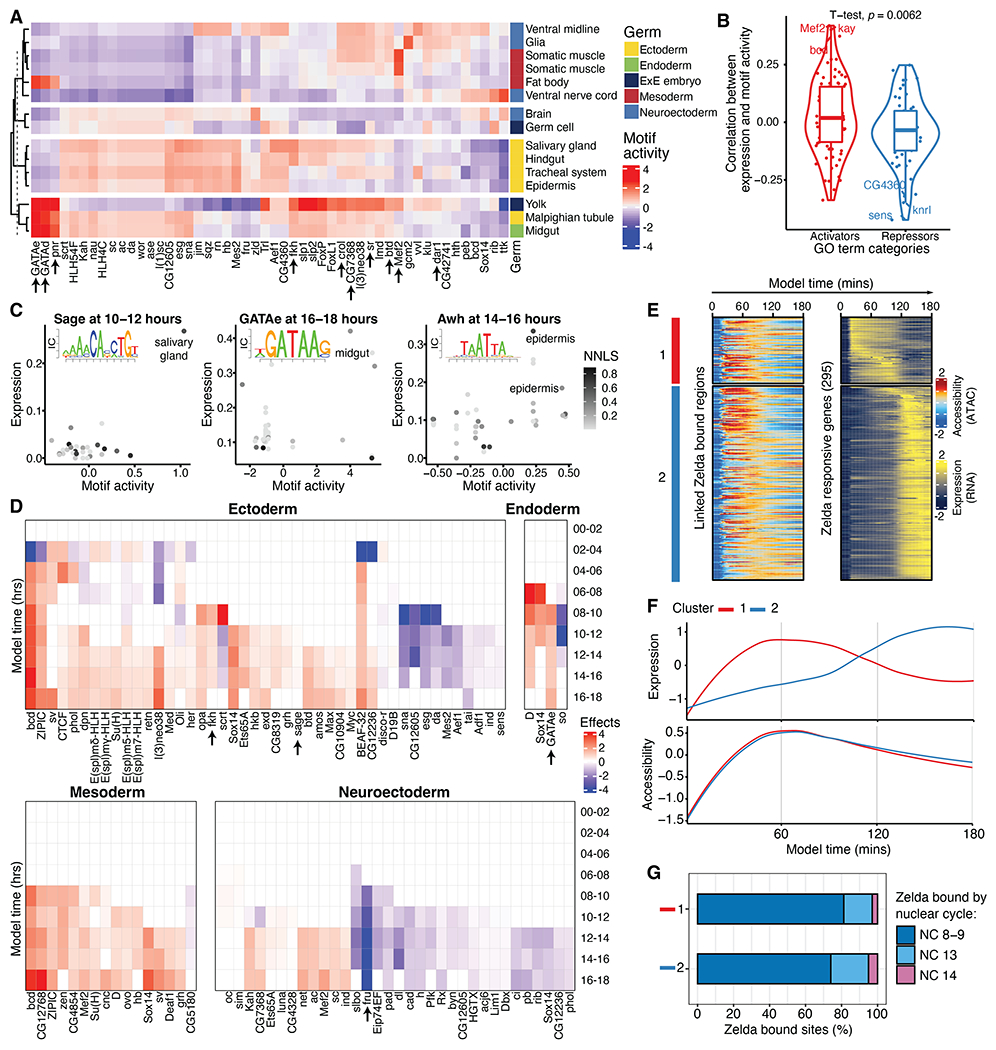
Drosophila melanogaster is a powerful, long-standing model for metazoan development and gene regulation. We profiled chromatin accessibility in almost 1 million and gene expression in half a million nuclei from overlapping windows spanning the entirety of embryogenesis. Leveraging developmental asynchronicity within embryo collections, we applied deep neural networks to infer the age of each nucleus, resulting in continuous, multimodal views of molecular and cellular transitions in absolute time. We identify cell lineages; infer their developmental relationships; and link dynamic changes in enhancer usage, transcription factor (TF) expression, and the accessibility of TFs' cognate motifs. With these data, the dynamics of enhancer usage and gene expression can be explored within and across lineages at the scale of minutes, including for precise transitions like zygotic genome activation.


Conflict of interest statement

Competing interests: J.S. is a SAB member and a consultant and/or cofounder of Cajal Neuroscience, Guardant Health, Maze Therapeutics, Camp4 Therapeutics, Phase Genomics, Adaptive Biotechnologies, and Scale Biosciences. C.T. is a SAB member and a consultant and/or cofounder of Algen Biotechnologies, Altius Therapeutics, and Scale Biosciences. The authors declare no other competing interests.

Figures

Fig. 1.
Fig. 1.. Single-cell profiling of chromatin accessibility and gene expression throughout Drosophila embryogenesis.
(A) Eleven overlapping collection windows that collectively cover embryogenesis. (B) UMAP visualization of cell-x-peak matrix of evenly time-subsampled sci-ATAC-seq nuclei that passed QC. (C) Same as (B), but for sci-RNA-seq. (D) Heatmap showing proportion of our scATAC peaks overlapping ~5000 curated enhancers (–10), bulk DHS peaks from 2 to 12 hours (11), scATAC peaks from 2 to 12 hours (12), or annotated TSSs (49). (E) Chromatin accessibility, normalized by counts per million reads, across representative regions exhibiting time dependence across 11 collection windows. (F) Gene expression of representative genes exhibiting time dependence across 11 collection windows. Read counts were normalized, multiplied by a scale-factor, log-transformed after the addition of a pseudocount, and averaged across all cells within each window.
Fig. 2.
Fig. 2.. Inferring developmental age from cellular state.
(A) We fit a NN-based model that uses either gene expression or chromatin accessibility to predict the center hour of the time window from which each nucleus was sampled. The inferred nuclear ages make up a continuum. (B) NN model–predicted developmental ages (y axis) of test set nuclei, equally sampled from discrete time windows (x axis) and not included in model training. (C) NN model–predicted developmental ages (y axis) of bulk RNA-seq samples (15) collected from 2-hour windows (x axis). (D) NN model–predicted developmental ages (y axis) of bulk DNase-seq samples from either whole-embryo or purified tissues collected from 2-hour windows (x axis). (E) Expression of zygotic (left), maternal (top right), or silent (bottom right) genes in nuclei from predicted age windows in 5-min increments across 0 to 2 hours of development. (F) Accessibility of most variable scATAC peaks from predicted age windows in 1-min increments across 0 to 2 hours of development. Labels indicate regions illustrated in (G). (G) Examples of cis-regulatory regions known to exhibit dynamic accessibility in early embryos (17). (H and I) Examples of time-associated genes, with expression values averaged across all nuclei from indicated collection windows (H) or from predicted age windows in 10-min increments (I).
Fig. 3.
Fig. 3.. Annotation of diversifying developmental trajectories.
(A) UMAP visualization of non-overlapping, inferred 2-hour time windows for scRNA clusters colored by cell state annotation. Dashed boxes highlight neuroectodermal clusters. (B) Same as (A), but for scATAC data. PNS, peripheral nervous system; CNS, central nervous system. (C) ScRNA-based acyclic directed graph representation of clusters linked through nonoverlapping time windows. (D) Same as (C), but from scATAC data. (E) UMAP of scRNA data for ~60,000 annotated neuroectodermal cells—i.e., cell states highlighted in (A) with dashed boxes, colored by cluster. (F) UMAP of ~6000 mature neurons, colored by cluster. The chordotonal glia cluster includes Ch and ES organ glial-like support cells. (G) Dot plot showing marker gene expression for annotated clusters in (F). (H) In situ hybridization of stage 16 embryos, showing the expression of lncRNA CR31451, cpx, and CG4328 in the nervous system. A tissue marker (elav) is provided in the top panel. A lateral and ventral embryo view is shown for each gene.
Fig. 4.
Fig. 4.. Dynamic regulation of mesoderm-specific gene modules.
(A) UMAP of scRNA (left) or scATAC (right) data for all mesodermal cells, colored by inferred developmental age. (B) Same as (A), but colored as reprocessed leiden-based clusters. (C) Normalized expression of mesoderm genes across inferred developmental time. (D) Average expression of the gene modules across inferred time. (E) In situ hybridization experiments validating temporal expression of selected genes with predicted expression in mesoderm and muscle (asterisks indicate see supplementary note 3). (F) Same as (A), but expression of Kah (cyan) and Mhc (purple) is overlaid. Points from cells that express both Kah and Mhc are colored dark blue. (G) Comparison of gene activity score (solid line) and gene expression (dashed line) over the continuum of inferred developmental age for Kah (cluster 2) and Mhc (cluster 3) in mesoderm-annotated cells. Gene activity scores and expression were binned into 100 equal partitions by inferred age, averaged, and scaled to 0 to 1 with min-max values. (H) Chromatin accessibility profile surrounding Mhc for pseudobulk mesoderm cells from 6 to 16 hours inferred time in 2-hour increments, along with Kah ChIP-seq generated from 0- to 16-hour whole embryos (14).
Fig. 5.
Fig. 5.. Integration of scRNA and scATAC data to identify TFs with potential regulatory roles across differentiating tissues and developmental time.
(A) Heatmap with averaged chromatin accessibility differences associated with the 50 most variable TF-specific motifs from all cells in annotated ATAC-seq clusters from 10 to 12 hours. Arrows indicate TFs discussed in the main text. (B) Correlation between expression and motif-associated accessibility grouped by expression activation- or repression-associated GO categories. TFs in GO pathways for gene activation are linked to increasing chromatin accessibility. (C) omparison of gene expression (y axis) and motif-associated chromatin accessibility (x axis) across NNLS-linked clusters for the TFs Sage (left), GATAe (middle), and Awh (right). Each TF’s corresponding PWM is inset in each plot, with the size of each base scaled by information content. (D) Heatmaps of estimated effects of gene expression at predicting motif-associated chromatin accessibility changes through time in different germ layers. Displayed TFs had three or more consecutive time windows with a significant (P < 1 × 10⁻³) and sign-consistent effect. Arrows indicate TFs discussed in the main text. (E) Heatmap of expression at Zelda-responsive genes (right) and aggregated chromatin accessibility (left) at their Zelda-bound cis-regulatory regions (38, 39). Values were averaged in 1-min windows over 0 to 3 hours of development. The red and blue bars to the left indicate two temporal clusters of expression of Zelda-responsive genes. (F) Smoothed average expression and accessibility for the two Zelda temporal clusters from (E). (G) Proportion of accessible regions from (E) that are bound by Zelda in clusters 1 and 2 in ChIP-seq data (39) from different nuclear cycles (NCs).

References

    1. Cao J et al. , The single-cell transcriptional landscape of mammalian organogenesis. Nature 566, 496–502 (2019). doi: 10.1038/s41586-019-0969-x; - DOI - PMC - PubMed
    1. Pijuan-Sala B et al. , A single-cell molecular map of mouse gastrulation and early organogenesis. Nature 566, 490–495 (2019). doi: 10.1038/s41586-019-0933-9; - DOI - PMC - PubMed
    1. Qiu C et al. , Systematic reconstruction of cellular trajectories across mouse embryogenesis. Nat. Genet 54, 328–341 (2022). doi: 10.1038/s41588-022-01018-x; - DOI - PMC - PubMed
    1. Mittnenzweig M et al. , A single-embryo, single-cell time-resolved model for mouse gastrulation. Cell 184, 2825–2842.e22 (2021). doi: 10.1016/j.cell.2021.04.004; - DOI - PMC - PubMed
    1. La Manno G et al. , Molecular architecture of the developing mouse brain. Nature 596, 92–96 (2021). doi: 10.1038/s41586-021-03775-x; - DOI - PubMed

MeSH terms

Substances