. 2022 Aug 5;377(6606):eabo1984.
doi: 10.1126/science.abo1984. Epub 2022 Aug 5.

Pathogenic variants damage cell composition and single cell transcription in cardiomyopathies

Affiliations

Pathogenic variants damage cell composition and single cell transcription in cardiomyopathies

Daniel Reichart et al. Science. .

Abstract

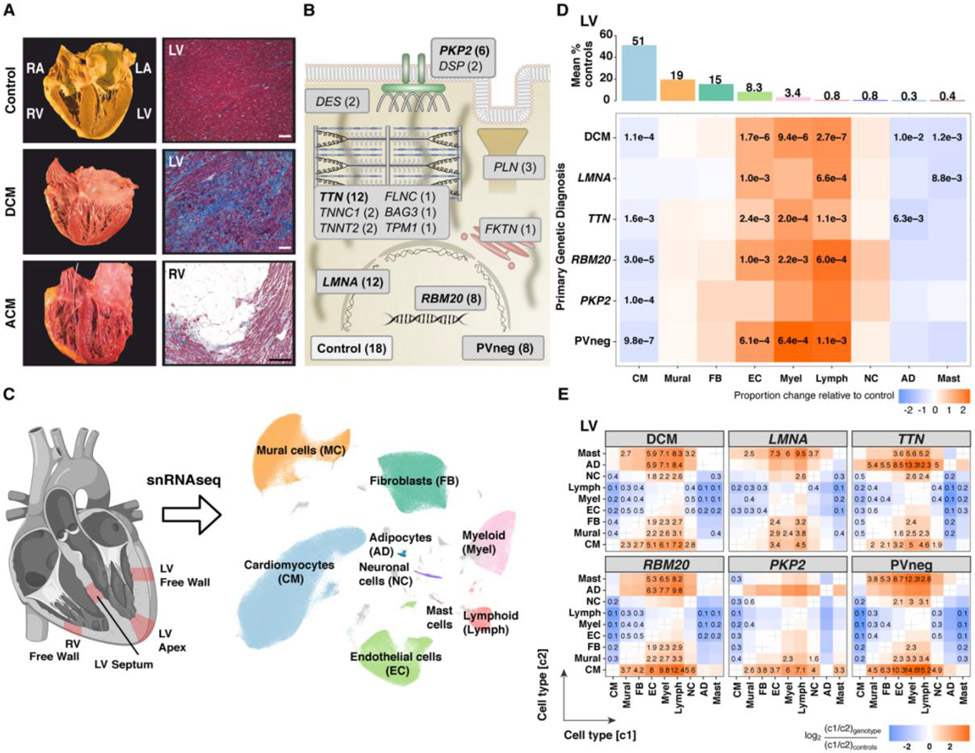
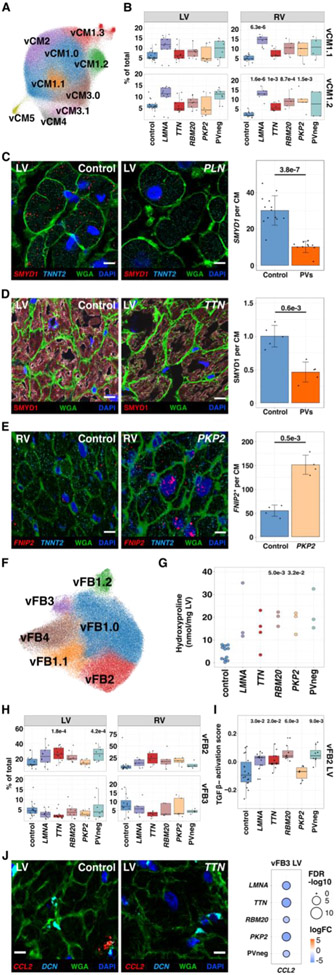
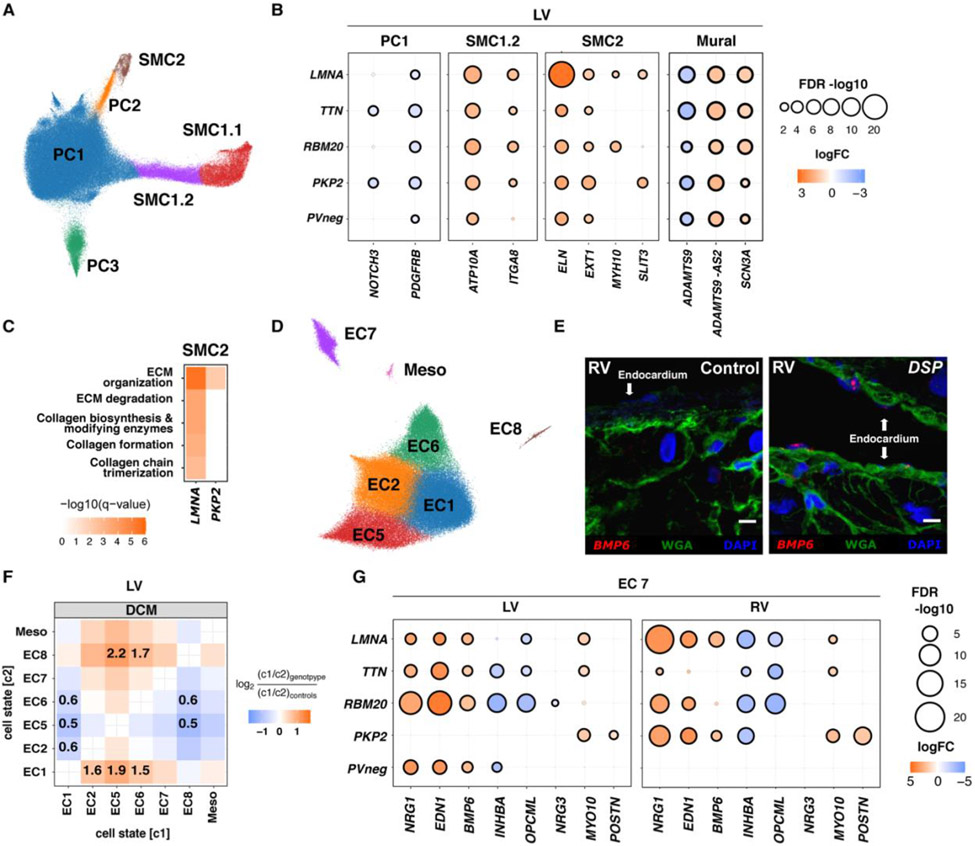
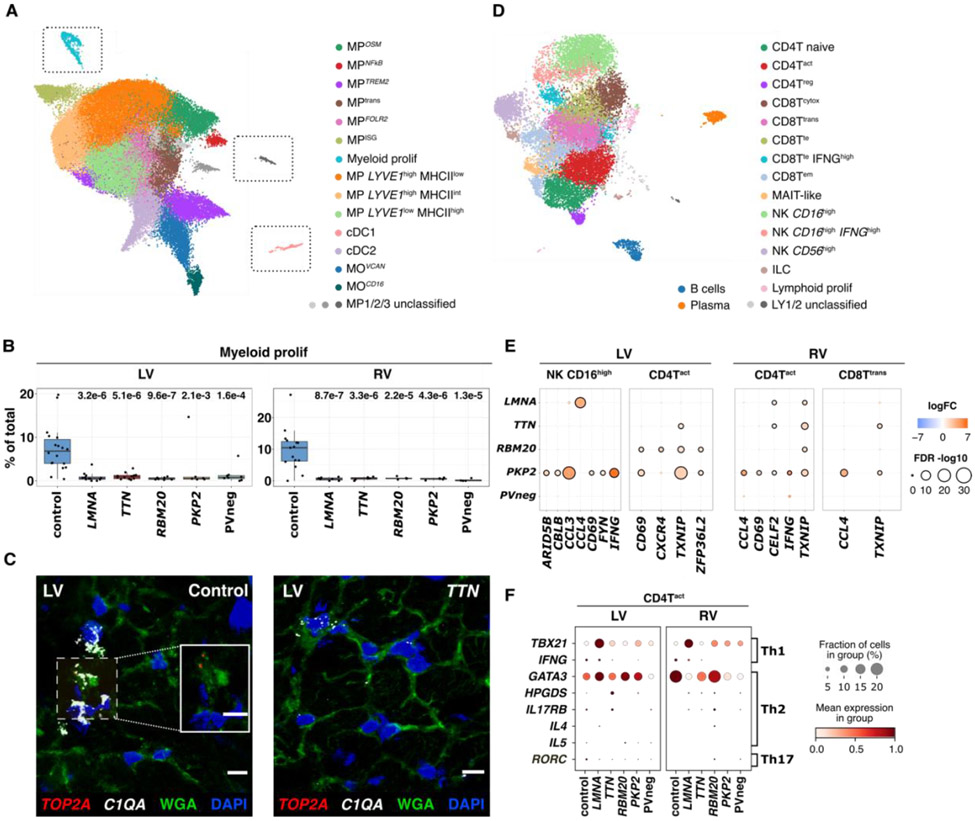
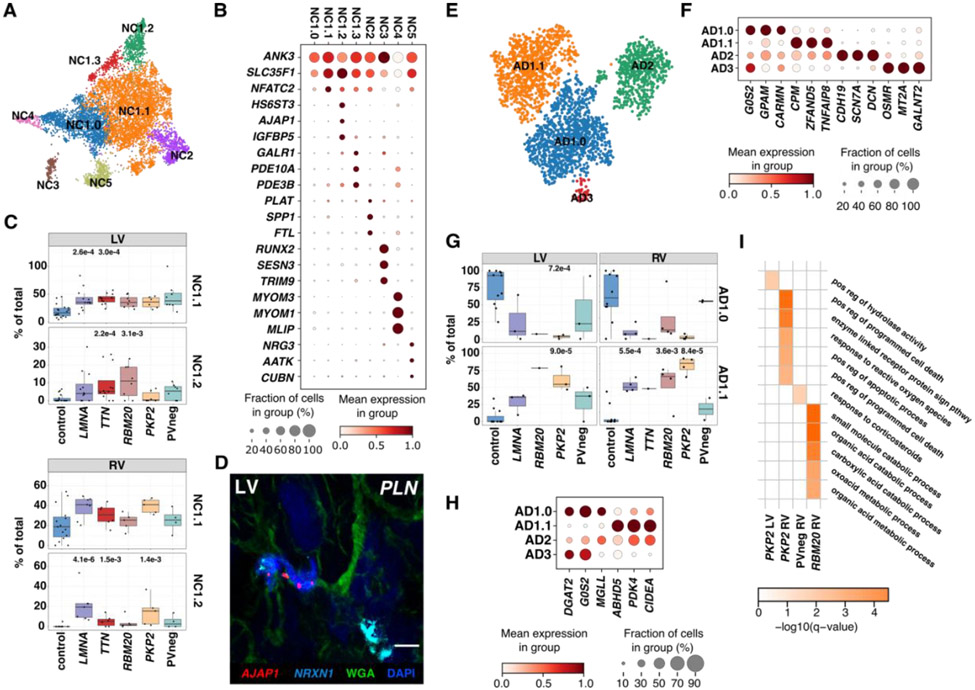
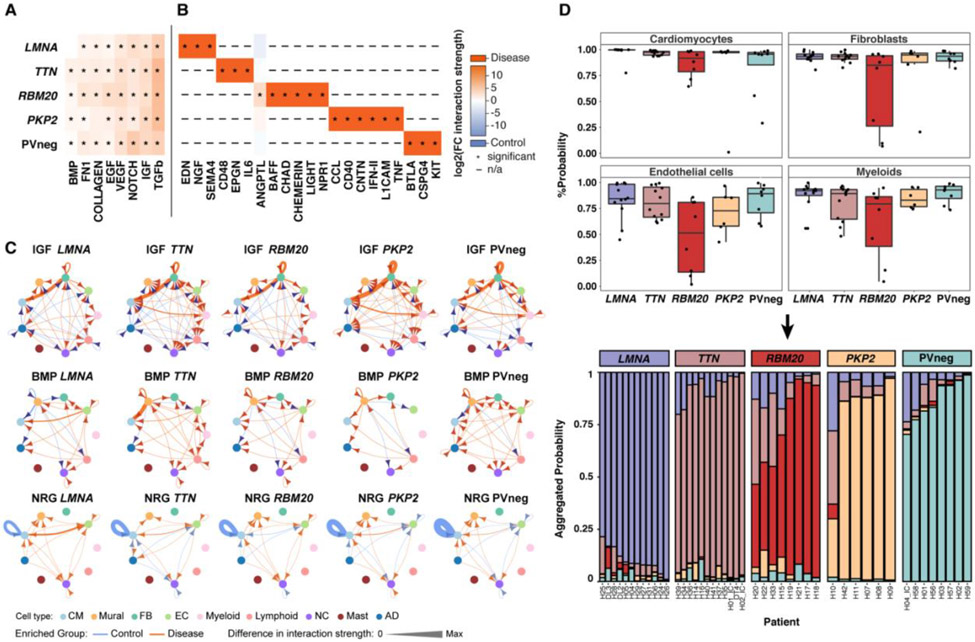
Pathogenic variants in genes that cause dilated cardiomyopathy (DCM) and arrhythmogenic cardiomyopathy (ACM) convey high risks for the development of heart failure through unknown mechanisms. Using single-nucleus RNA sequencing, we characterized the transcriptome of 880,000 nuclei from 18 control and 61 failing, nonischemic human hearts with pathogenic variants in DCM and ACM genes or idiopathic disease. We performed genotype-stratified analyses of the ventricular cell lineages and transcriptional states. The resultant DCM and ACM ventricular cell atlas demonstrated distinct right and left ventricular responses, highlighting genotype-associated pathways, intercellular interactions, and differential gene expression at single-cell resolution. Together, these data illuminate both shared and distinct cellular and molecular architectures of human heart failure and suggest candidate therapeutic targets.


Figures

Figure 1:
Figure 1:. PVs and unexplained causes of DCM and ACM alter cardiac morphology, histopathology, and cellular compositions.
(A) Comparisons of normal cardiac anatomy and histology to DCM, demonstrating LV dilation with fibrosis, and to ACM, showing RV dilation with fibrofatty degeneration (Masson trichrome staining, magnification 100x, bar 10μm). (B) Schematic depiction of the functions of DCM and ACM genes with PVs (number indicates unique genotypes, bolded denotes ≥6 patients) in studied tissues. (C) Single nuclei isolated from transmural LV (free wall, apex or septum) and RV sections were processed using 10X Chromium 3’ chemistry. UMAP embedding of 881,081 nuclei delineated ten cell types and unassigned populations (gray). (D) Upper panel: Mean abundance (%) of cell types in control LVs. Lower panel: Proportional changes of cell types in specified genotypes or aggregated across DCM genotypes. Proportional changes are scaled by color: increased (red) or decreased (blue) in disease versus control. p-values are indicated for significant proportional changes, FDR≤0.05. (E) Pairwise cell type abundance ratios in specified genotypes or aggregated DCM genotypes in LVs relative. Color scale, FDR, significance depicted as in (D).
Figure 2:
Figure 2:. Cardiomyocytes and fibroblast states in control, DCM, and ACM ventricles.
(A) UMAP depicting CM states in all tissues. (B) Control and disease LVs and RVs abundance analyses for vCM1.1 (upper panel) and vCM1.2 (lower panel). (C) Single-molecule RNA fluorescent in situ hybridization exemplifies decreased SMYD1 (red) expression in CMs (identified by TNNT2 transcripts, cyan) within a DCM heart with a PV in PLN (phospholamban). Cell boundaries, WGA-stained (green); nuclei DAPI-stained (blue); bar 10μm. Quantified expression (spots per CM) and p-values from four independent control and disease LVs with PVs were assessed. (D) Immunohistochemistry validated decreased SMYD1 (red) protein in CMs (identified by troponin T staining, Fig. S6E) in TTN LV section. Cell boundaries, WGA-stained (green); nuclei DAPI-stained (blue); bar 10μm. Quantified protein levels (intensity per CM) and p-values were assessed from five independent control and DCM LVs with PVs. (E) Single-molecule RNA fluorescent in situ hybridization demonstrated increased expression of FNIP2 (red). CMs, nuclei, and cell boundaries are labeled as in C; bar 10μm. Quantified expression of FNIP2 (spots per CM and H-score; Methods) and p-values reflect analyses of two independent control and PKP2 samples. (F) UMAP depicting FB states. (G) Hydroxyproline assay (HPA) quantifies cardiac collagen content for each genotype. (H) Control and disease LVs and RVs abundance analyses for vFB2 (upper panel) and vFB3 (lower panel). (I) Pathway score of TGFβ activation in LV vFB2. (J) Single-molecule RNA fluorescent in situ hybridization shows decreased expression of CCL2 (red) in vFB3 (DCN, cyan) in disease compared to controls. WGA-stained (green); Nuclei DAPI-stained (blue); bar 10μm. Dot plot illustrating fold-change (log2FC) and significance (−log10(FDR)) of CCL2 expression in LV vFB3 across genotypes.
Figure 3:
Figure 3:. Mural and endothelial cell states in control, DCM, and ACM hearts.
(A) UMAP depicting pericyte (PC) and smooth muscle cell (SMC) states in all tissues. (B) Dot plots illustrate levels (fold-change; logFC) and significance (−log10(FDR)) of selected DEGs in LV PC1, SMC1.2, SMC2, and MC (PC and SMC) across genotypes. (C) KEGG pathway analysis of DEGs in SMC2 among genotypes with ≥1 enriched pathways. Color intensity denotes enrichment significance (−log10(FDR)). (D) UMAP depicting EC states in all tissues. (E) Single-molecule RNA fluorescent in situ hybridization exemplifies BMP6 (red) expression in disease endocardium from a DSP (desmoplakin) compared to control RVs. Cell boundaries, WGA-stained (green); Nuclei DAPI-stained (blue); Bar 10μm. (F) Pairwise cell state abundance ratios in DCM LVs relative to controls. Proportional changes are scaled by color: increased (red) or decreased (blue) in disease versus control. p-values are indicated for significant proportional changes, FDR<0.05. (G) Dot plots illustrate LV and RV levels (fold-change; logFC) and significance (−log10(FDR)) of selected DEGs in EC7 across genotypes. Dot size and color are defined in (B).
Figure 4:
Figure 4:. Immune cell states in control, DCM, and ACM hearts.
(A) UMAP depicting myeloid states in all tissues. Unclassified MP1, 2, and 3 require future characterization. Gray boxes enclosing proliferating (prolif) MPs, unclassified MPs, and cDC1s indicate that these were manually juxtaposed toward other states for ease of representation. The unmodified UMAP is in Fig. S23. (B) Myeloid prolif have higher abundance (% total myeloids) in controls versus disease. p-values indicate significant differences in abundances. (C) Single-molecule RNA fluorescent in situ hybridization validated increased expression of TOP2A (red) and C1QA (white) in controls versus disease. Cell boundaries, WGA-stained (green); Nuclei DAPI-stained (blue); Bar 10μm. (D) UMAP depicting lymphoid cell states in all tissues. Unclassified LY1 and 2 require future characterization. (E) Dot plots show the level of fold-change (logFC) and significance (−log10(FDR)) of selected genes in LV NK CD16hi, LV and RV CD4Tact, and RV CD8Ttrans across genotypes. (F) Dot plots highlight gene expression levels of the Th1, 2 and 17 signatures in CD4Tact cells. Dot size, fraction (%) of expressing cells; color, mean expression level.
Figure 5:
Figure 5:. Neuronal and Adipocyte cell states in control, DCM, and ACM hearts.
(A) UMAP depicting NC states in all tissues. (B) Dot plot highlights top marker genes for NC states. (C) LV and RV abundance analyses of NC1.1 and 1.2 in controls versus disease. p-values are indicated for significant proportional changes, FDR≤0.05. (D) Single-molecule RNA fluorescent in situ hybridization shows colocalization AJAP1 (red), and NRXN1 (cyan) in disease (exemplified in a DCM LV with a PV in PLN (phospholamban), demarcating the NC1.2 state. Cell boundaries, WGA-stained (green); Nuclei DAPI-stained (blue), Bar 10μm. (E) UMAP depicting AD states in all tissues. (F) Dot plot highlights top marker genes for AD states. (G) LVs and RVs abundance analyses demonstrate decreased AD1.0 and increased AD1.1 in disease versus control. (H) Dot plot of DEGs shows expression differences between AD states. (I) Heatmap of significantly enriched Gene Ontology Biological Processes terms based on significantly upregulated genes in diseased versus control ADs. Dot plots: Dot size, fraction (%) of expressing cells; color, mean expression level. p-values indicate significant differences; FDR≤0.05.
Figure 6:
Figure 6:. Altered cell-cell interactions and recognition of genotype-specific transcriptional responses.
Heatmaps depict shared (A) and unique (B) signaling pathways in LVs, with significantly different expression in genotypes compared to controls. Signaling pathways are defined in the CellChat database (75). Changes in interaction strength (log2(fold-change)), scaled by color intensity (red, increased; blue, decreased). *denotes significance; adjusted p-values≤0.05; n/a denotes expression not detected in control or disease. (C) Circle plots of significant (adjusted p-value≤0.05) cell-cell communication depict differentially regulated IGF, BMP, and NRG pathways and interactions in disease LVs. The line thickness denotes interaction strength of signals from sending and receiving cell; with color scaled from zero to maximum in disease versus controls (orange, increased; blue, decreased). Arrows indicate directionality. (D) (Top) Genotype prediction probability from graph attention networks (GAT) per cell type. (Bottom) Stacked bar plots represent the likelihood (% aggregated probability) of individual patient genotypes by GAT prediction. The vast majority of established genotypes were predicted with high probability, with lower prediction probability only in H10 (PKP2), H20 (RBM20), H22 (RBM20) and H33 (RBM20).

References

    1. McNally EM, Mestroni L, Dilated Cardiomyopathy: Genetic Determinants and Mechanisms. Circ. Res 121, 731–748 (2017). - PMC - PubMed
    1. Austin KM, Trembley MA, Chandler SF, Sanders SP, Saffitz JE, Abrams DJ, Pu WT, Molecular mechanisms of arrhythmogenic cardiomyopathy. Nature Reviews Cardiology. 16 (2019), pp. 519–537. - PMC - PubMed
    1. Bui AL, Horwich TB, Fonarow GC, Epidemiology and risk profile of heart failure. Nat. Rev. Cardiol 8, 30–41 (2011). - PMC - PubMed
    1. Litviňuková M, Talavera-López C, Maatz H, Reichart D, Worth CL, Lindberg EL, Kanda M, Polanski K, Heinig M, Lee M, Nadelmann ER, Roberts K, Tuck L, Fasouli ES, DeLaughter DM, McDonough B, Wakimoto H, Gorham JM, Samari S, Mahbubani KT, Saeb-Parsy K, Patone G, Boyle JJ, Zhang H, Zhang H, Viveiros A, Oudit GY, Bayraktar OA, Seidman JG, Seidman CE, Noseda M, Hubner N, Teichmann SA, Cells of the adult human heart. Nature. 588, 466–472 (2020). - PMC - PubMed
    1. Warren JS, Tracy CM, Miller MR, Makaju A, Szulik MW, Oka S-I, Yuzyuk TN, Cox JE, Kumar A, Lozier BK, Wang L, Liana JG, Sabry AD, Cawley KM, Barton DW, Han YH, Boudina S, Fiehn O, Tucker HO, Zaitsev AV, Franklin S, Histone methyltransferase Smyd1 regulates mitochondrial energetics in the heart. Proc. Natl. Acad. Sci. U. S. A 115, E7871–E7880 (2018). - PMC - PubMed