

Single cell gene expression profiling of nasal ciliated cells reveals distinctive biological processes related to epigenetic mechanisms in patients with severe COVID-19
- PMID: 35926268
- PMCID: PMC9338837
- DOI: 10.1016/j.compbiomed.2022.105895
Single cell gene expression profiling of nasal ciliated cells reveals distinctive biological processes related to epigenetic mechanisms in patients with severe COVID-19
Abstract
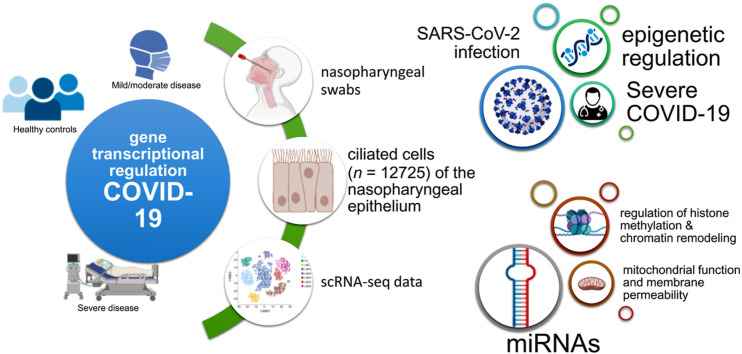
Objective: To explore the molecular processes associated with cellular regulatory programs in patients with COVID-19, including gene activation or repression mediated by epigenetic mechanisms. We hypothesized that a comprehensive gene expression profiling of nasopharyngeal epithelial cells might expand our understanding of the pathogenic mechanisms of severe COVID-19.
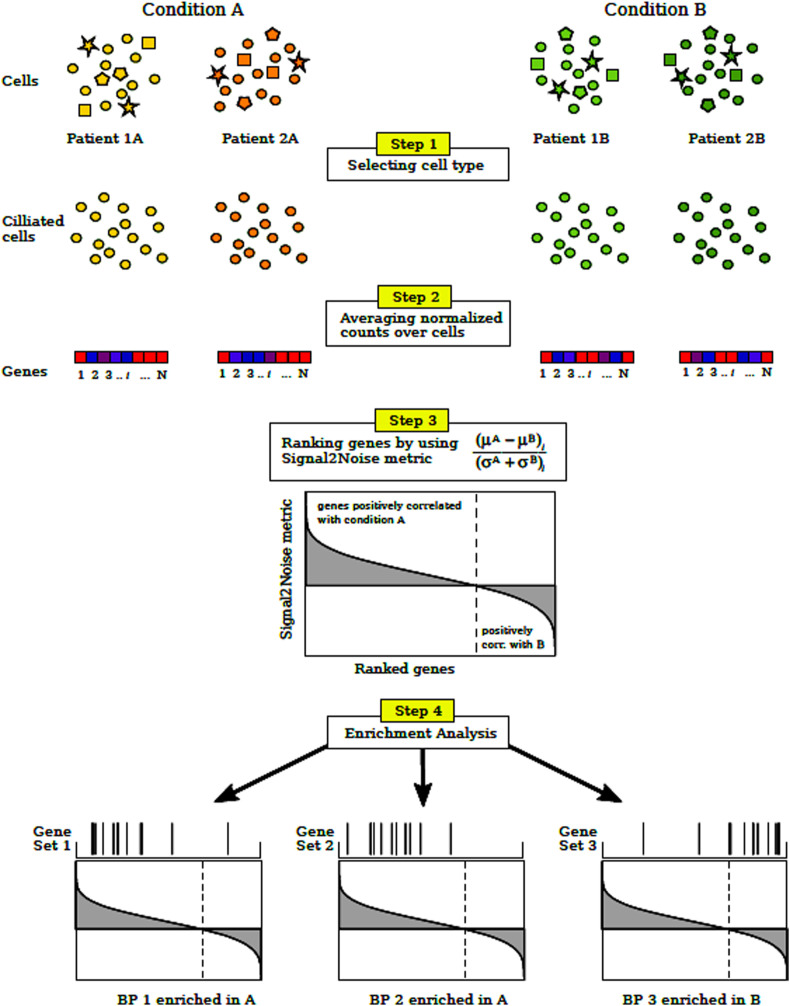
Methods: We used single-cell RNA sequencing (scRNAseq) profiling of ciliated cells (n = 12,725) from healthy controls (SARS-CoV-2 negative n = 13) and patients with mild/moderate (n = 13) and severe (n = 14) COVID-19. ScRNAseq data at the patient level were used to perform gene set and pathway enrichment analyses. We prioritized candidate miRNA-target interactions and epigenetic mechanisms.
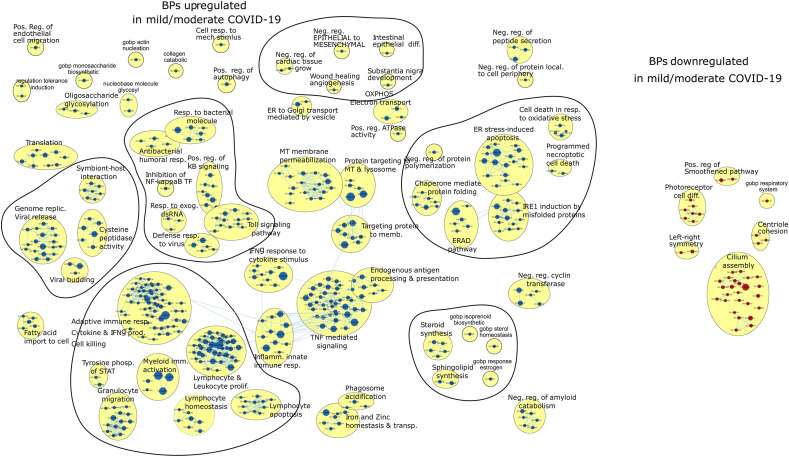
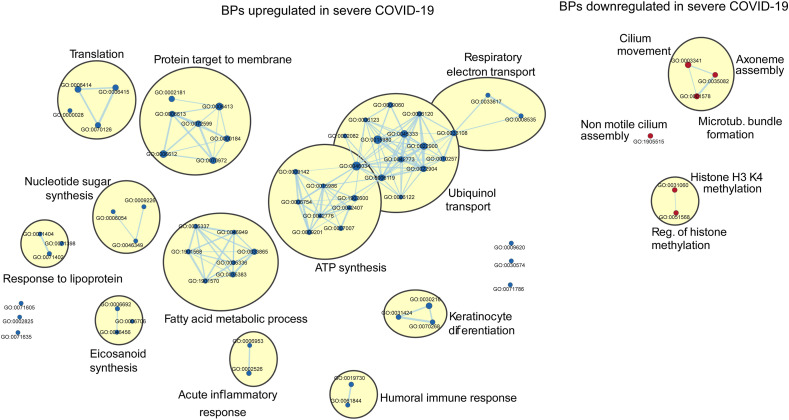
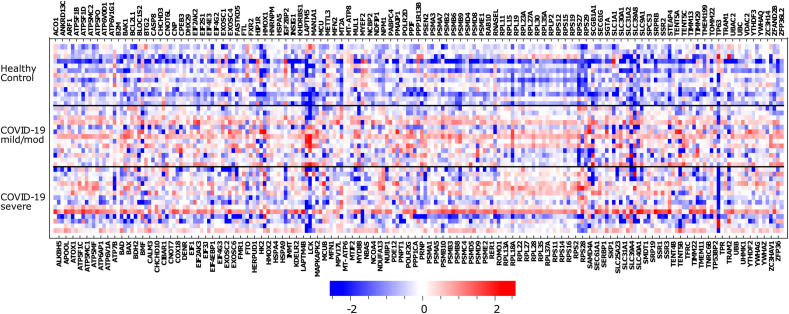
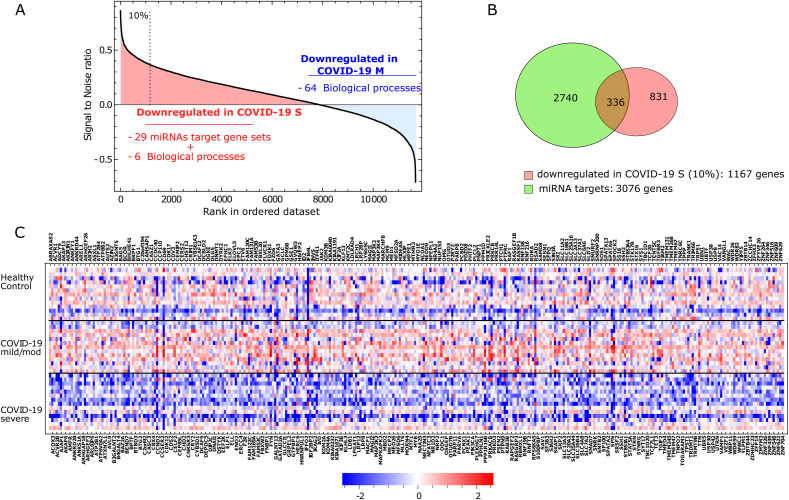
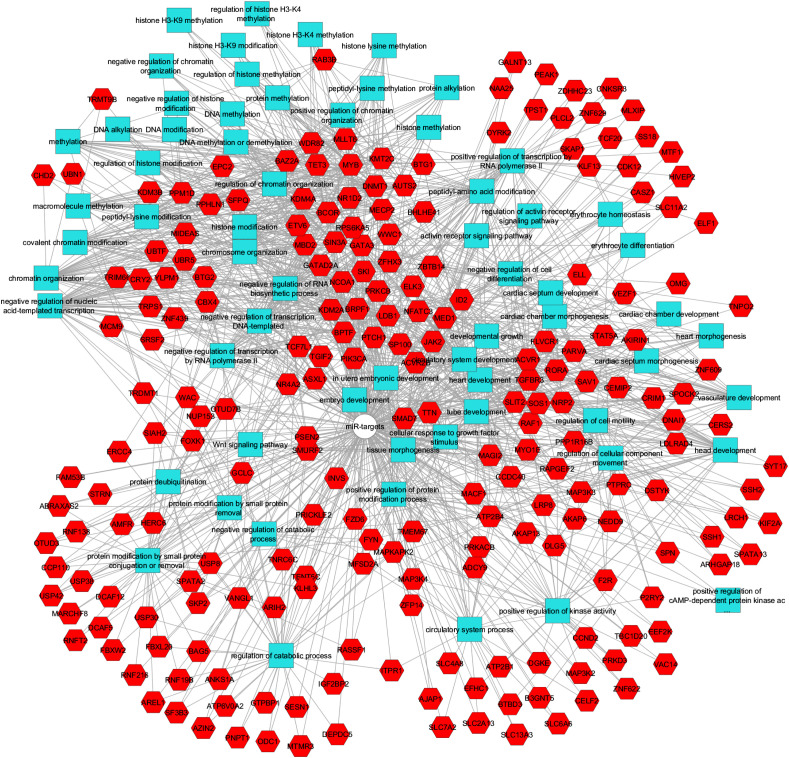
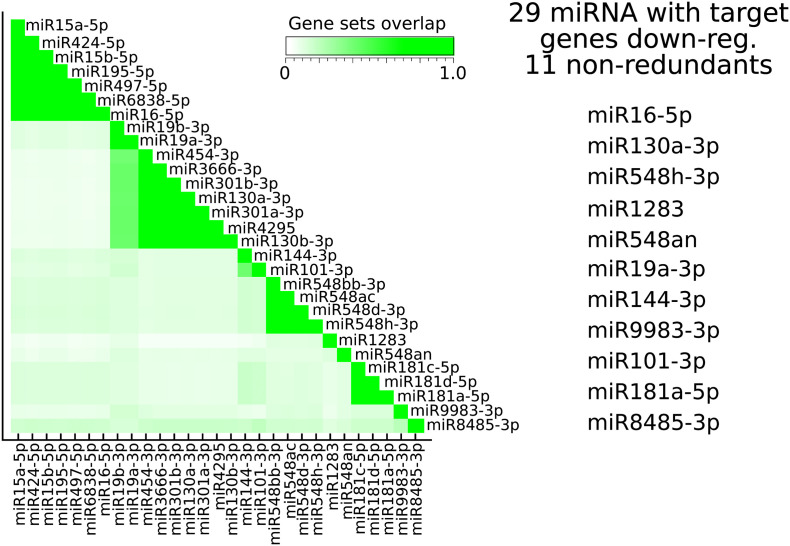
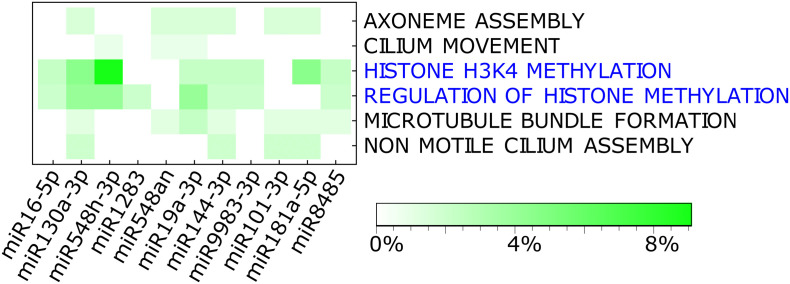
Results: We found that mild/moderate COVID-19 compared to healthy controls had upregulation of gene expression signatures associated with mitochondrial function, misfolded proteins, and membrane permeability. In addition, we found that compared to mild/moderate disease, severe COVID-19 had downregulation of epigenetic mechanisms, including DNA and histone H3K4 methylation and chromatin remodelling regulation. Furthermore, we found 11-ranked miRNAs that may explain miRNA-dependent regulation of histone methylation, some of which share seed sequences with SARS-CoV-2 miRNAs.
Conclusion: Our results may provide novel insights into the epigenetic mechanisms mediating the clinical course of SARS-CoV-2 infection.
Keywords: COVID-19; Histones; Methylation; Mitochondria; SARS-CoV-2; Single-cell transcriptomics.
Copyright © 2022 Elsevier Ltd. All rights reserved.
Conflict of interest statement
None Declared
Figures
Similar articles
-
Differential gene expression profiling reveals potential biomarkers and pharmacological compounds against SARS-CoV-2: Insights from machine learning and bioinformatics approaches.Front Immunol. 2022 Aug 17;13:918692. doi: 10.3389/fimmu.2022.918692. eCollection 2022. Front Immunol. 2022. PMID: 36059456 Free PMC article.
-
Genetic and epigenetic control of ACE2 expression and its possible role in COVID-19.Cell Biochem Funct. 2021 Aug;39(6):713-726. doi: 10.1002/cbf.3648. Epub 2021 Jun 1. Cell Biochem Funct. 2021. PMID: 34075603 Free PMC article. Review.
-
Predicted SARS-CoV-2 miRNAs Associated with Epigenetic Viral Pathogenesis and the Detection of New Possible Drugs for Covid-19.Curr Drug Deliv. 2021;18(10):1595-1610. doi: 10.2174/1567201818666210301102320. Curr Drug Deliv. 2021. PMID: 33645482
-
Epigenetic rewiring of pathways related to odour perception in immune cells exposed to SARS-CoV-2 in vivo and in vitro.Epigenetics. 2022 Dec;17(13):1875-1891. doi: 10.1080/15592294.2022.2089471. Epub 2022 Jun 26. Epigenetics. 2022. PMID: 35758003 Free PMC article.
-
Epigenetic mechanisms influencing COVID-19.Genome. 2021 Apr;64(4):372-385. doi: 10.1139/gen-2020-0135. Epub 2021 Jan 4. Genome. 2021. PMID: 33395363 Review.
Cited by
-
Single cell characterization of blood and expanded regulatory T cells in autoimmune polyendocrine syndrome type 1.iScience. 2024 Mar 27;27(4):109610. doi: 10.1016/j.isci.2024.109610. eCollection 2024 Apr 19. iScience. 2024. PMID: 38632993 Free PMC article.
-
Cell annotation using scRNA-seq data: A protein-protein interaction network approach.MethodsX. 2023 Apr 10;10:102179. doi: 10.1016/j.mex.2023.102179. eCollection 2023. MethodsX. 2023. PMID: 37128282 Free PMC article.
References
-
- Blomberg B., Mohn K.G., Brokstad K.A., Zhou F., Linchausen D.W., Hansen B.A., Lartey S., Onyango T.B., Kuwelker K., Saevik M., Bartsch H., Tondel C., Kittang B.R., Cox R.J., Langeland N. Long COVID in a prospective cohort of home-isolated patients. Nat. Med. 2021;27:1607–1613. doi: 10.1038/s41591-021-01433-3. - DOI - PMC - PubMed
-
- Guan W.J., Ni Z.Y., Hu Y., Liang W.H., Ou C.Q., He J.X., Liu L., Shan H., Lei C.L., Hui D.S.C., Du B., Li L.J., Zeng G., Yuen K.Y., Chen R.C., Tang C.L., Wang T., Chen P.Y., Xiang J., Li S.Y., Wang J.L., Liang Z.J., Peng Y.X., Wei L., Liu Y., Hu Y.H., Peng P., Wang J.M., Liu J.Y., Chen Z., Li G., Zheng Z.J., Qiu S.Q., Luo J., Ye C.J., Zhu S.Y., Zhong N.S. Clinical characteristics of coronavirus disease 2019 in China. N. Engl. J. Med. 2020 doi: 10.1056/NEJMoa2002032. - DOI - PMC - PubMed
-
- Huang C., Wang Y., Li X., Ren L., Zhao J., Hu Y., Zhang L., Fan G., Xu J., Gu X., Cheng Z., Yu T., Xia J., Wei Y., Wu W., Xie X., Yin W., Li H., Liu M., Xiao Y., Gao H., Guo L., Xie J., Wang G., Jiang R., Gao Z., Jin Q., Wang J., Cao B. Clinical features of patients infected with 2019 novel coronavirus in Wuhan, China. Lancet. 2020;395:497–506. doi: 10.1016/S0140-6736(20)30183-5. - DOI - PMC - PubMed
Publication types
MeSH terms
Substances
LinkOut - more resources
Full Text Sources
Medical
Miscellaneous
