. 2022 Aug 2;40(5):111161.
doi: 10.1016/j.celrep.2022.111161.

Prenatal environmental stressors impair postnatal microglia function and adult behavior in males

Affiliations

Prenatal environmental stressors impair postnatal microglia function and adult behavior in males

Carina L Block et al. Cell Rep. .

Abstract

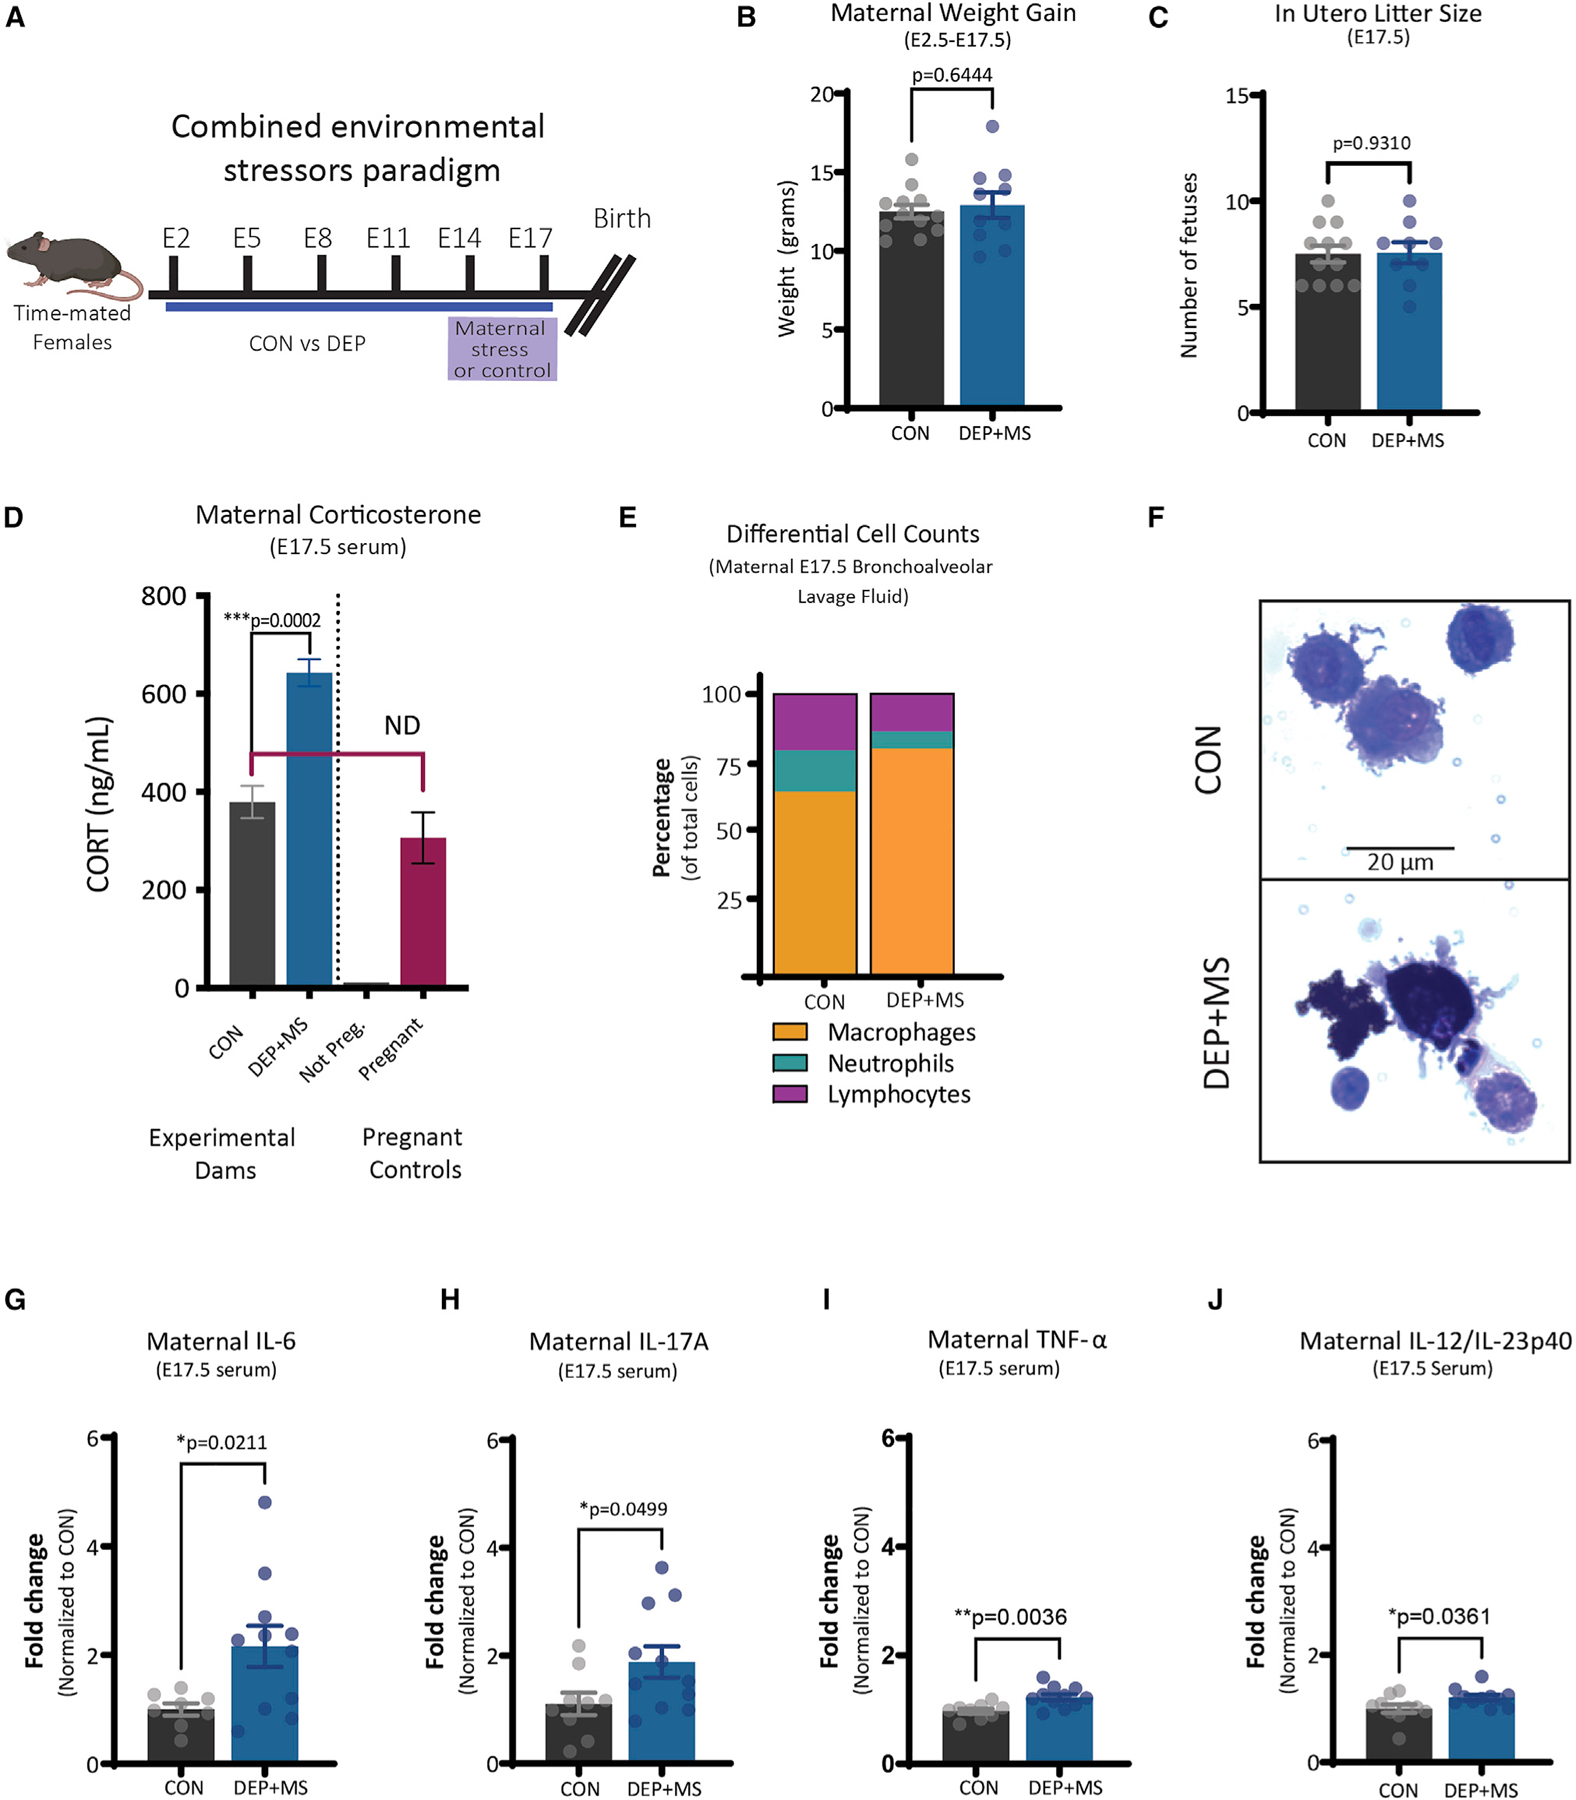
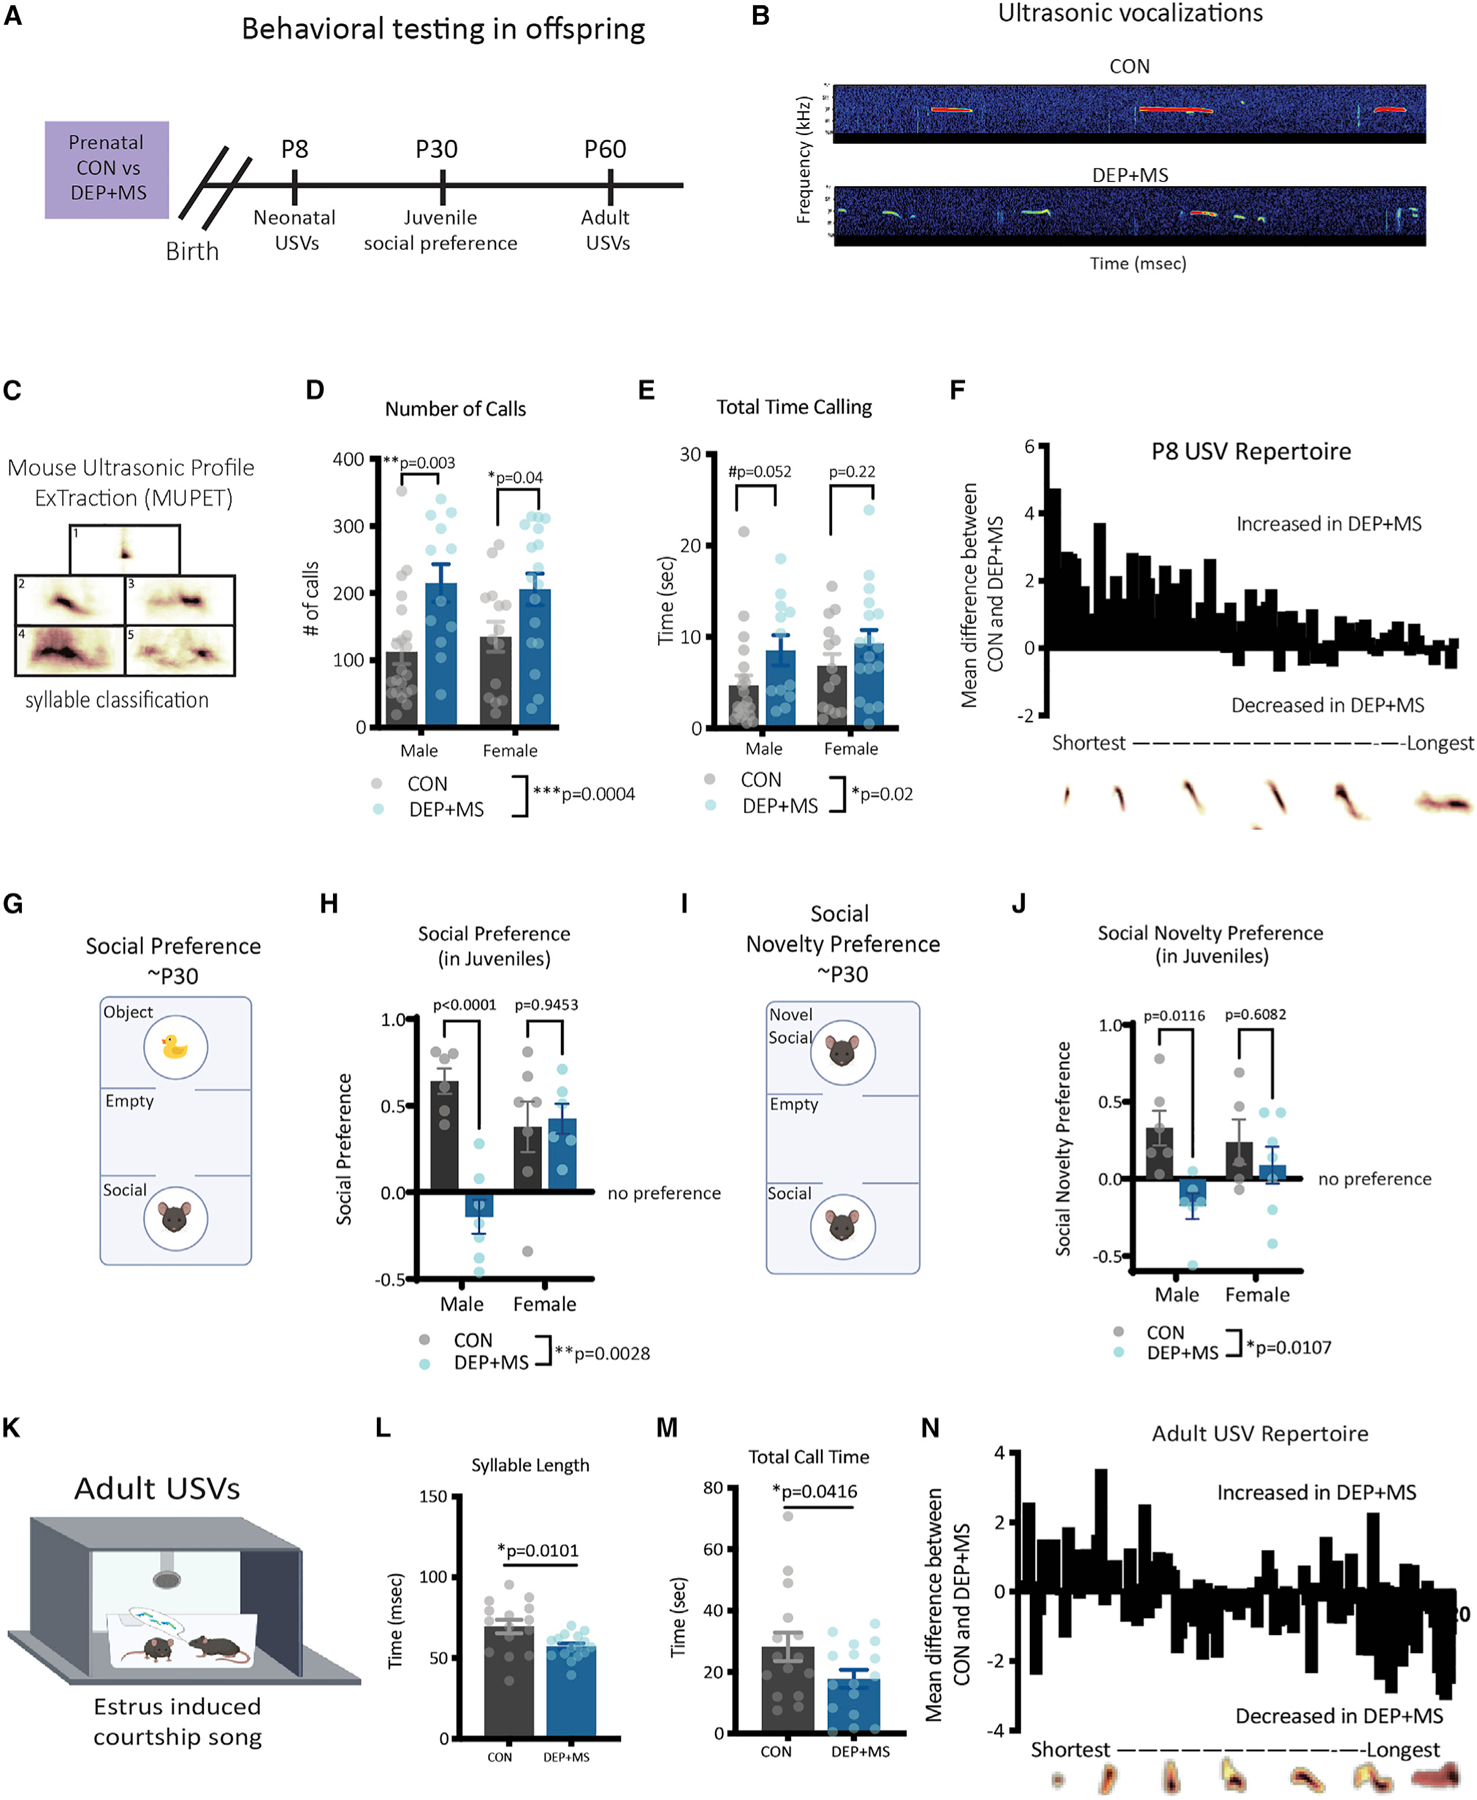
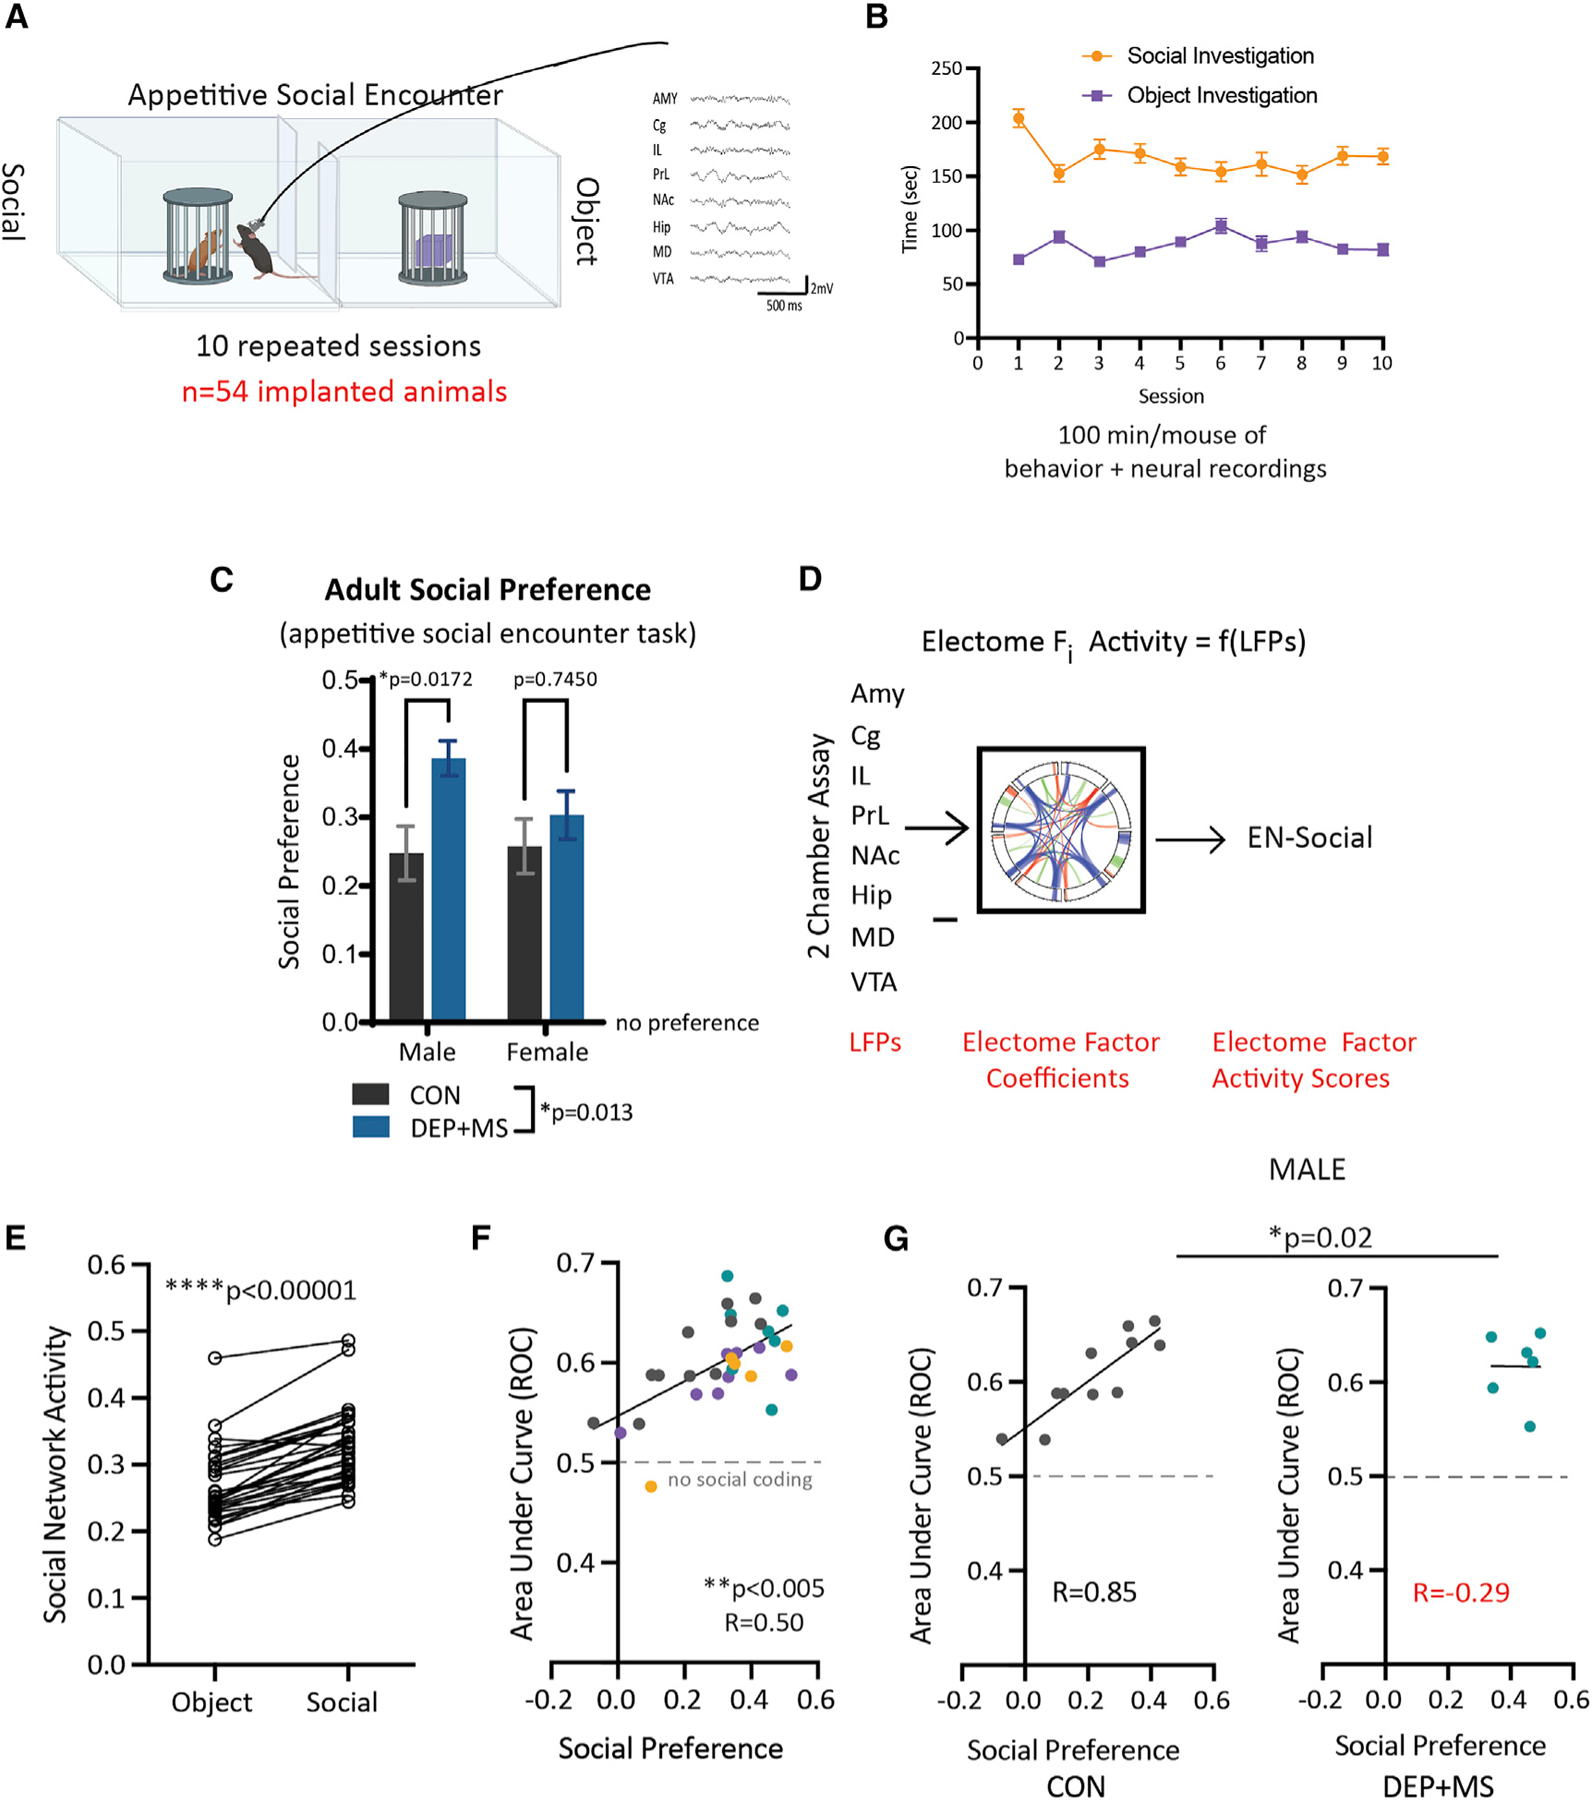
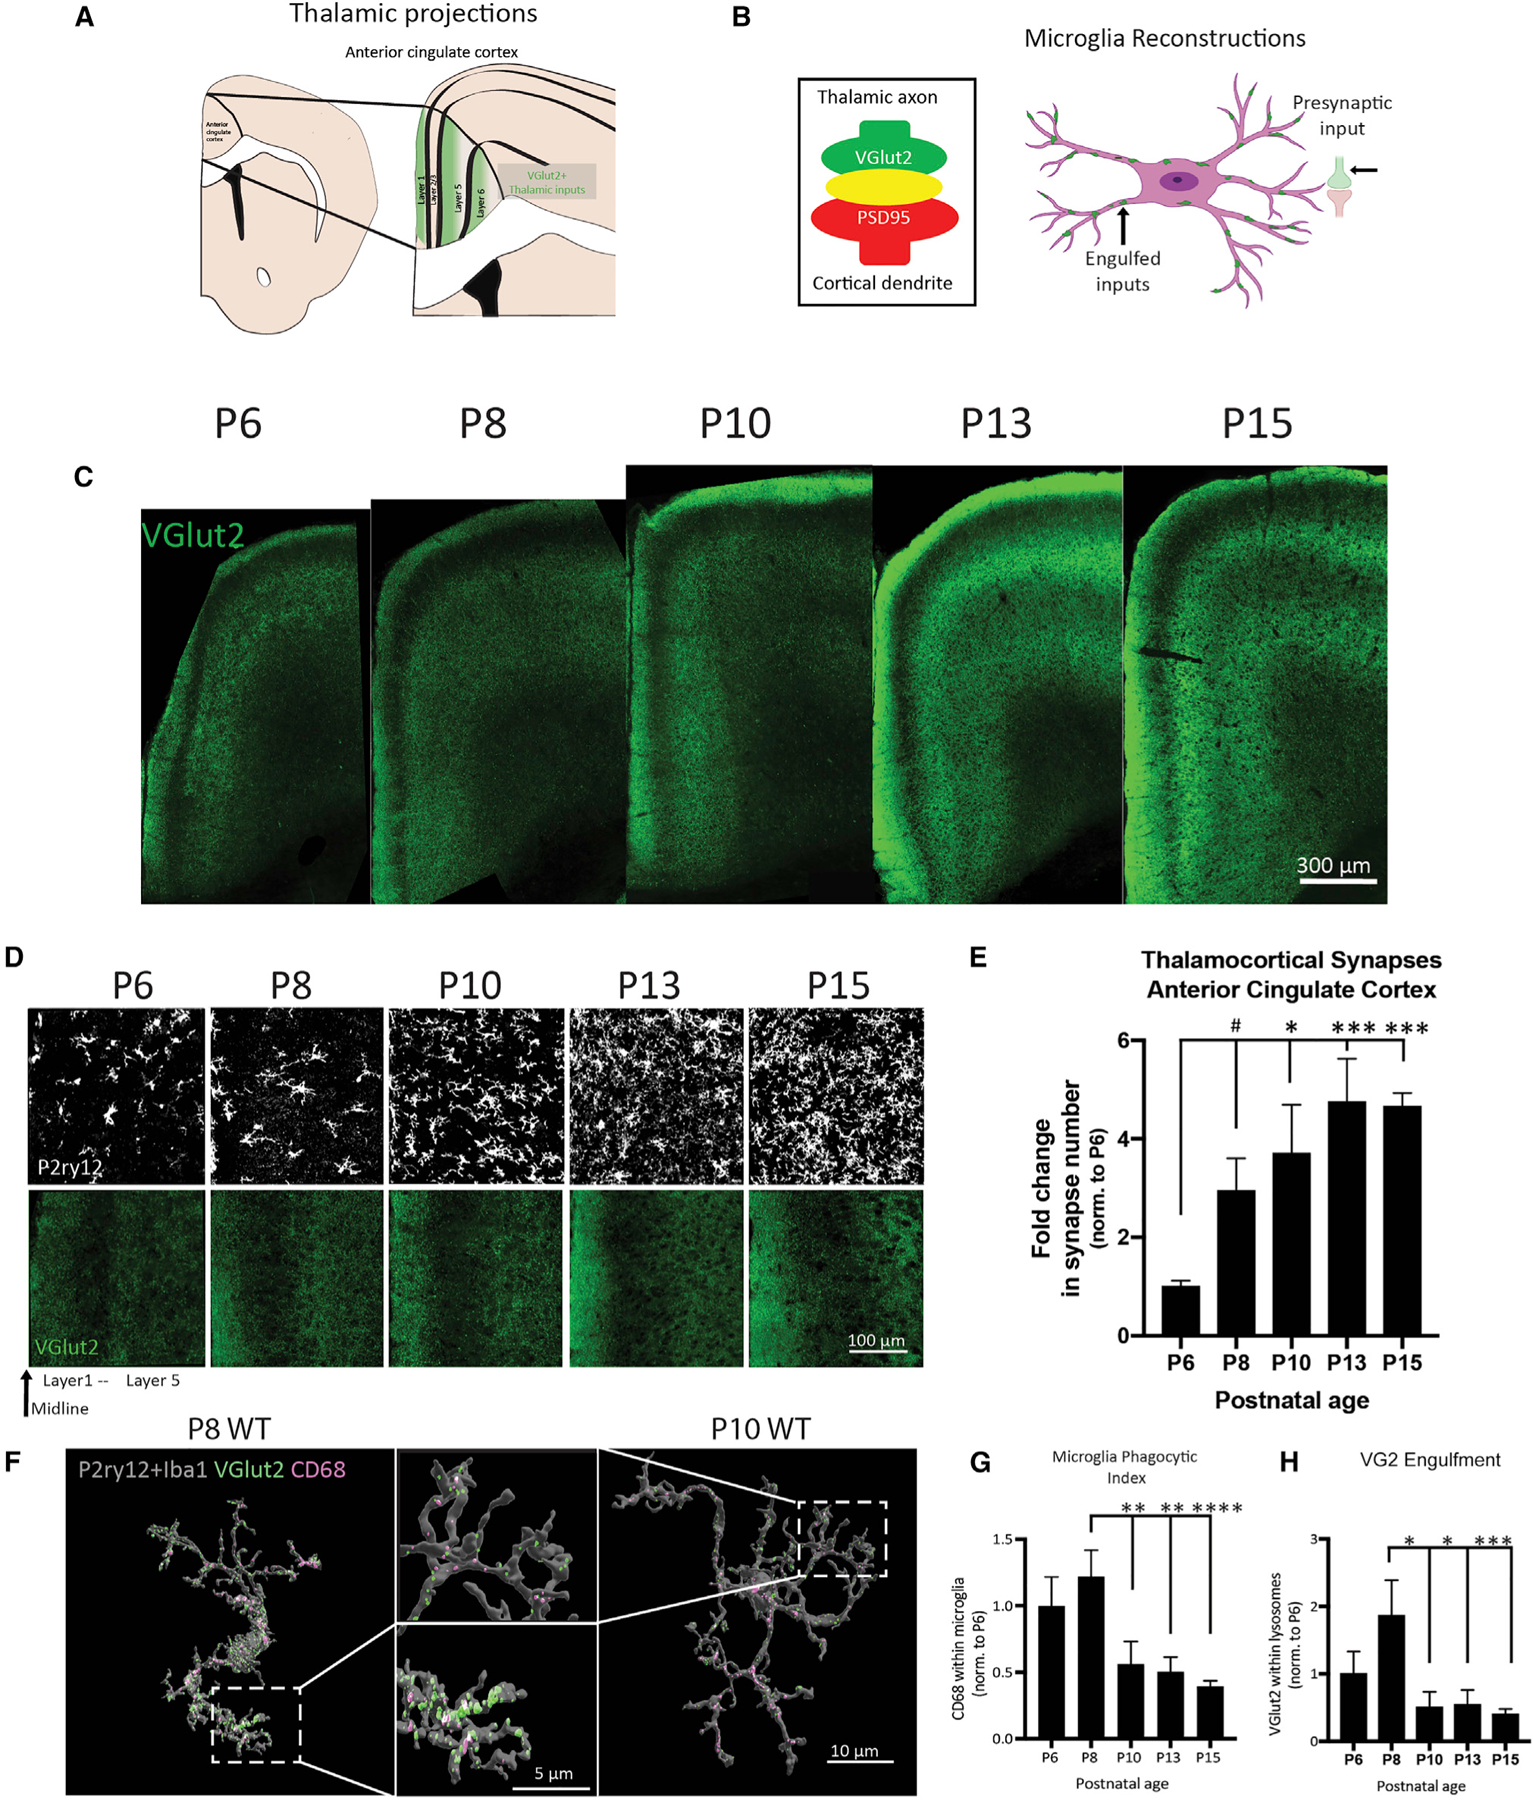
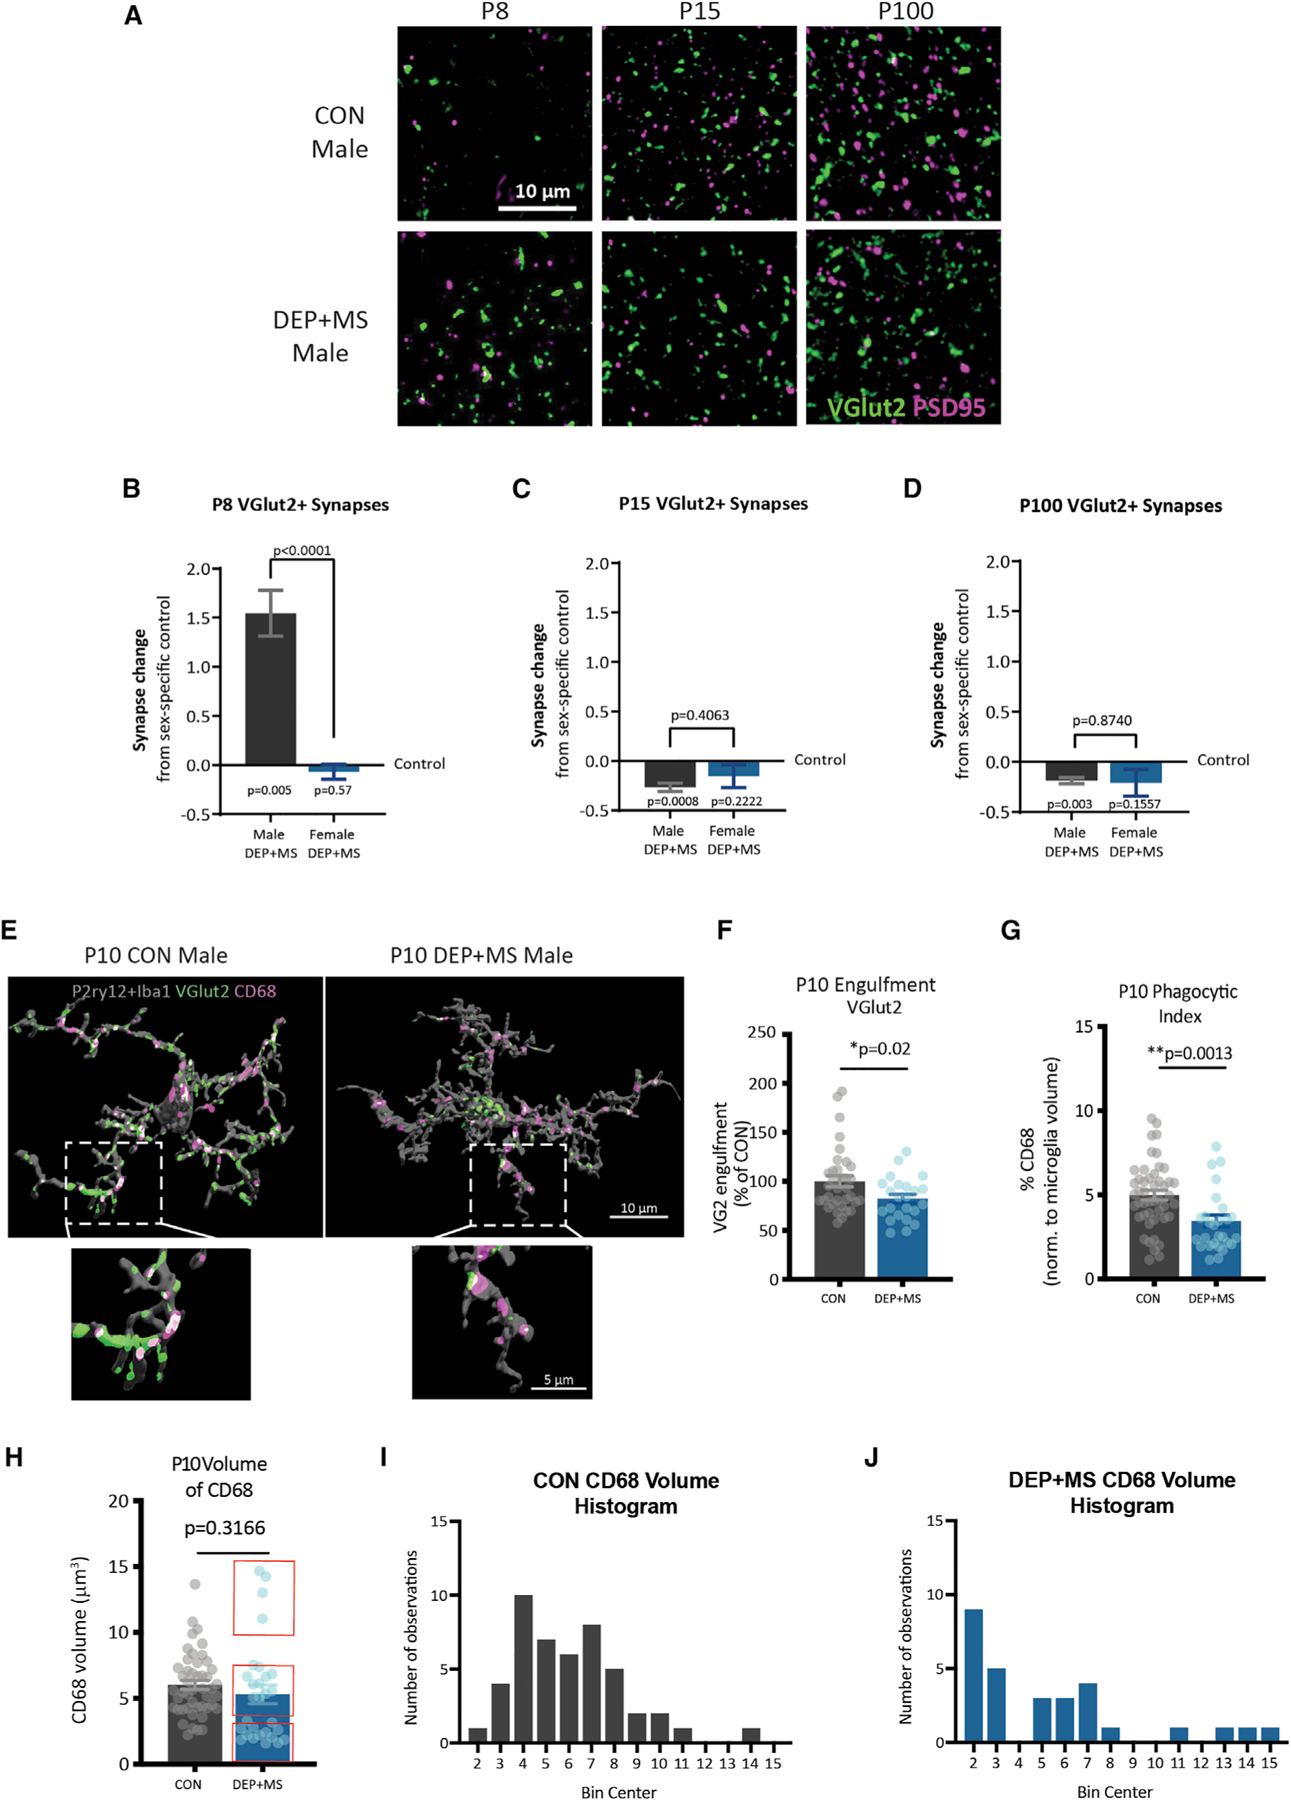
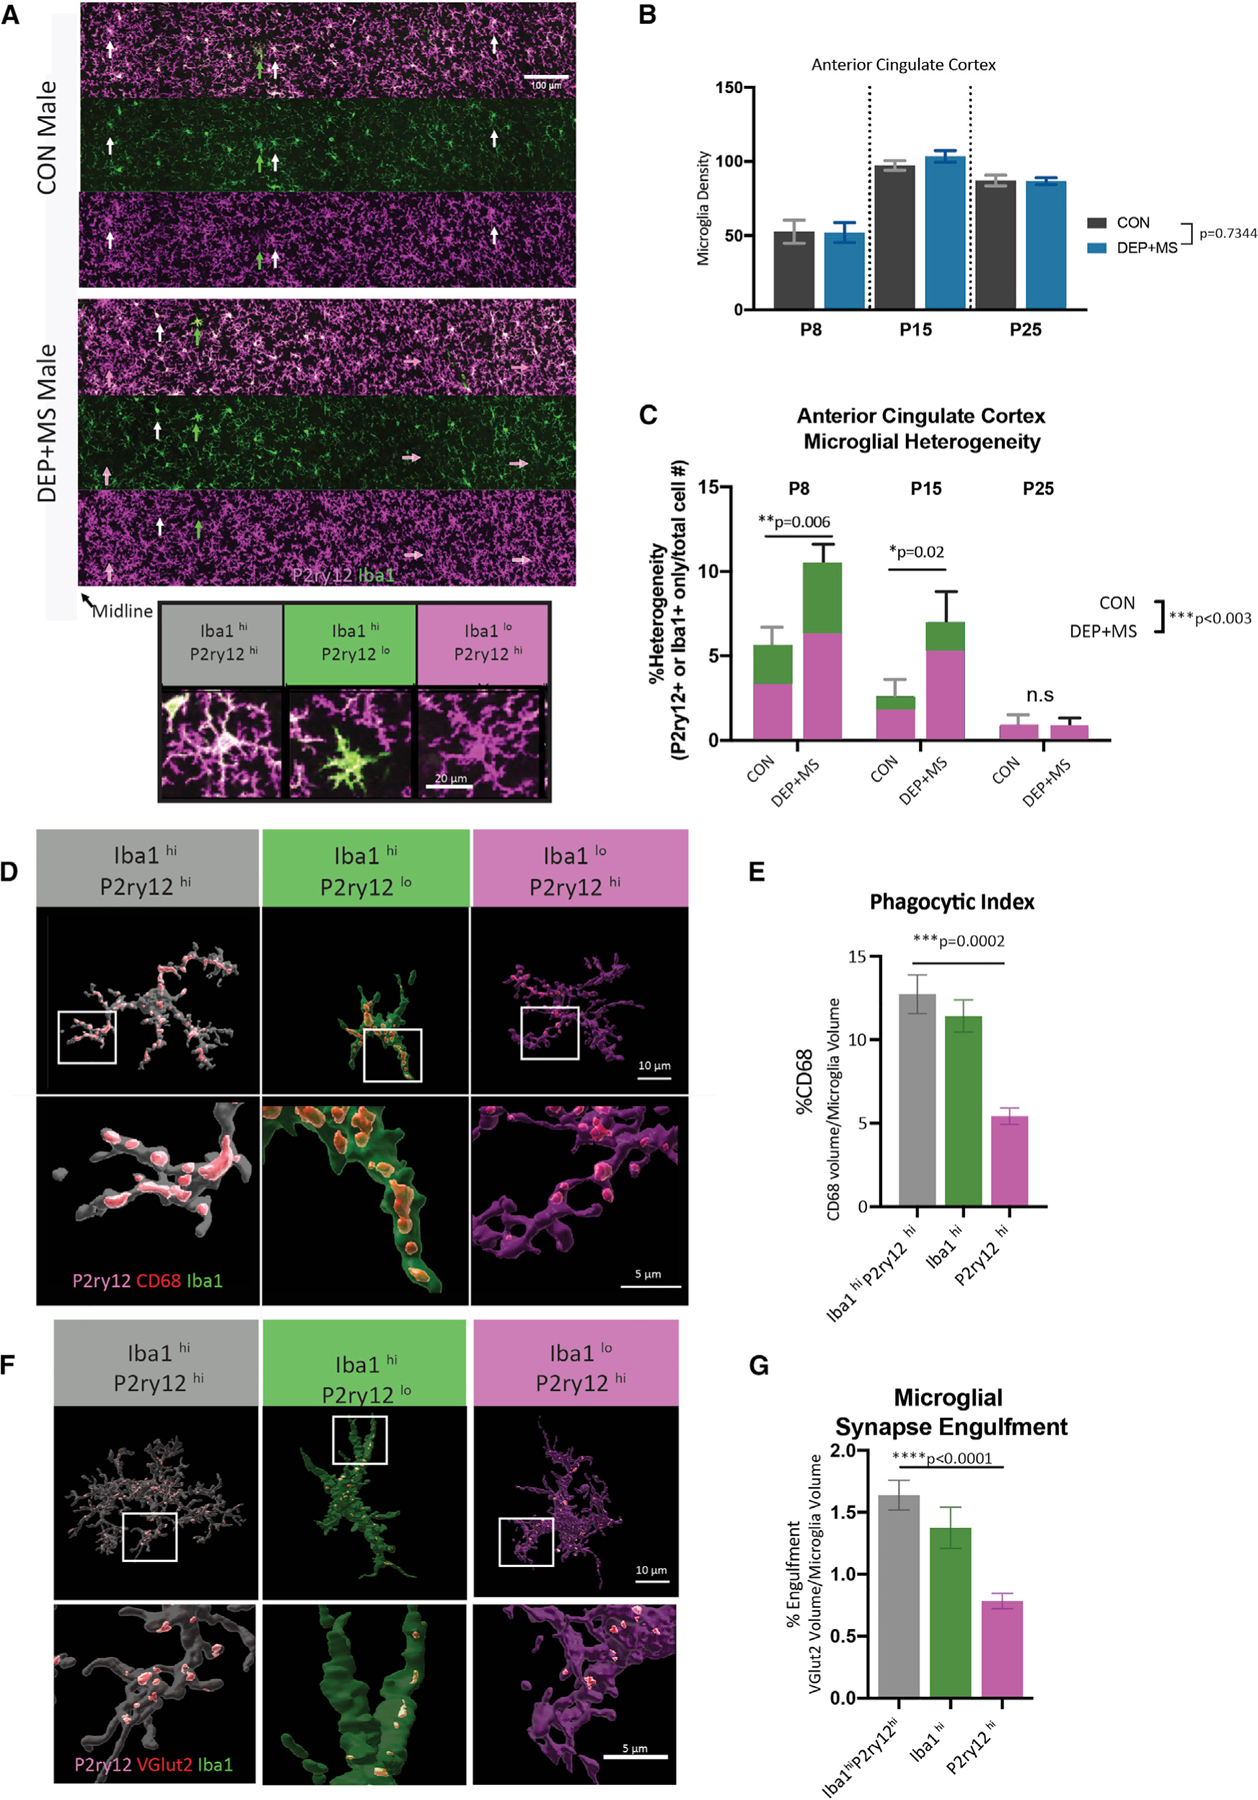
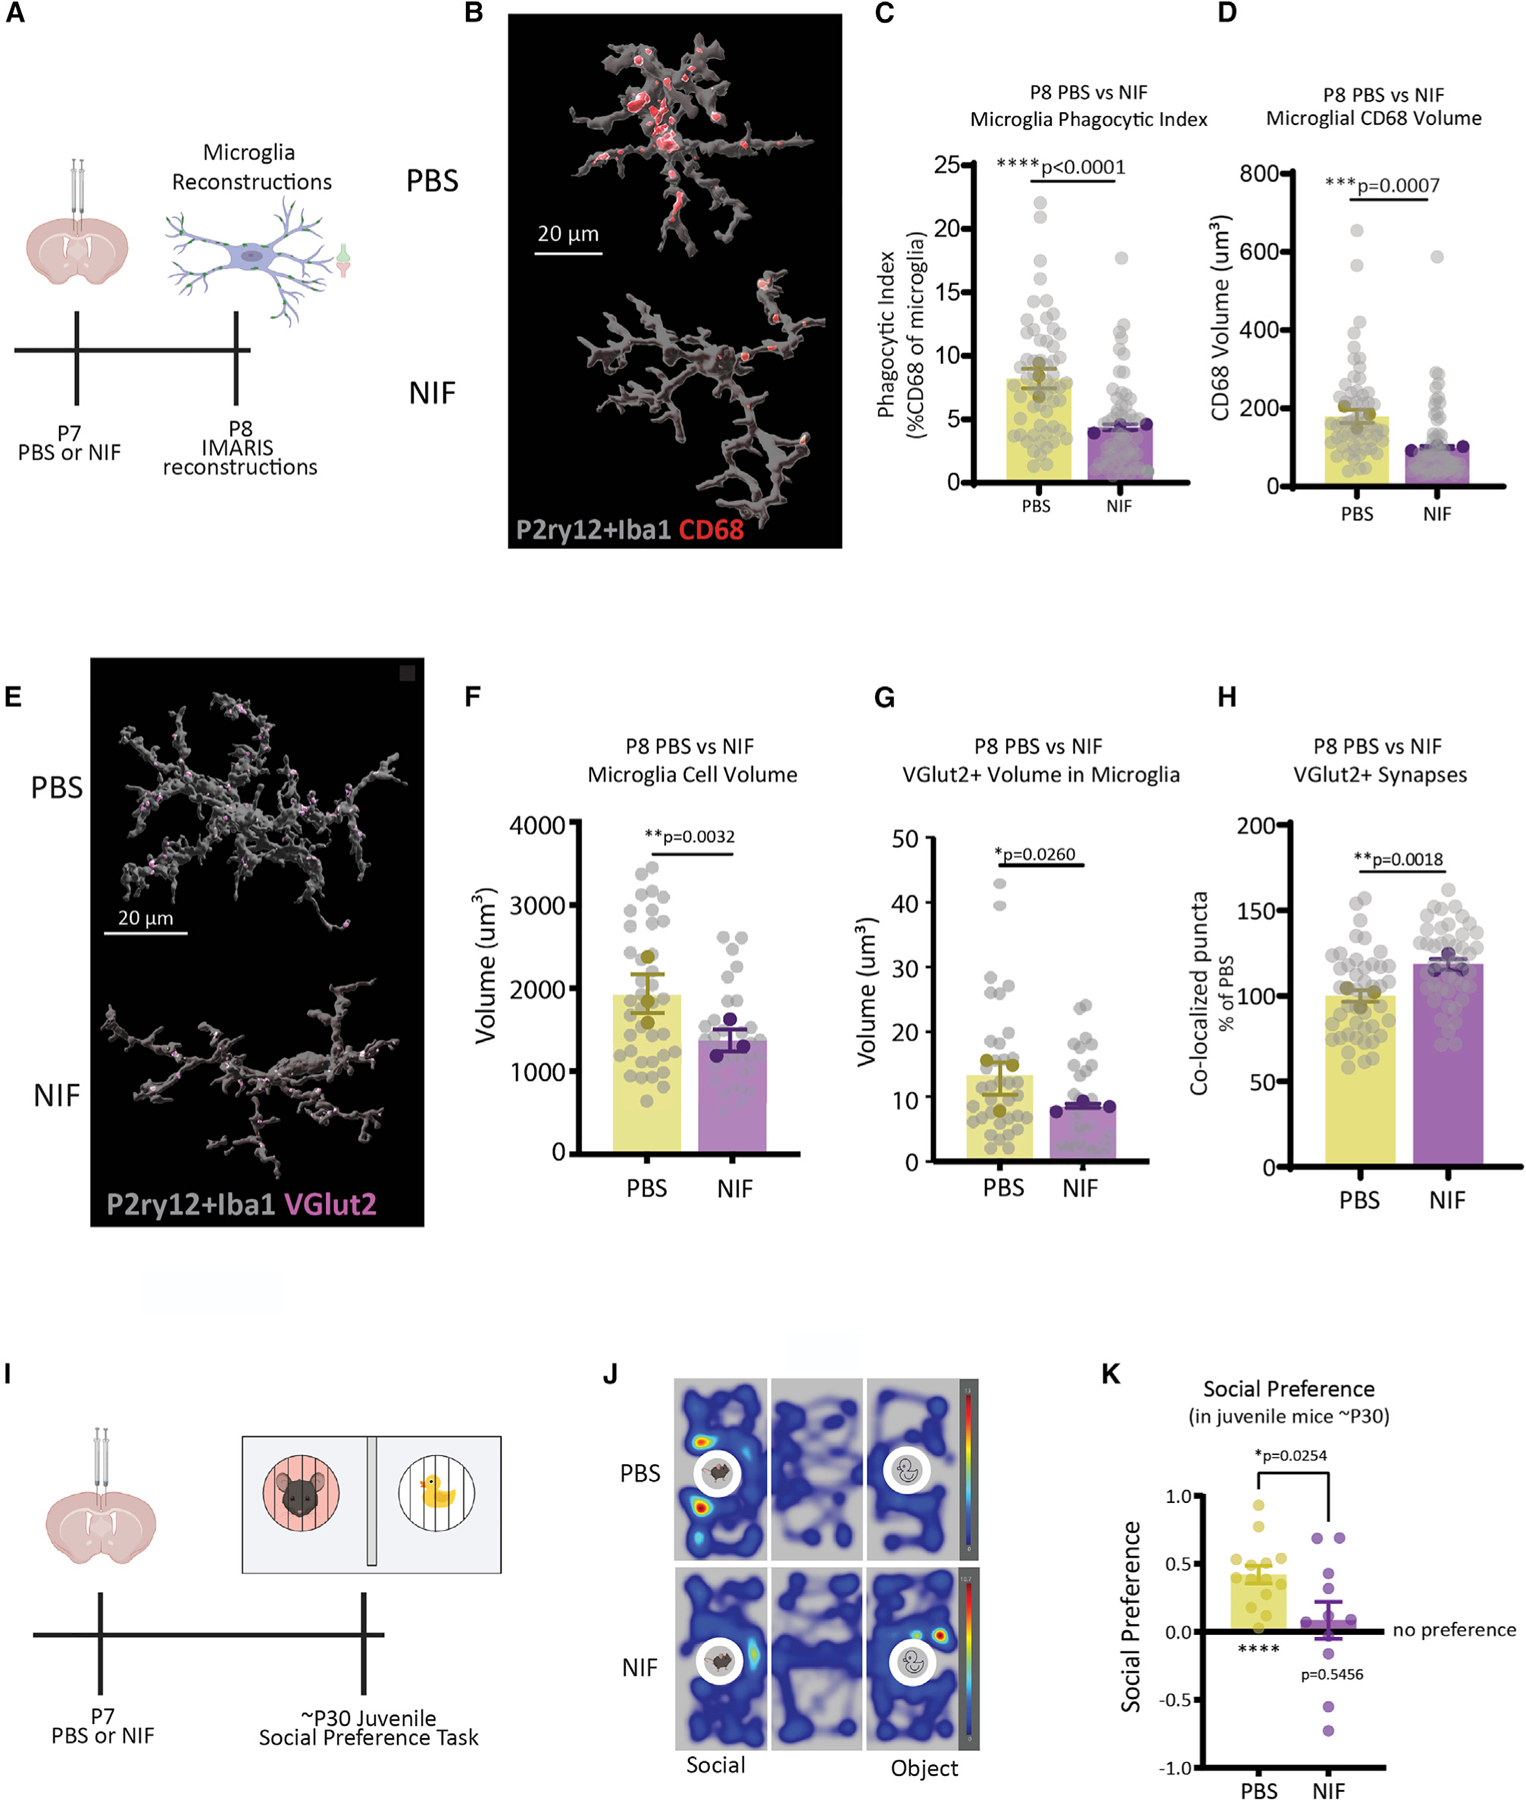
Gestational exposure to environmental toxins and socioeconomic stressors is epidemiologically linked to neurodevelopmental disorders with strong male bias, such as autism. We model these prenatal risk factors in mice by co-exposing pregnant dams to an environmental pollutant and limited-resource stress, which robustly activates the maternal immune system. Only male offspring display long-lasting behavioral abnormalities and alterations in the activity of brain networks encoding social interactions. Cellularly, prenatal stressors diminish microglial function within the anterior cingulate cortex, a central node of the social coding network, in males during early postnatal development. Precise inhibition of microglial phagocytosis within the anterior cingulate cortex (ACC) of wild-type (WT) mice during the same critical period mimics the impact of prenatal stressors on a male-specific behavior, indicating that environmental stressors alter neural circuit formation in males via impairing microglia function during development.

Keywords: CP: Neuroscience; air pollution; maternal immune activation; microglia; neurodevelopmental disorders; prenatal stressors; synapse.


Conflict of interest statement

Declaration of interest The authors declare no competing interests.

Figures

Figure 1.
Figure 1.. Combined prenatal stressors induce maternal immune activation
(A) Combined environmental stress paradigm. (B) Pregnancy weight gain from E2.5 to E17.5 (n = 10–12 mice/condition, unpaired t test). (C) In utero litter size at E17.5 (n = 10–12 mice/condition, unpaired t test). (D) Serum concentrations of CORT at E17.5 (left, n = 5–6 mice/condition), and compared with non-pregnant and pregnant WT controls (right, n = 1–3 mice, unpaired t test; ND, not different). (E) Differential cell count of BALF cells (n = 5 mice/condition). (F) Representative image of CON versus DEP + MS alveolar macrophages. (G–J) Serum concentrations of cytokines at E17.5 (n = 10–12 mice/condition, unpaired t test). Means ± SEM.
Figure 2.
Figure 2.. Combined prenatal stressors induce lasting changes in offspring communication and social behavior
(A) Behavioral testing in offspring born to CON and DEP + MS dams. (B) Representative spectrograms of USVs. (C) MUPET syllable classification. (D and E) USV number and total call time at P8 (n = 14–19 mice/condition/sex, two-way ANOVA with Holm-Sidak’s post hoc tests). (F) Repertoire units were organized from shortest to longest and displayed as the absolute difference between group means. (G and H) Schematic of three-chamber social preference test (n = 6–7 mice/condition/sex, two-way ANOVA with Sidak’s multiple comparisons post hoc tests). (I and J) Schematic of three-chamber social novelty preference test. (n = 6–7 mice/condition/sex, two-way ANOVA, with Sidak’s multiple comparisons post hoc tests). (K) Schematic of USV courtship assay. (L and M) Adult USV syllable length and call time (n = 15–17 mice/condition, unpaired t-tests). (N) Repertoire units organized from shortest to longest are displayed as the absolute difference between group means. Means ± SEM.
Figure 3.
Figure 3.. Functional activation of the social brain network is disrupted only in male offspring prenatally exposed to combined stressors
(A) CON and DEP + MS offspring were implanted with electrodes and underwent concurrent neural recording in an appetitive social encounter task. (B) Mice were tested in 10 repeated sessions to collect 100 min of concurrent neural and behavioral data per mouse (n = 13–14 mice/condition/sex). (C) Social preference in implanted adult mice (n = 13–14 mice/condition/sex, two-way ANOVA with Bonferroni’s multiple comparisons post hoc tests). (D) LFP activity obtained during social behavior was projected into the learned electrical functional connectivity (electome) factor coefficients to generate the EN-social. (E) Mice showed higher EN-social activity during social compared with object interactions (n = 32 animals, sign-rank test). (F) The decoding accuracy of EN-social activity signaled social preference across the population of implanted mice (n = 32 animals, Spearman correlation). (G) Prenatal DEP + MS exposure disrupted the relationship between EN-social activity and appetitive social behavior in male mice (n = 6–11 mice/condition, analysis of covariance with Box-Cox transformation with Spearman’s correlation). Means ± SEM.
Figure 4.
Figure 4.. The second week of postnatal development is a critical window for ACC development
(A) Thalamic inputs onto the ACC are marked by VGlut2. (B) Synapses can be quantified by the co-localization of VGlut2 and PSD95 (left). 3D cell reconstructions allow for visualizing internalized inputs inside microglia (right). (C) Representative tile scan images of the ACC across development. (D) Representative images of VGlut2 and P2ry12 in the ACC of WT mice from P6 to P15. (E) Quantification of VGlut2 synapses in the ACC (n = 4 mice/age, 2M, 2F, three replicates/mouse, 300 images analyzed, data normalized to P6, one-way ANOVA with Holm-Sidak’s multiple comparisons post hoc tests). (F) Representative Imaris 3D reconstructions of microglia from WT P8 and P10 male mice. Lysosomes (CD68) and TC inputs (VGlut2) can be visualized inside microglia and quantified. (G and H) Quantification of CD68 and VGlut2 volume internalized in microglia (n = 6–7 cells/mice, two male mice/age, 75 microglia cells reconstructed, all values normalized to cell volume and engulfment normalized to P6, one-way ANOVA with Holm-Sidak’s multiple comparisons post hoc tests). ****p < 0.0001, ***p < 0.001, **p < 0.01, *p < 0.05; means ± SEM.
Figure 5.
Figure 5.. Prenatal DEP + MS induces enduring changes in thalamocortical synapse development and microglia elimination of synapses
(A) Representative images of TC synapses in the ACC of P8, P15, and P100 CON and DEP + MS male mice. (B–D) Quantification of TC synapses at P8, P15, and P100 in male and female offspring. Graphed as synapse change from sex-specific control (value of zero indicates no change from control). Three mice/condition/sex, n = 3 replicates/mouse, 540 images/age analyzed, one-sample t test comparison from control, unpaired t test between sexes. (E) Representative surface rendered microglia from the ACC of P10 CON and DEP + MS male offspring labeled with P2ry12 + Iba1, VGlut2, and CD68. (F and G) Microglial engulfment of VGlut2, and microglial CD68 content (n = 3–4 replicates/mouse, thee mice/condition, 110 total images analyzed, nested t test). (H–J) Volume of CD68 in microglia. Histogram of CD68 distribution in CON (I, left) and DEP + MS (J, right) (Levene’s test for homogeneity of variance, p = 0.0117) (n = 3–4 replicates/mouse, three mice/condition, 110 total images analyzed, nested t test). Means ± SEM.
Figure 6.
Figure 6.. Microglial development and synaptic engulfment are altered in male offspring prenatally exposed to combined stressors
(A) Top: representative images of microglia labeled with P2ry12 and Iba1 in the ACC of P15 male offspring, arrows highlight microglia differentially marked by P2ry12 and Iba1 (white = both high; green = Iba1 high, magenta = P2ry12 high). Bottom: representative images of microglia with heterogeneous levels of expression of Iba1 and P2ry12 in the developing cortex. (B) Quantification of microglial density across development in male offspring in the ACC (n = 3 replicates/mouse, three or four mice/condition/age, >6,000 cells counted, two-way ANOVA, condition × age). (C) Quantification of microglial heterogeneity across development in male offspring in the ACC (n = 3 replicates/mouse, three or four mice/condition/age, >6,000 cells counted, two-way ANOVA condition × age, with Sidak’s post hoc test, n.s., not significantly different). (D) Representative Imaris reconstructions of microglia at P8 with lysosomal content (CD68) in microglial subtypes. (E) CD68 content in microglial subtypes (n = 5–10 cells/mouse/cell subtype, n = 3 animals/condition, a total of 120 cells analyzed, nested one-way ANOVA with Holm-Sidak’s post hoc test). (F and G) Representative Imaris reconstructions and quantification of microglial engulfment of VGlut2 in different microglial subtypes (n = 5–12 cells/mouse/cell subtype, n = 3 mice/condition, a total of 168 reconstructed cells, nested one-way ANOVA with Holm-Sidak’s post hoc test). Means ± SEM.
Figure 7.
Figure 7.. Early postnatal impairment of microglial phagocytic function is sufficient to induce social behavior impairments in male juvenile mice
(A) PBS or NIF was microinjected into the ACC of P7 WT male mice. Microglial phagocytic content and engulfment were assessed at P8. (B–D) Representative images and quantification of microglial phagocytic index and CD68 volume in PBS- versus NIF-injected mice (n = 15–20 cells/mouse/condition, n = 3 mice/condition, total of 114 cells analyzed, nested t test). (E–G) Representative images and quantification of microglial volume and internalized VGlut2 in PBS- versus NIF-injected mice (n = 10–15 cells/mouse/condition, n = 3 mice/condition, total of 72 cells analyzed, nested t test). (H) Quantification of VGlut2+ synapses in PBS versus NIF mice (n = 3 mice/condition, n = 3 replicates/mouse, 270 images analyzed, nested t test). (I) PBS or NIF was microinjected into the ACC of P7 mice, then mice were tested in a social preference task at ~ P30. (J) Representative heatmap of PBS versus NIF juvenile mouse exploration of social versus object. (K) Quantification of social (n = 11–14 mice/condition, one-sample t test, unpaired t test). Means ± SEM.

Similar articles

Cited by

References

    1. Apprill A, McNally S, Parsons R, and Weber L (2015). Minor revision to V4 region SSU rRNA 806R gene primer greatly increases detection of SAR11 bacterioplankton. Aquat. Microb. Ecol 75, 129–137.
    1. Ayata P, Badimon A, Strasburger HJ, Duff MK, Montgomery SE, Loh YHE, Ebert A, Pimenova AA, Ramirez BR, Chan AT, et al. (2018). Epigenetic regulation of brain region-specific microglia clearance activity. Nat. Neurosci 21, 1049–1060. - PMC - PubMed
    1. Barnett L, and Seth AK (2014). The MVGC multivariate Granger causality toolbox: a new approach to Granger-causal inference. J. Neurosci. Methods 223, 50–68. - PubMed
    1. Bennett PJG, Maier E, and Brecht M (2019). Involvement of rat posterior prelimbic and cingulate area 2 in vocalization control. Eur. J. Neurosci 50, 3164–3180. - PMC - PubMed
    1. Kroger A, Bletsch A, Krick C, Siniatchkin M, Jarczok TA, Freitag CM, and Bender S (2014). Visual event-related potentials to biological motion stimuli in autism spectrum disorders. Soc. Cogn. Affect. Neurosci 9, 1214–1222. - PMC - PubMed

Publication types