. 2022 Aug 2;40(5):111156.
doi: 10.1016/j.celrep.2022.111156.

METTL14-dependent m6A modification controls iNKT cell development and function

Affiliations

METTL14-dependent m6A modification controls iNKT cell development and function

Liang Cao et al. Cell Rep. .

Abstract

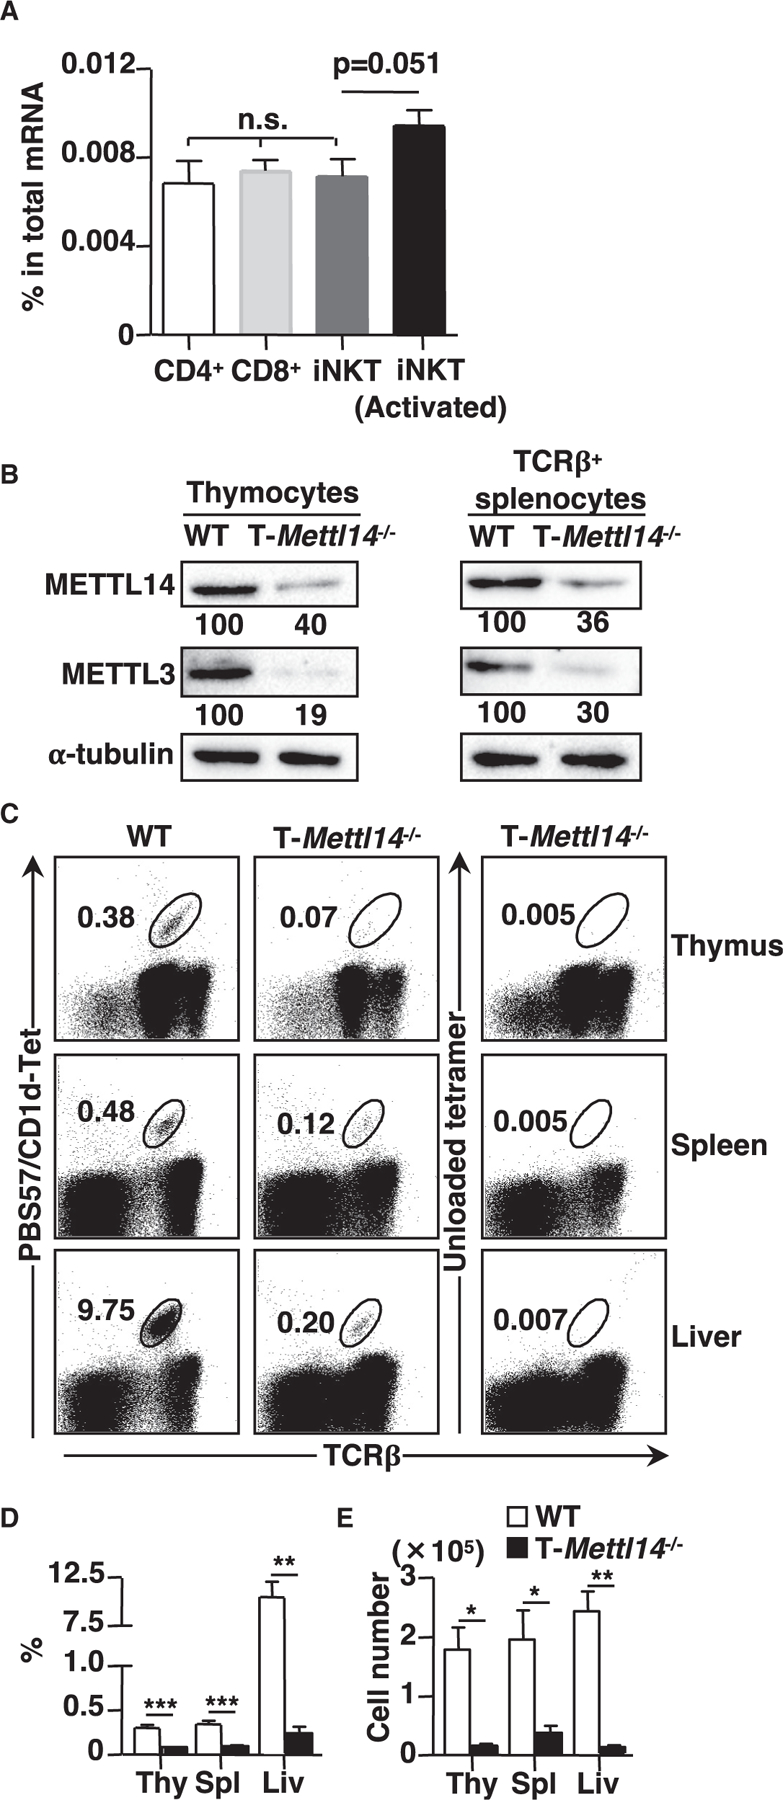
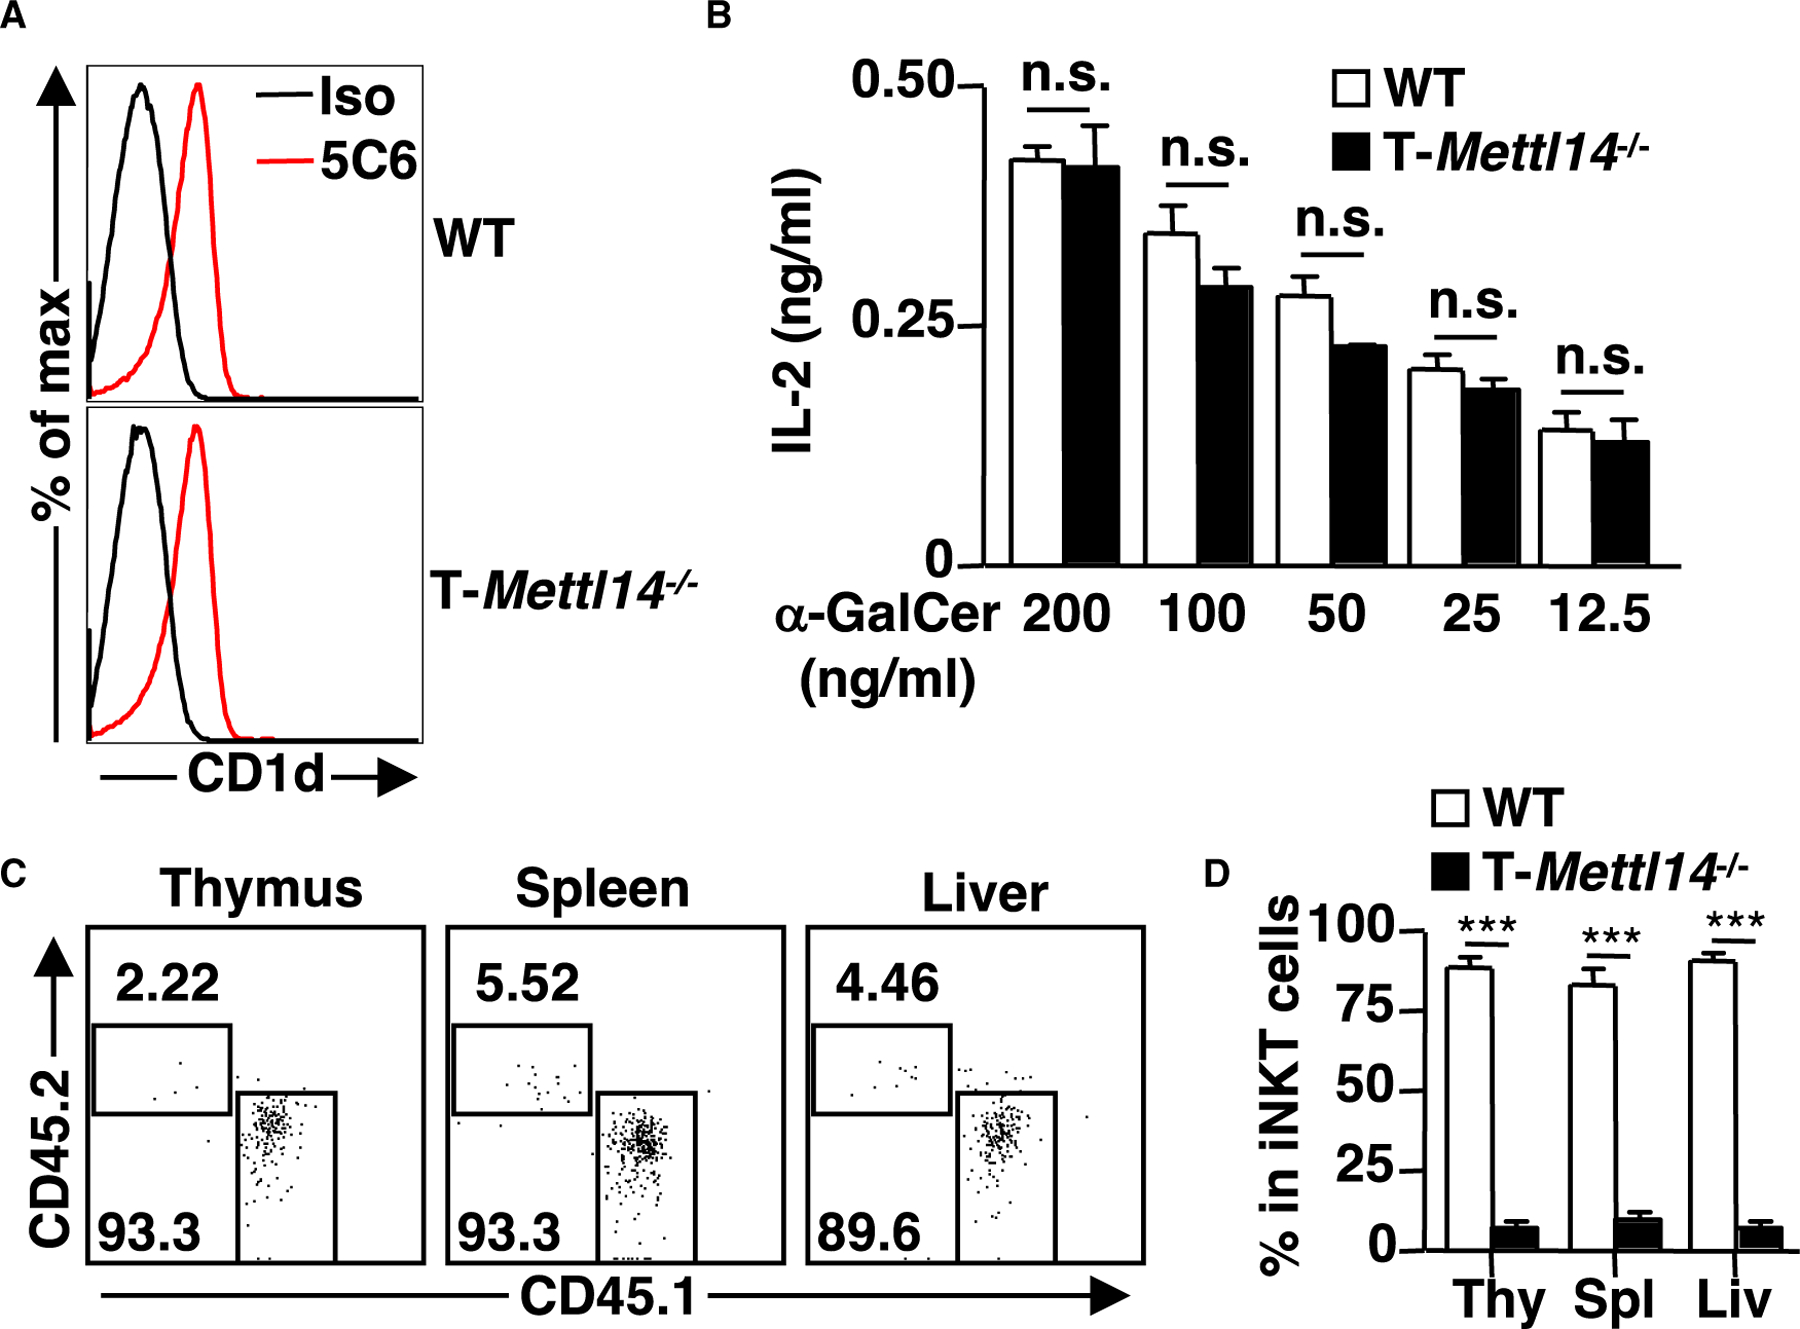
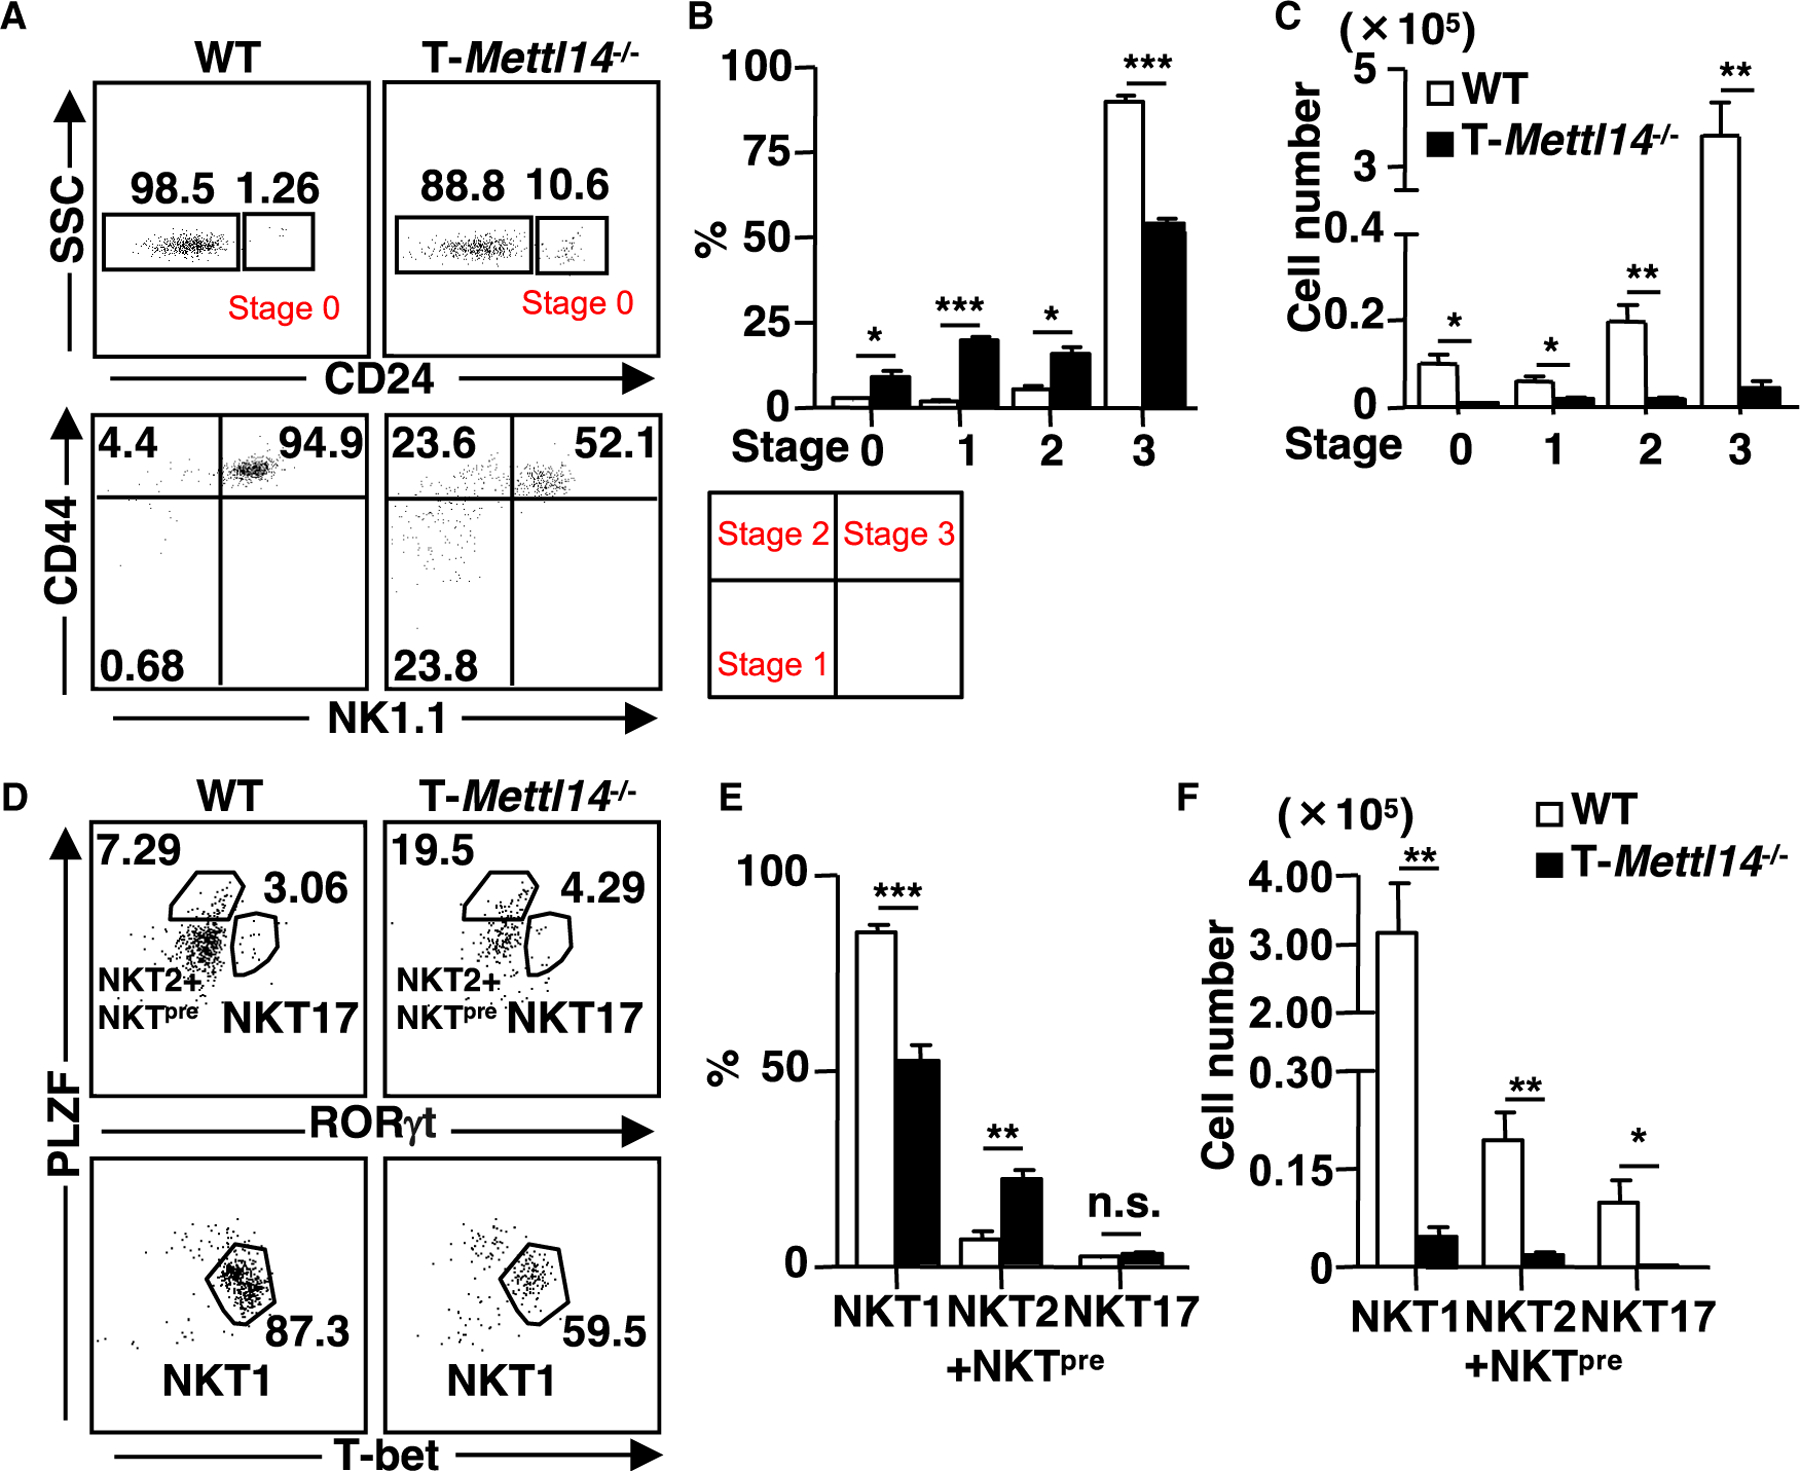
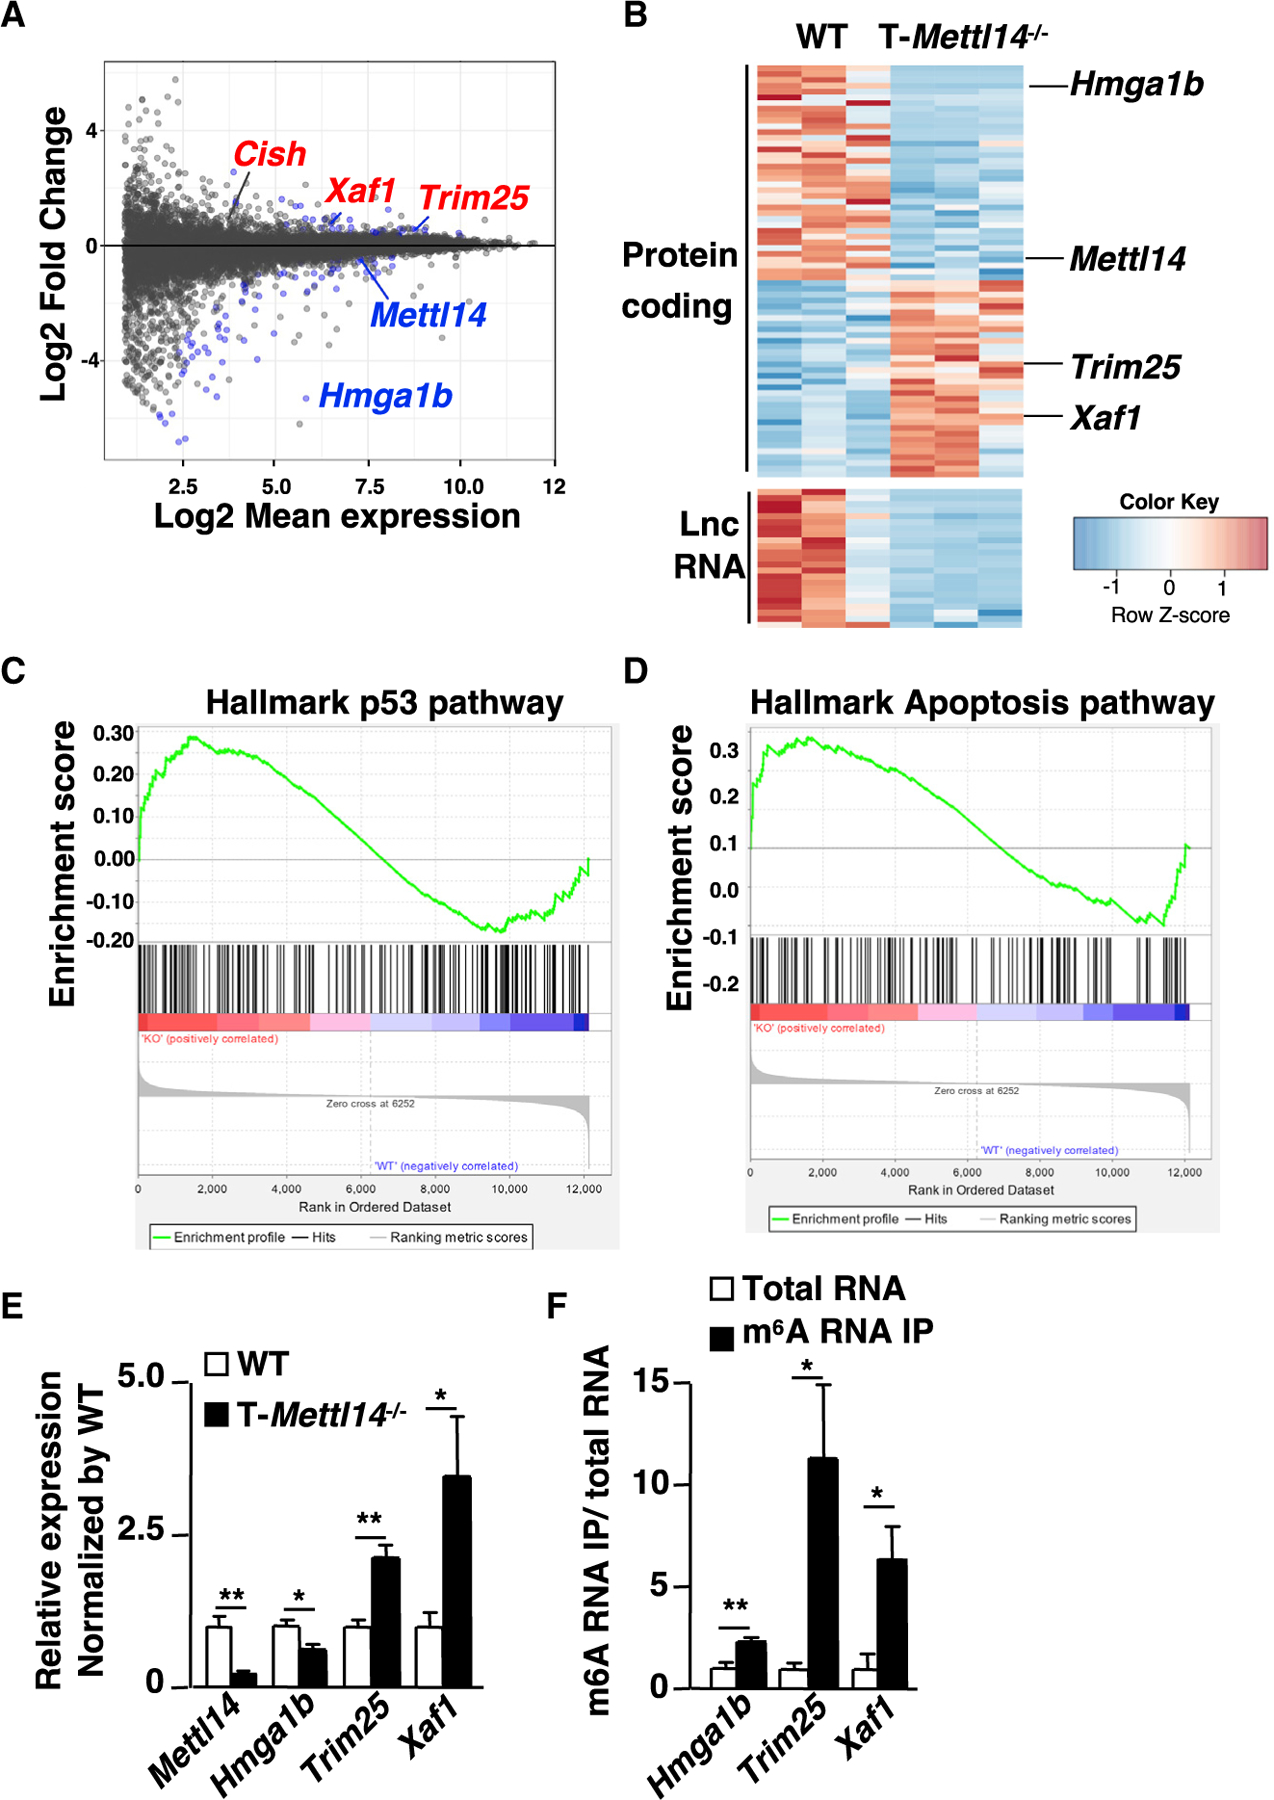
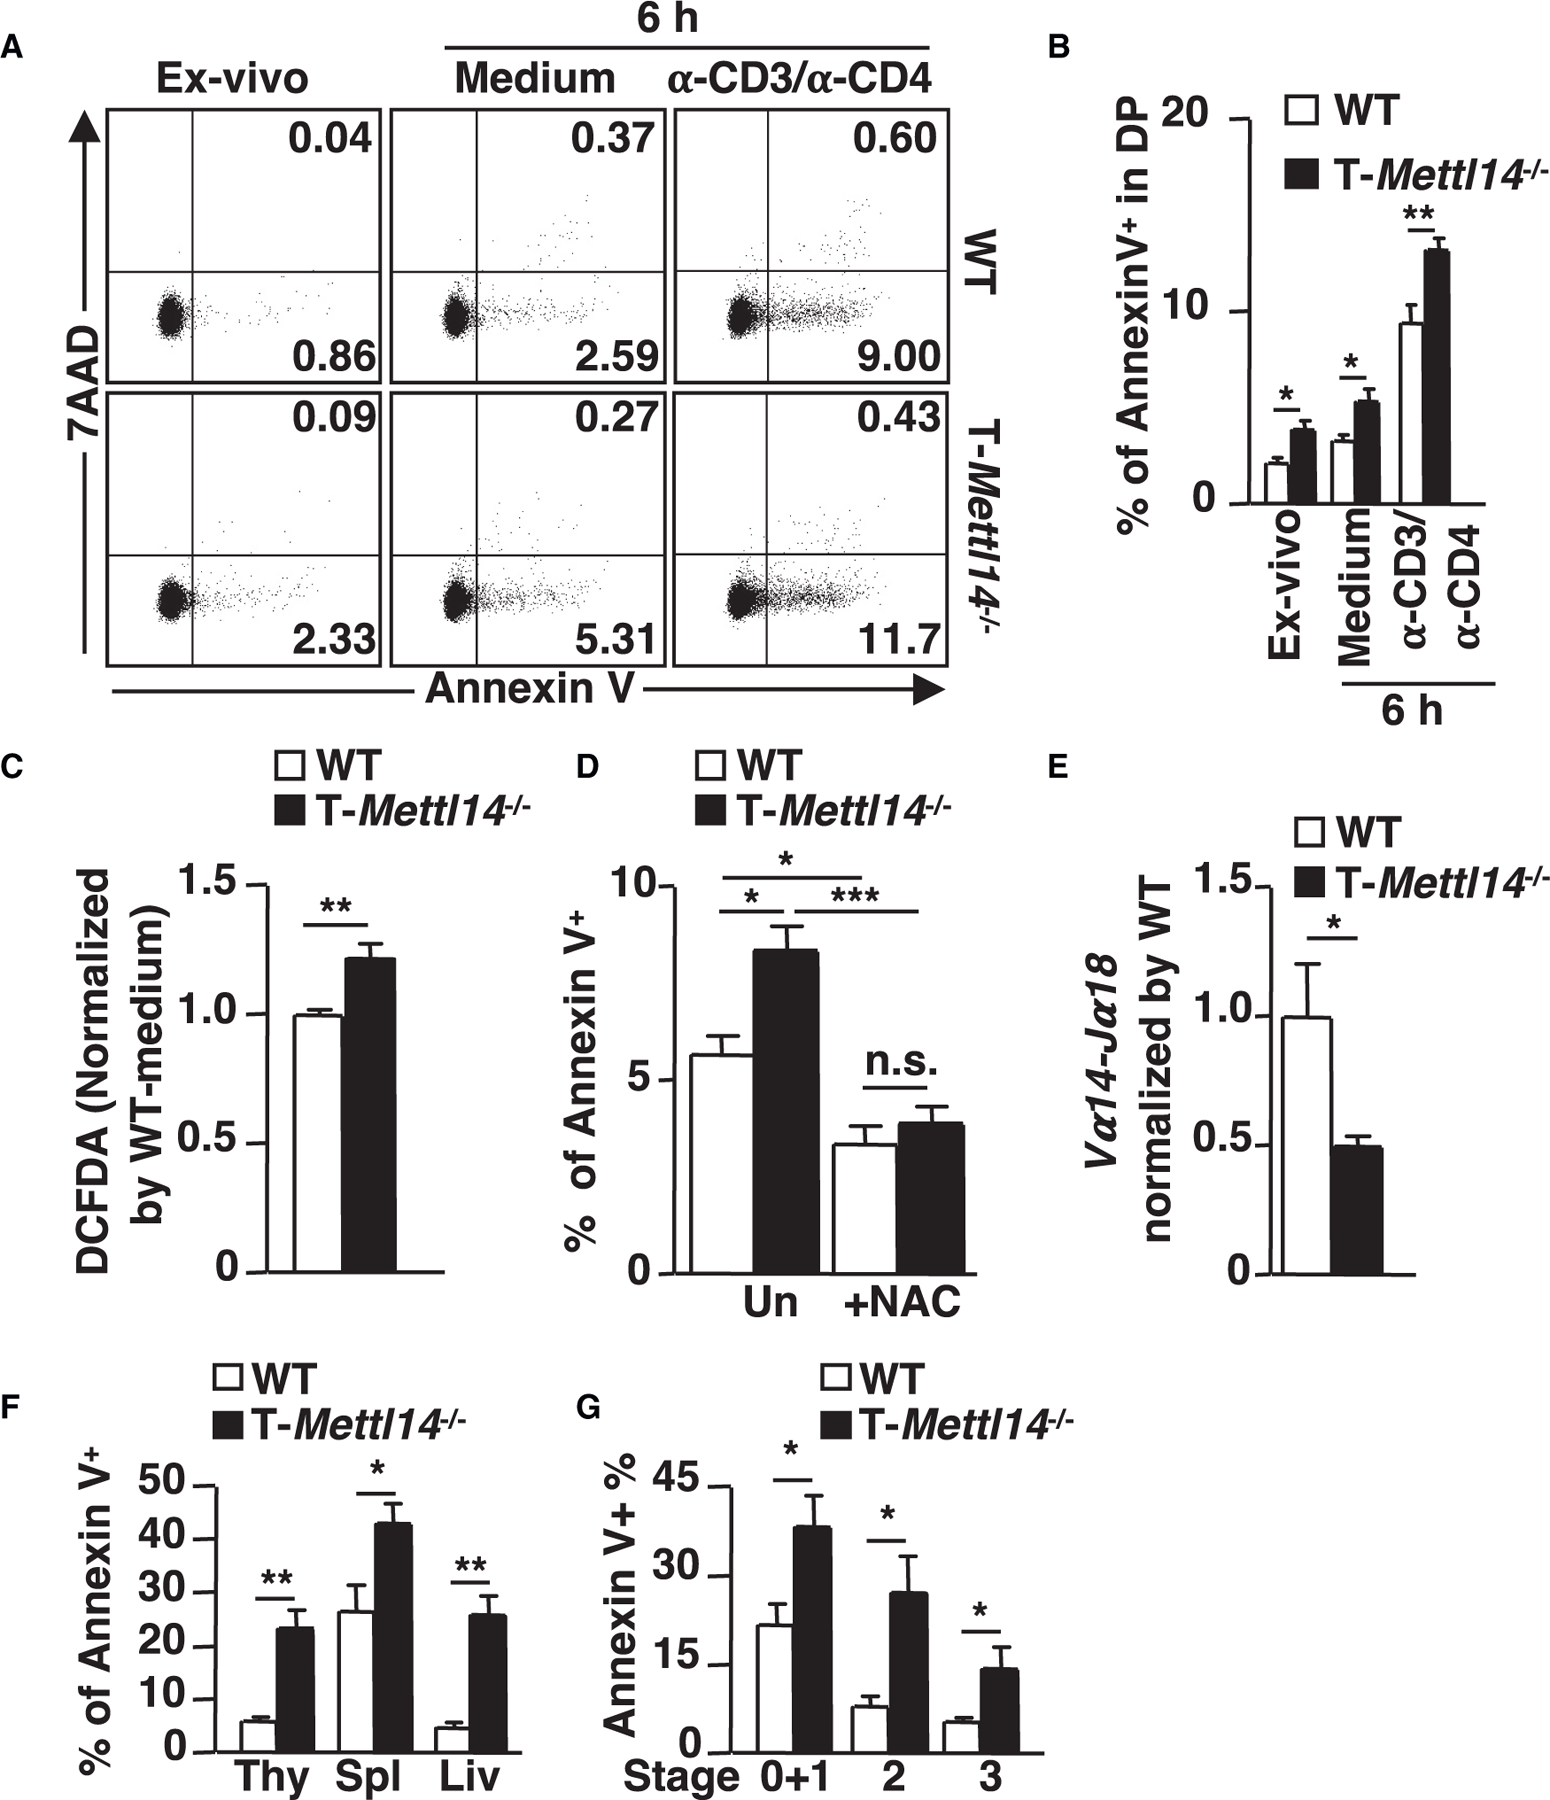
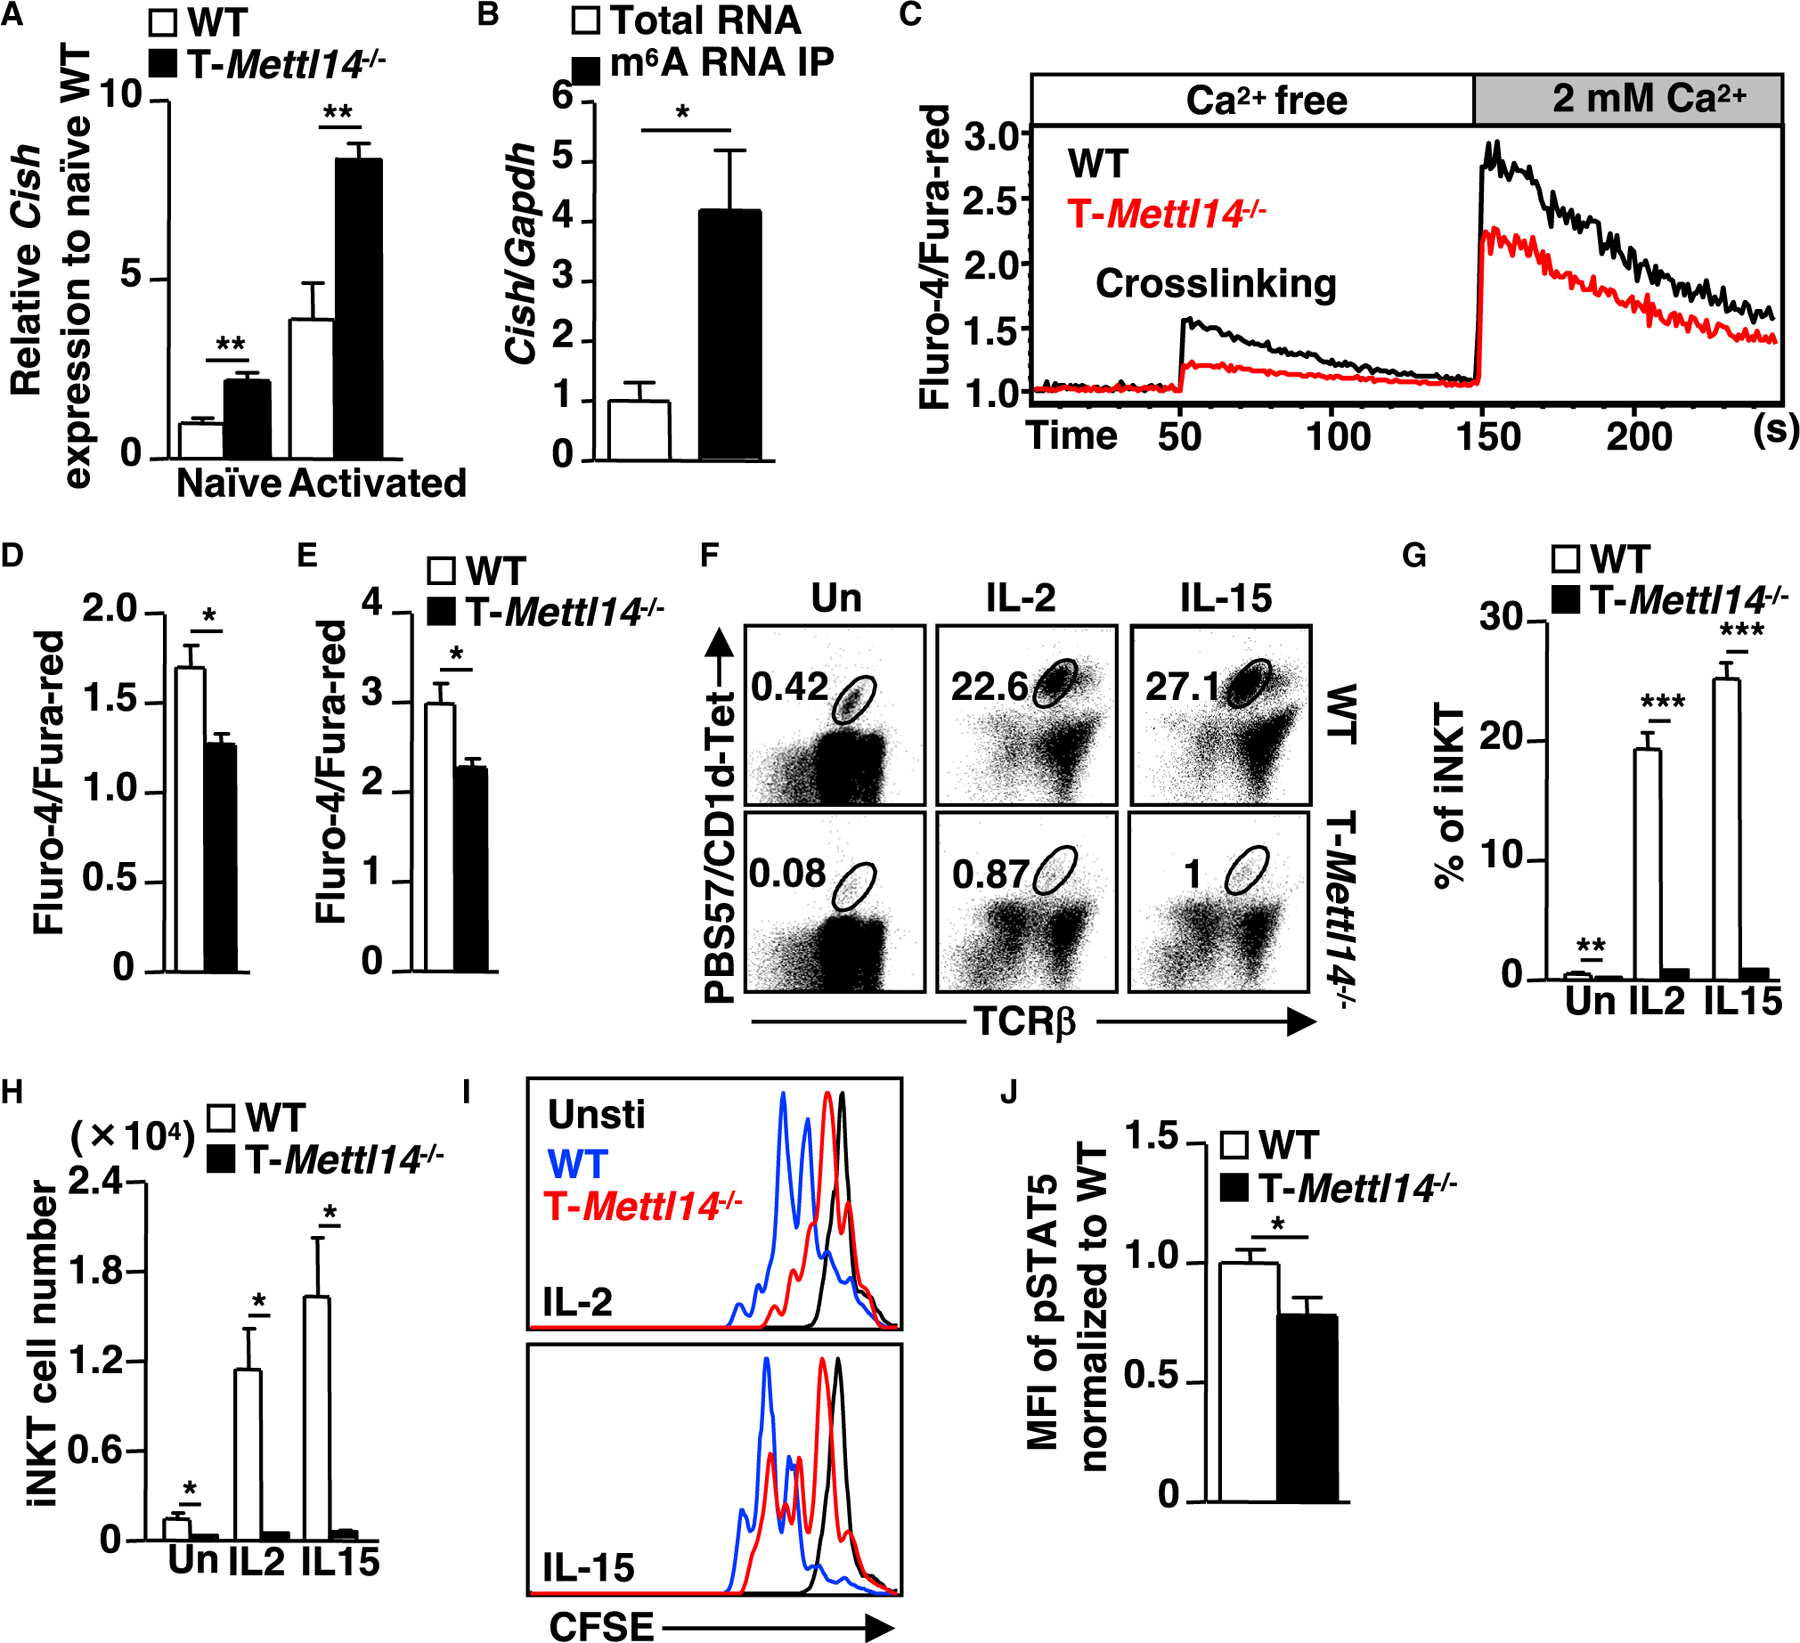
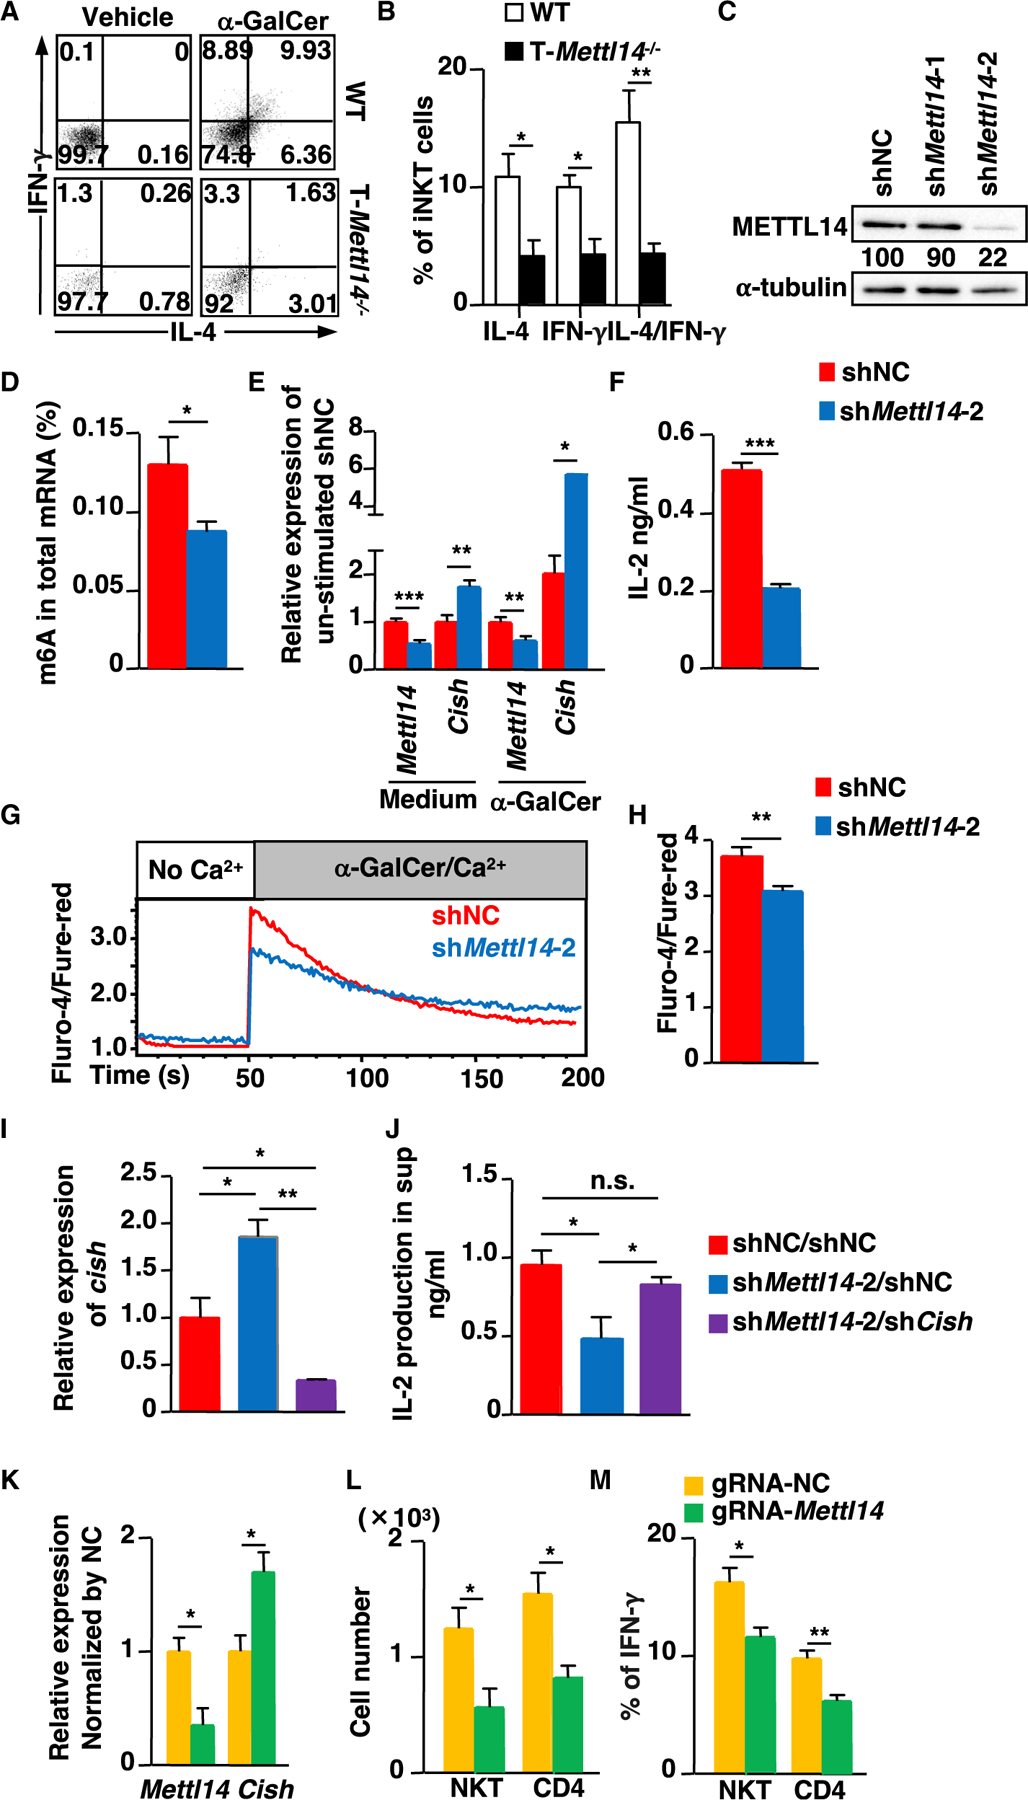
N6-methyladenosine (m6A), the most common form of RNA modification, controls CD4+ T cell homeostasis by targeting the IL-7/STAT5/SOCS signaling pathways. The role of m6A modification in unconventional T cell development remains unknown. Using mice with T cell-specific deletion of RNA methyltransferase METTL14 (T-Mettl14-/-), we demonstrate that m6A modification is indispensable for iNKT cell homeostasis. Loss of METTL14-dependent m6A modification leads to the upregulation of apoptosis in double-positive thymocytes, which in turn decreases Vα14-Jα18 gene rearrangements, resulting in drastic reduction of iNKT numbers in the thymus and periphery. Residual T-Mettl14-/- iNKT cells exhibit increased apoptosis, impaired maturation, and decreased responsiveness to IL-2/IL-15 and TCR stimulation. Furthermore, METTL14 knockdown in mature iNKT cells diminishes their cytokine production, correlating with increased Cish expression and decreased TCR signaling. Collectively, our study highlights a critical role for METTL14-dependent-m6A modification in iNKT cell development and function.

Keywords: CD1; CP: Immunology; CP: Molecular biology; NKT cells; T cell development; knockout mice; m(6)A.


Conflict of interest statement

Declaration of interests H.H. is an employee of Genentech.

Figures

Figure 1.
Figure 1.. iNKT cell development is severely impaired in T-Mettl14−/− mice
(A) m6A level in total mRNA of CD4+, CD8+ T cells, and iNKT cells (naive and activated) (n = 5–6). (B) Immunoblot of METTL14 and METTL3 in total thymocytes and TCRβ+ splenocytes in WT and T-Mettl14−/− mice. Data representative of three independent experiments. (C) Representative staining of lymphocytes in indicated organs from WT and T-Mettl14−/− mice with CD1d/PBS57 tetramer or unloaded CD1d tetramer. (D and E) Summary of frequencies and cell numbers of iNKT cells in the indicated organs from WT and T-Mettl14−/− mice (n = 5–8). SEM is shown. *p < 0.05, **p < 0.01, ***p < 0.001.
Figure 2.
Figure 2.. Defective development of iNKT cells in T-Mettl14−/− mice is cell intrinsic
(A) Representative histogram of CD1d expression on DP thymocytes. CD1d was stained with α-CD1d or isotype control antibody (n = 8). (B) IL-2 detected by ELISA following 48-h co-culture of iNKT cell hybridoma DN32.D3 with irradiated thymocytes pulsed with α-GalCer ranging from 200 ng/mL to 12.5 ng/mL. Data representative of three independent experiments. (C) Flow cytometric analysis of iNKT cells in the Jα18−/− recipient mice after 6 weeks of reconstitution with 1:1 mixture of bone marrow cells from WT (CD45.1) and T-Mettl14−/− (CD45.2). (D) Quantification of iNKT cell reconstitution in thymus, spleen, and liver in bone marrow chimera recipients (n = 7). SEM is shown. ***p < 0.001.
Figure 3.
Figure 3.. Mettl14 deficiency impairs the maturation of iNKT cells
(A) Representative staining of iNKT cells (CD69+CD1d/PBS57 tetramer+) at various developmental stages in the thymus of WT and T-Mettl14−/− mice. (B and C) Quantification of percentages and cell numbers of stages 0, 1, 2, and 3 iNKT cells in WT and T-Mettl14−/− mice (n = 3–4). (D) Intracellular staining of PLZF, T-bet, and RORγt in thymic iNKT cells of WT and T-Mettl14−/− mice. (E and F) Quantification of percentages and cell numbers of NKT1, NKT2+NKTpre, and NKT17 subsets (n = 6). SEM is shown. *p < 0.05, **p < 0.01, ***p < 0.001.
Figure 4.
Figure 4.. m6A maintains DP thymocyte survival in part through regulation of the p53-mediated apoptosis pathway
(A) RNA-seq results of DP thymocytes from WT and T-Mettl14−/− mice with indicated gene labeling (n = 3). Data shown are fold change of T-Mettl14−/−/WT. (B) Heatmap of differentially expressed protein-coding genes and long non-coding RNA. Gene set enrichment analysis showing enrichment for hallmark p53 pathway (C) and apoptosis pathway (D) in T-Mettl14−/− DP thymocytes. (E) Relative expression of Mettl14, Hmga1b, Trim25, and Xaf1 in DP thymocytes of T-Mettl14−/− mice detected by qPCR. (F) Relative expression of Hmga1b, Trim25, and Xaf1 in the m6A RNA immunoprecipitation versus total thymocyte RNA in WT mice detected by qPCR (n = 3–4). SEM is shown. *p < 0.05, **p < 0.01.
Figure 5.
Figure 5.. Elevated apoptosis in T-Mettl14−/− DP thymocytes is rescued by the scavenger of ROS
(A) Representative staining of apoptosis markers of naive and activated DP thymocytes. (B) Percentage of Annexin V+ cells in ex vivo, 6-h medium culture, or anti-CD3/anti-CD4-stimulated DP thymocytes from WT and T-Mettl14−/− mice (n = 5–6). (C) Intracellular ROS in DP thymocytes detected by DCFDA (n = 5). (D) Percentage of Annexin V+ population in DP thymocytes after 6-h incubation with or without NAC (n = 5). (E) Relative expression of Vα14-Jα18 in DP thymocytes of T-Mettl14−/− mice (n = 5). (F) Percentage of Annexin V+ population of iNKT cells in WT and T-Mettl14−/− mice from thymus, spleen, and liver (n = 7). (G) Percentage of Annexin V+ population of iNKT thymocytes at different developmental stages (n = 7). SEM is shown. *p < 0.05, **p < 0.01, ***p < 0.001.
Figure 6.
Figure 6.. Upregulation of m6A target gene Cish in Mettl14-deficient thymocytes correlates with decreased TCR signaling and impaired cytokine response
(A) Relative expression of Cish in naive and activated (anti-CD3/anti-CD4) DP thymocytes (n = 5–9). (B) Relative expression of Cish in the m6A RNA immunoprecipitation of total thymocytes RNA in WT mice by qPCR quantification (n = 4). (C) Intracellular calcium flux in DP thymocytes in response to crosslinking of anti-CD3/anti-CD4 in T-Mettl14−/− mice. (D and E) Quantification of maximum calcium flux on crosslinking and addition of Ca2+ in T-Mettl14−/− DP cells (n = 5–6). (F) Representative staining of thymic iNKT cell expansion at day 3 after stimulation with IL-2 or IL-15. (G and H) Percentage and cell number of thymic iNKT cells on D0 and D3 after stimulation with IL-2 or IL-15 (n = 5). (I) Representative figure of cell trace distribution in thymic iNKT cells on day 3 post-stimulation with IL-2 or IL-15 (n = 5–6). Unstimulated thymocytes were used as controls. (J) Bar graph of pSTAT5 in iNKT thymocytes after 20 min of IL-15 stimulation (n = 5). SEM is shown. *p < 0.05, **p < 0.01, ***p < 0.001.
Figure 7.
Figure 7.. Mettl14-deficiency impairs mature iNKT cell function
(A) Dot plots of IFN-γ and IL-4 in residual iNKT cells from T-Mettl14−/− mice after in vivo α-GalCer stimulation. (B) Quantification of the percentage of IFN-γ and IL-4 producing iNKT cells in α-GalCer-immunized WT and T-Mettl14−/− mice (n = 4). (C) Expression of METTL14 in DN32.D3 cells transduced with lentivirus coding Mettl14-specific shRNA (shMettl14-1 or shMettl14-2) or control shRNA (shNC). (D) m6A level in mRNA of DN32.D3 cells transduced with shMettl14-2 and shNC. (E) Relative expression of Mettl14 and Cish in DN32.D3-shMettl14-2 in medium or stimulation with α-GalCer for 24 h. (F) Production of IL-2 in DN32.D3-shMettl14-2 after stimulation with α-GalCer for 24 h quantified by ELISA. (G) Intracellular calcium flux in DN32.D3-shMettl14-2 cells in response to α-GalCer/Ca2+. (H) Quantification of maximum calcium flux upon α-GalCer stimulation. Data representative of three to six independent experiments. shNC or shMettl14-2-treated DN32.D3 were spin-transduced with retrovirus carrying shCish or shNC. Zsgreen+ cells were sorted and cultured. (I) Relative expression of Cish in the indicated groups. (J) IL-2 production in shNC/shNC-treated (‘‘WT’’ control) and shNC and shCish-treated Mettl14KD DN32.D3 cells after stimulation with α-GalCer for 24 h. Vα14Tg splenocytes were nucleofected with rCas9/gRNA complex and maintained in complete RPMI supplemented with IL-2 for 3 days. (K) Mettl14 and Cish expression by qPCR on day 3 after nucleofection. (L) Absolute cell numbers of iNKT and CD4+ T cells after nucleofection. (M) IFN-γ production in iNKT and CD4+ T cells after nucleofection (n = 3–4). SEM is shown. *p < 0.05, **p < 0.01, ***p < 0.001.

Similar articles

Cited by

References

    1. Alarcón CR, Lee H, Goodarzi H, Halberg N, and Tavazoie SF (2015). N6-methyladenosine marks primary microRNAs for processing. Nature 519, 482–485. 10.1038/nature14281. - DOI - PMC - PubMed
    1. Aman MJ, Migone TS, Sasaki A, Ascherman DP, Zhu MH, Soldaini E, Imada K, Miyajima A, Yoshimura A, and Leonard WJ (1999). CIS associates with the interleukin-2 receptor beta chain and inhibits interleukin-2-dependent signaling. J. Biol. Chem 274, 30266–30272. 10.1074/jbc.274.42.30266. - DOI - PubMed
    1. Anders S, Pyl PT, and Huber W (2015). HTSeq–a Python framework to work with high-throughput sequencing data. Bioinformatics 31, 166–169. 10.1093/bioinformatics/btu638. - DOI - PMC - PubMed
    1. Baldwin TA, Hogquist KA, and Jameson SC (2004). The fourth way? Harnessing aggressive tendencies in the thymus. J. Immunol 173, 6515–6520. 10.4049/jimmunol.173.11.6515. - DOI - PubMed
    1. Baranek T, Lebrigand K, de Amat Herbozo C, Gonzalez L, Bogard G, Dietrich C, Magnone V, Boisseau C, Jouan Y, Trottein F, et al. (2020). High dimensional single-cell analysis reveals iNKT cell developmental trajectories and effector fate decision. Cell Rep 32, 108116. 10.1016/j.celrep.2020.108116. - DOI - PubMed

Publication types