. 2022 Aug 2;40(5):111147.
doi: 10.1016/j.celrep.2022.111147.

AP-1 transcription factor network explains diverse patterns of cellular plasticity in melanoma cells

Affiliations

AP-1 transcription factor network explains diverse patterns of cellular plasticity in melanoma cells

Natacha Comandante-Lou et al. Cell Rep. .

Abstract

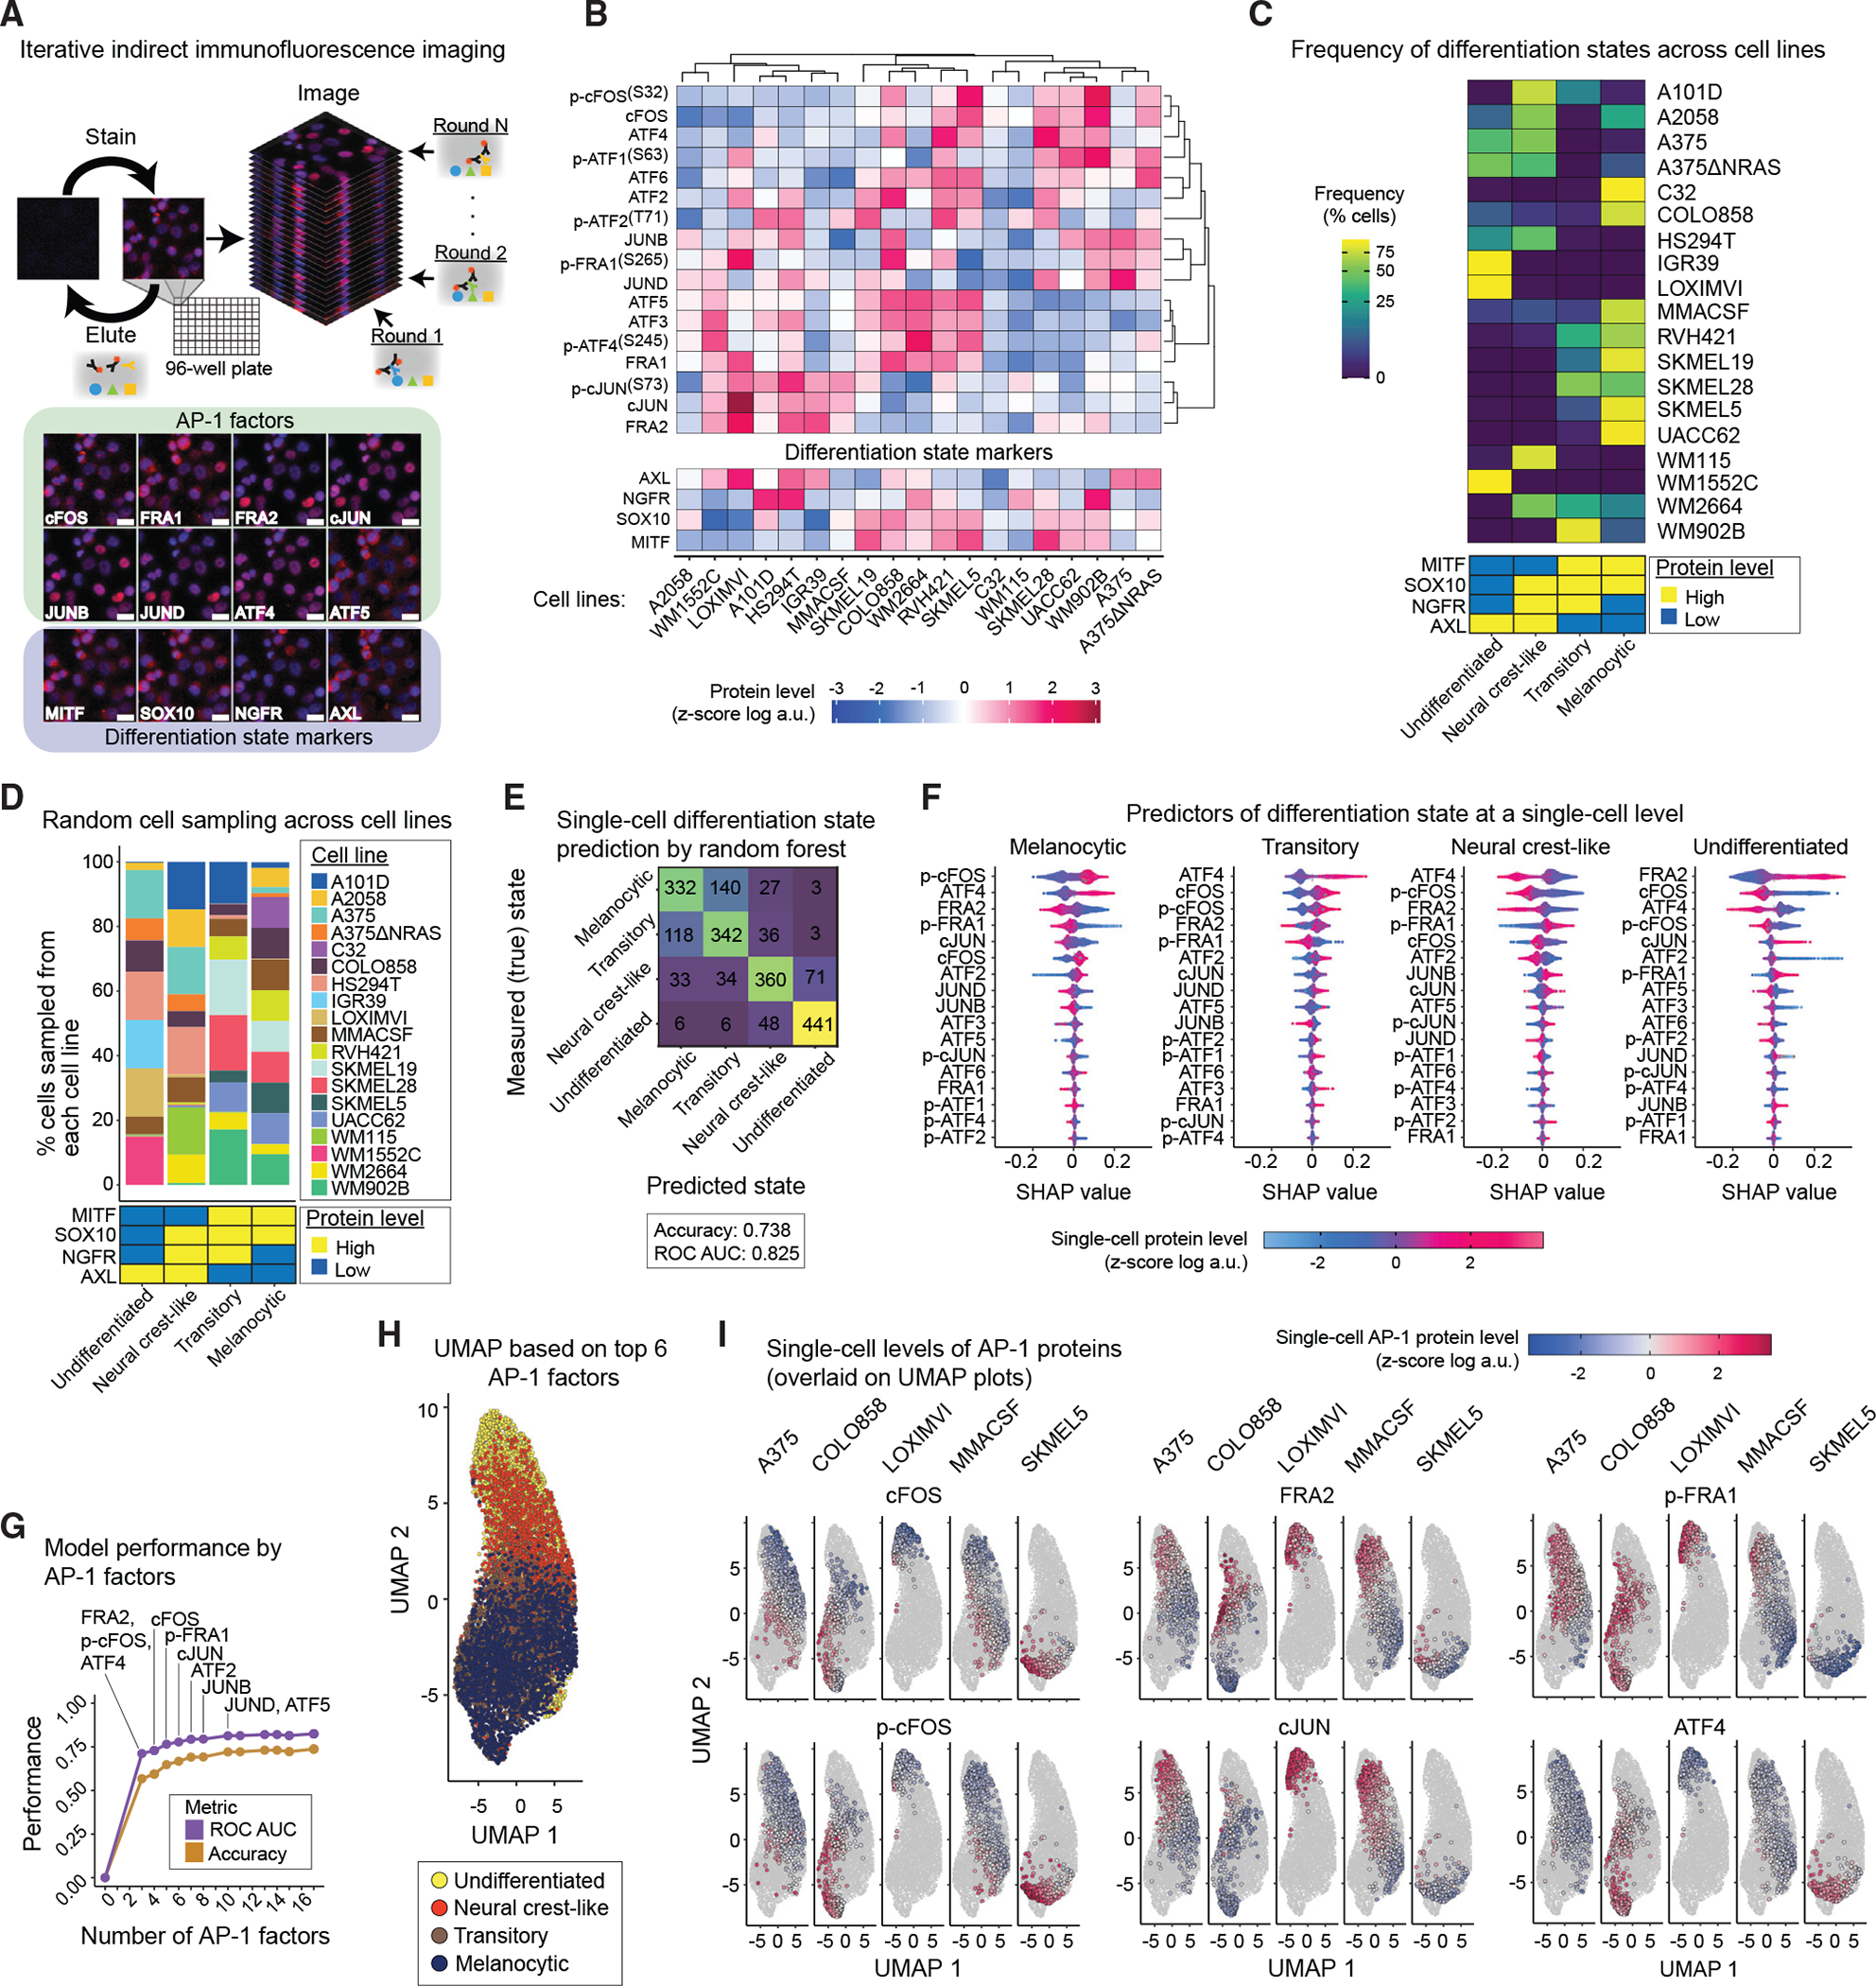
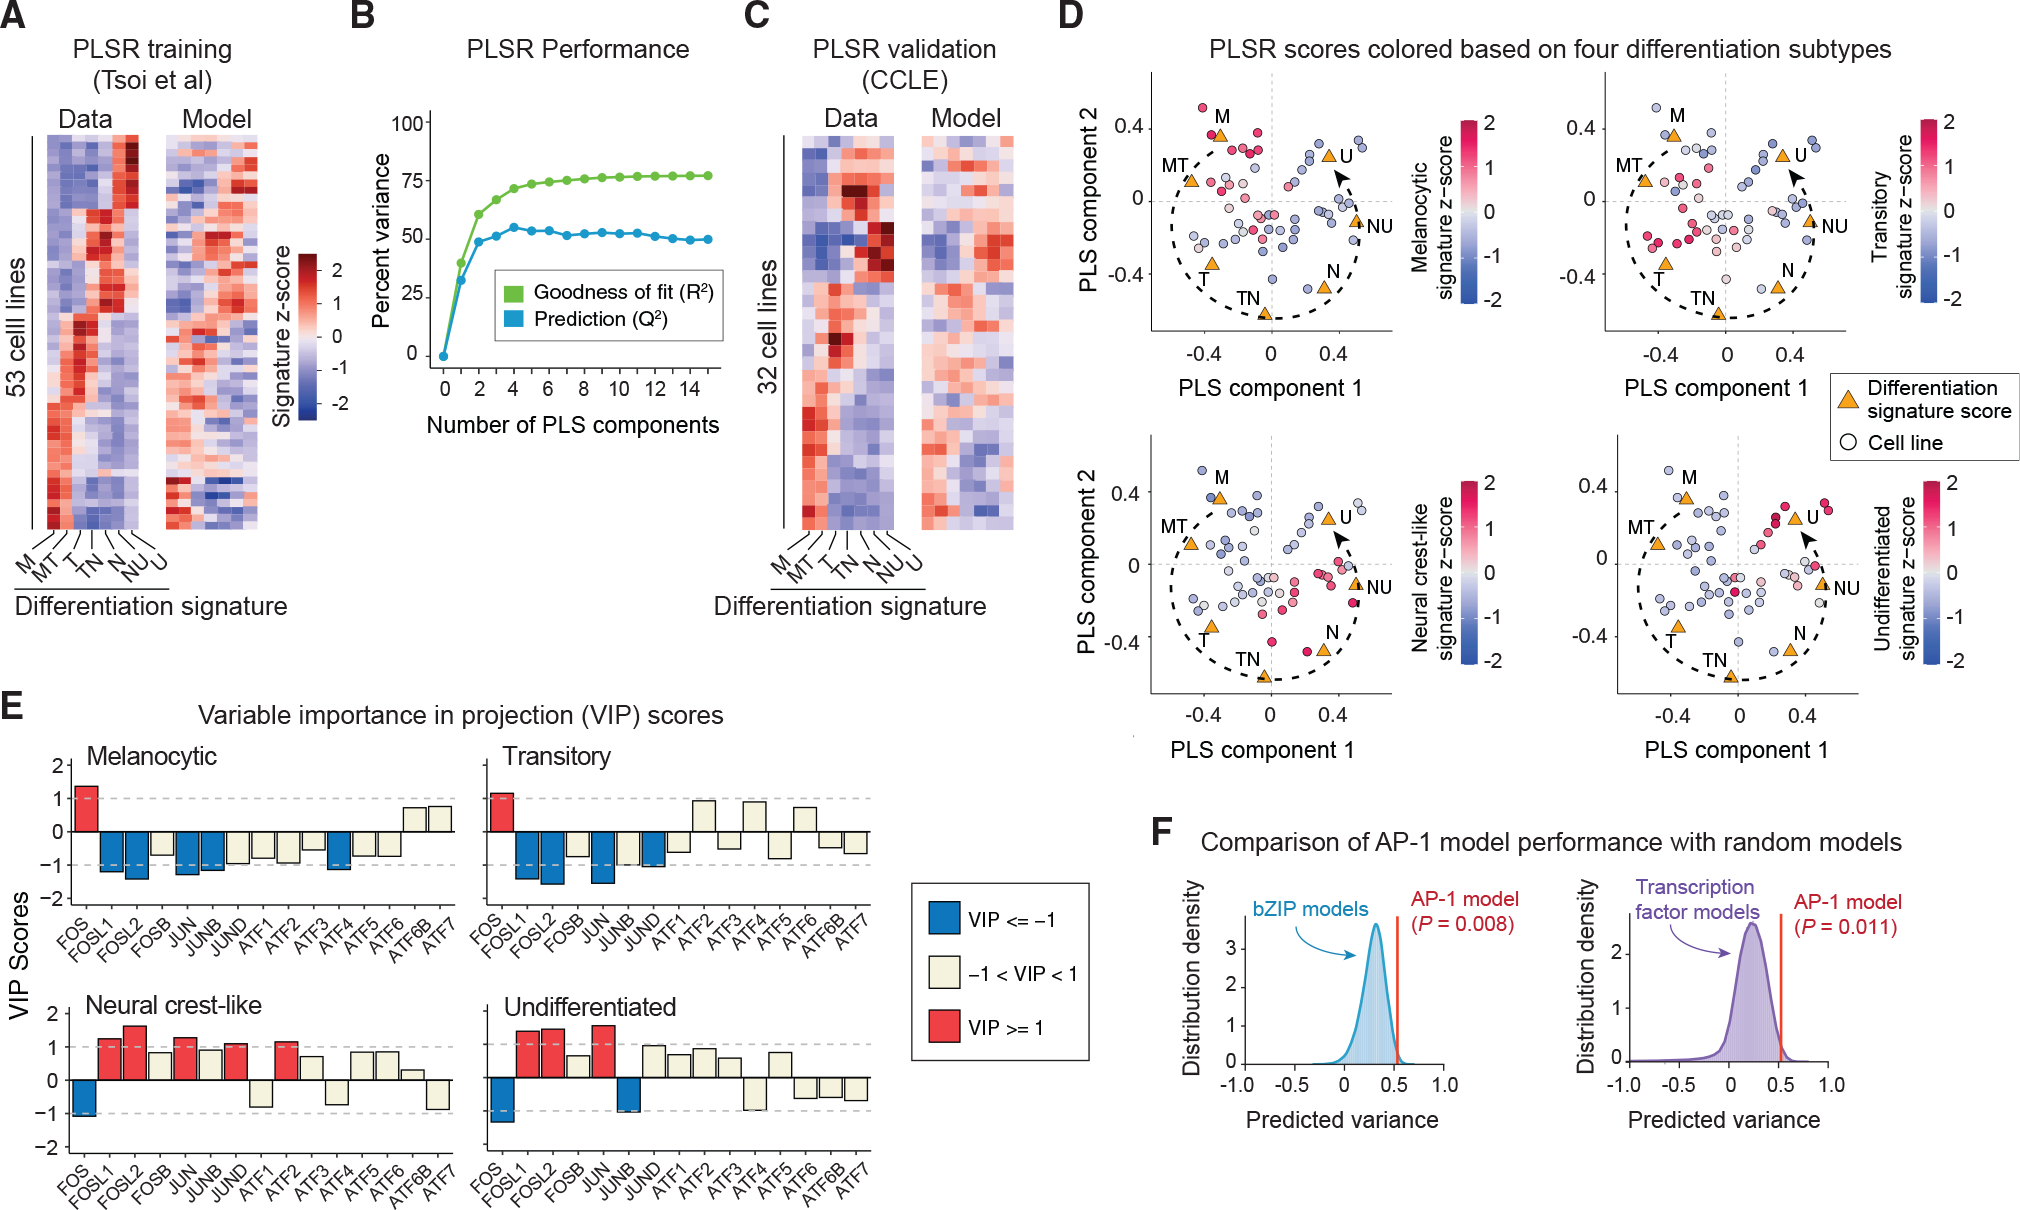
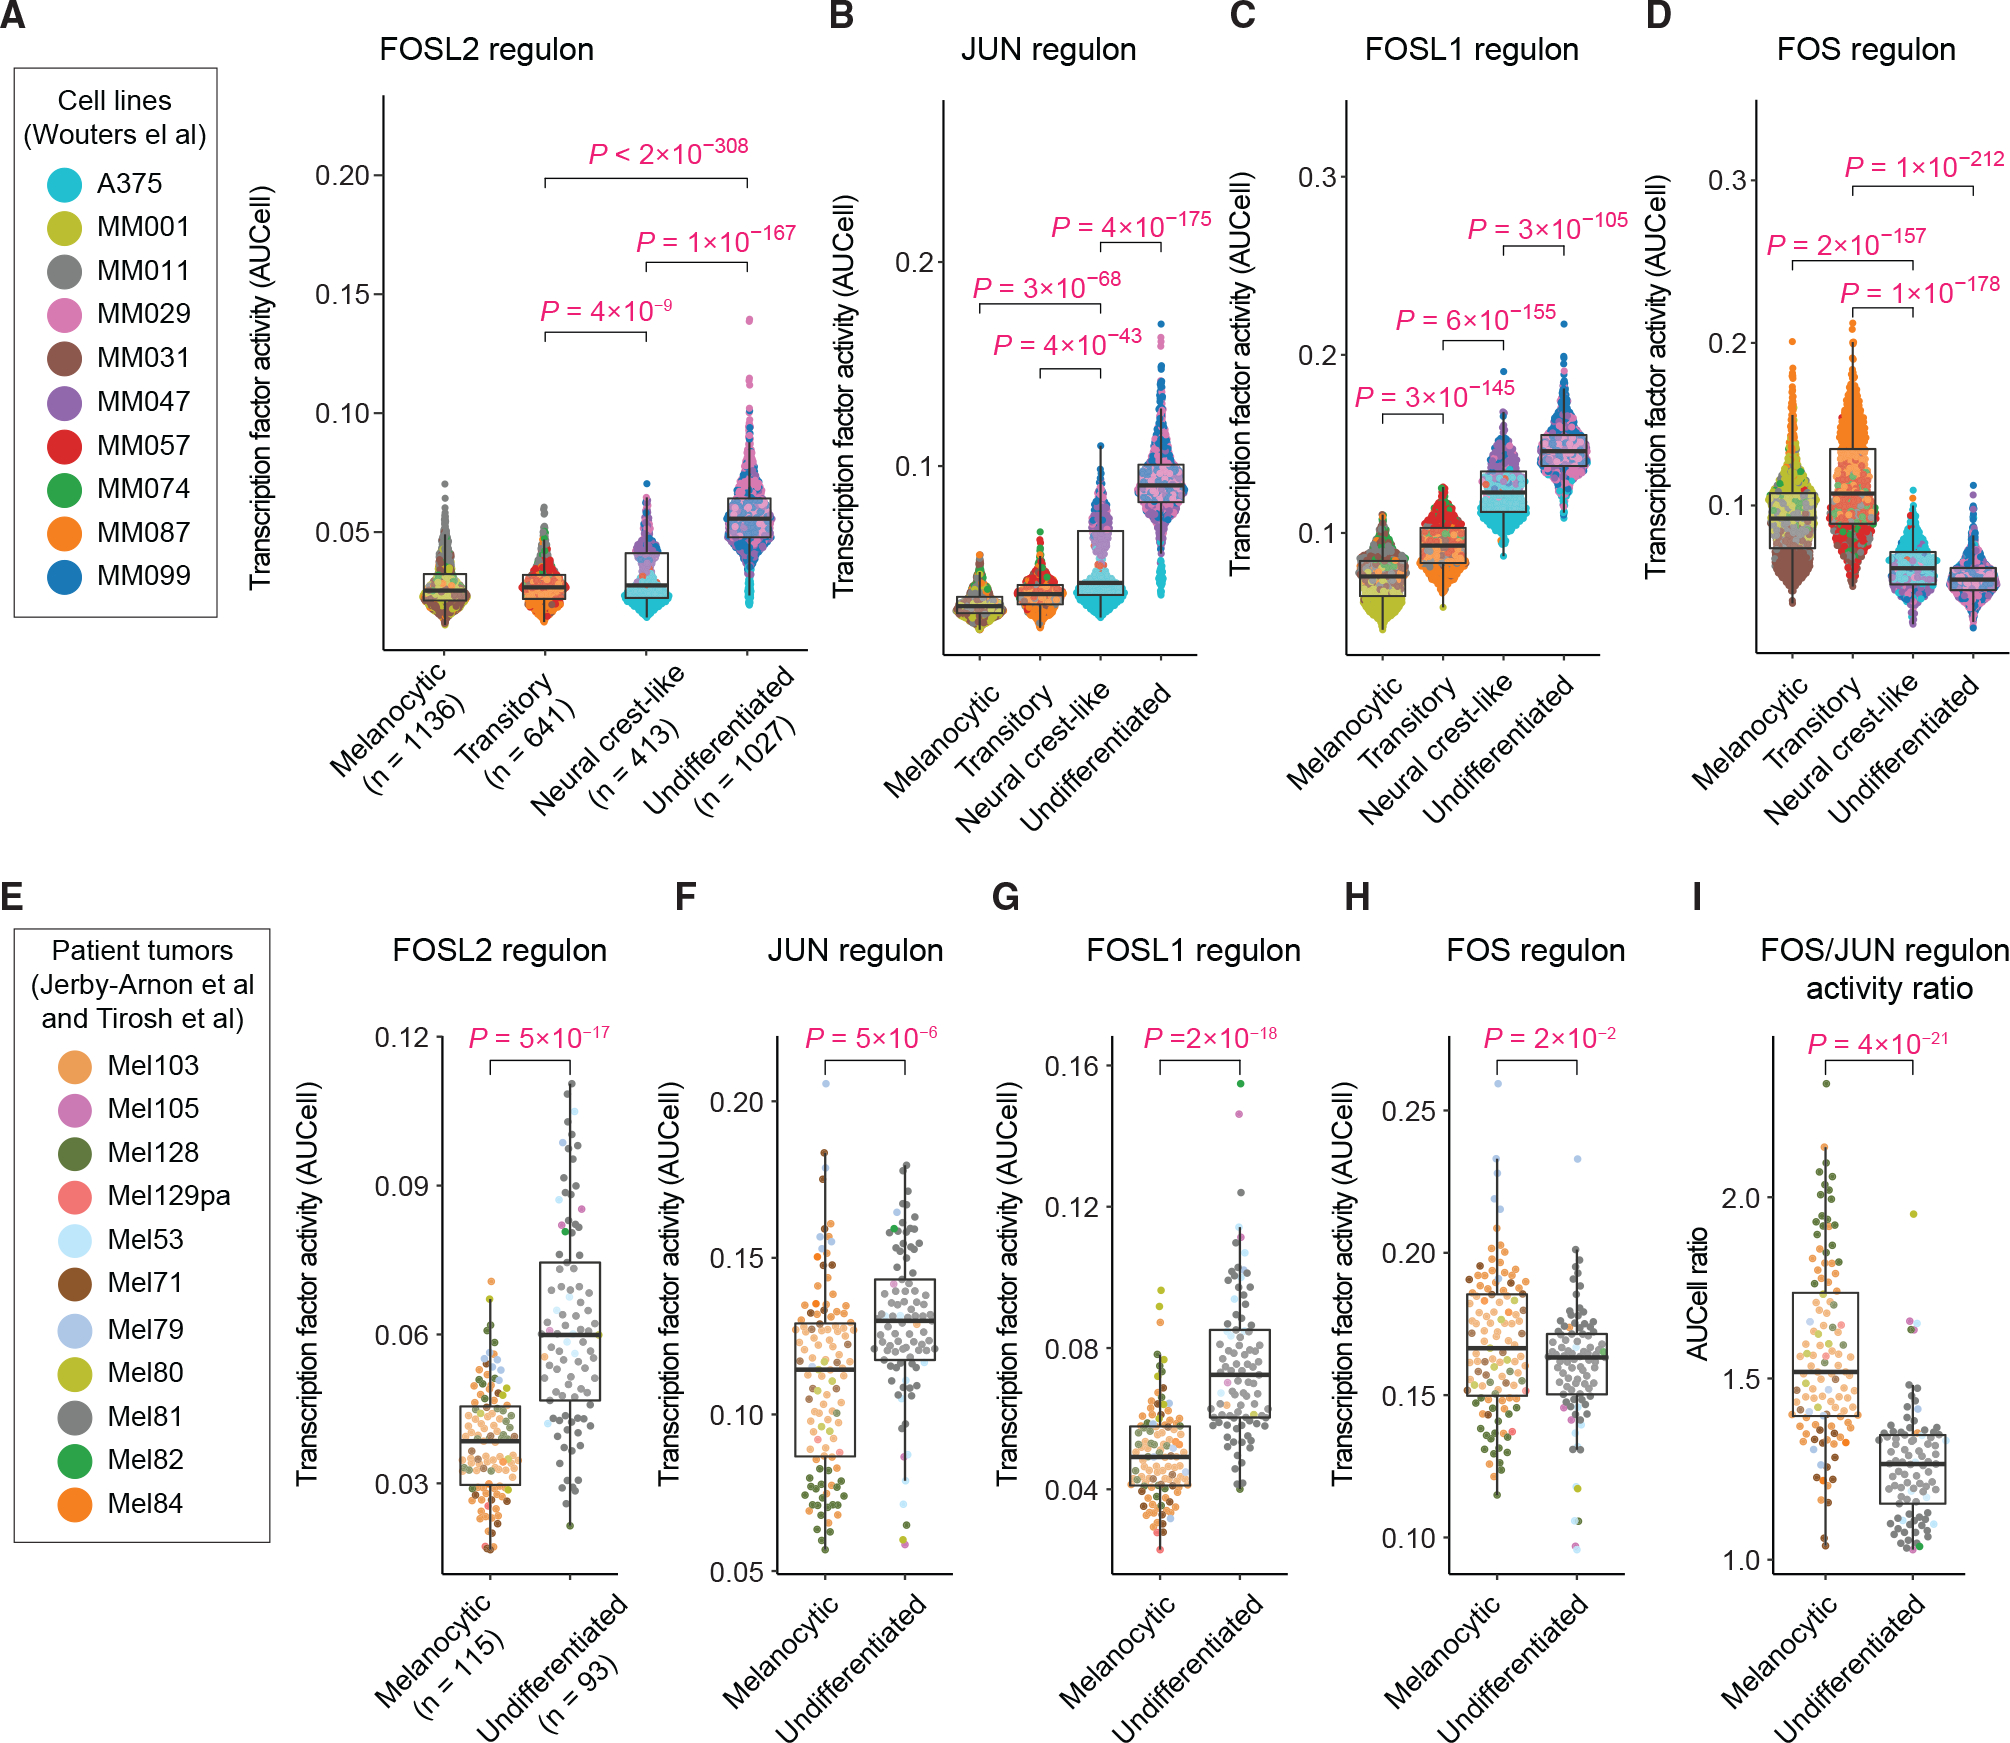
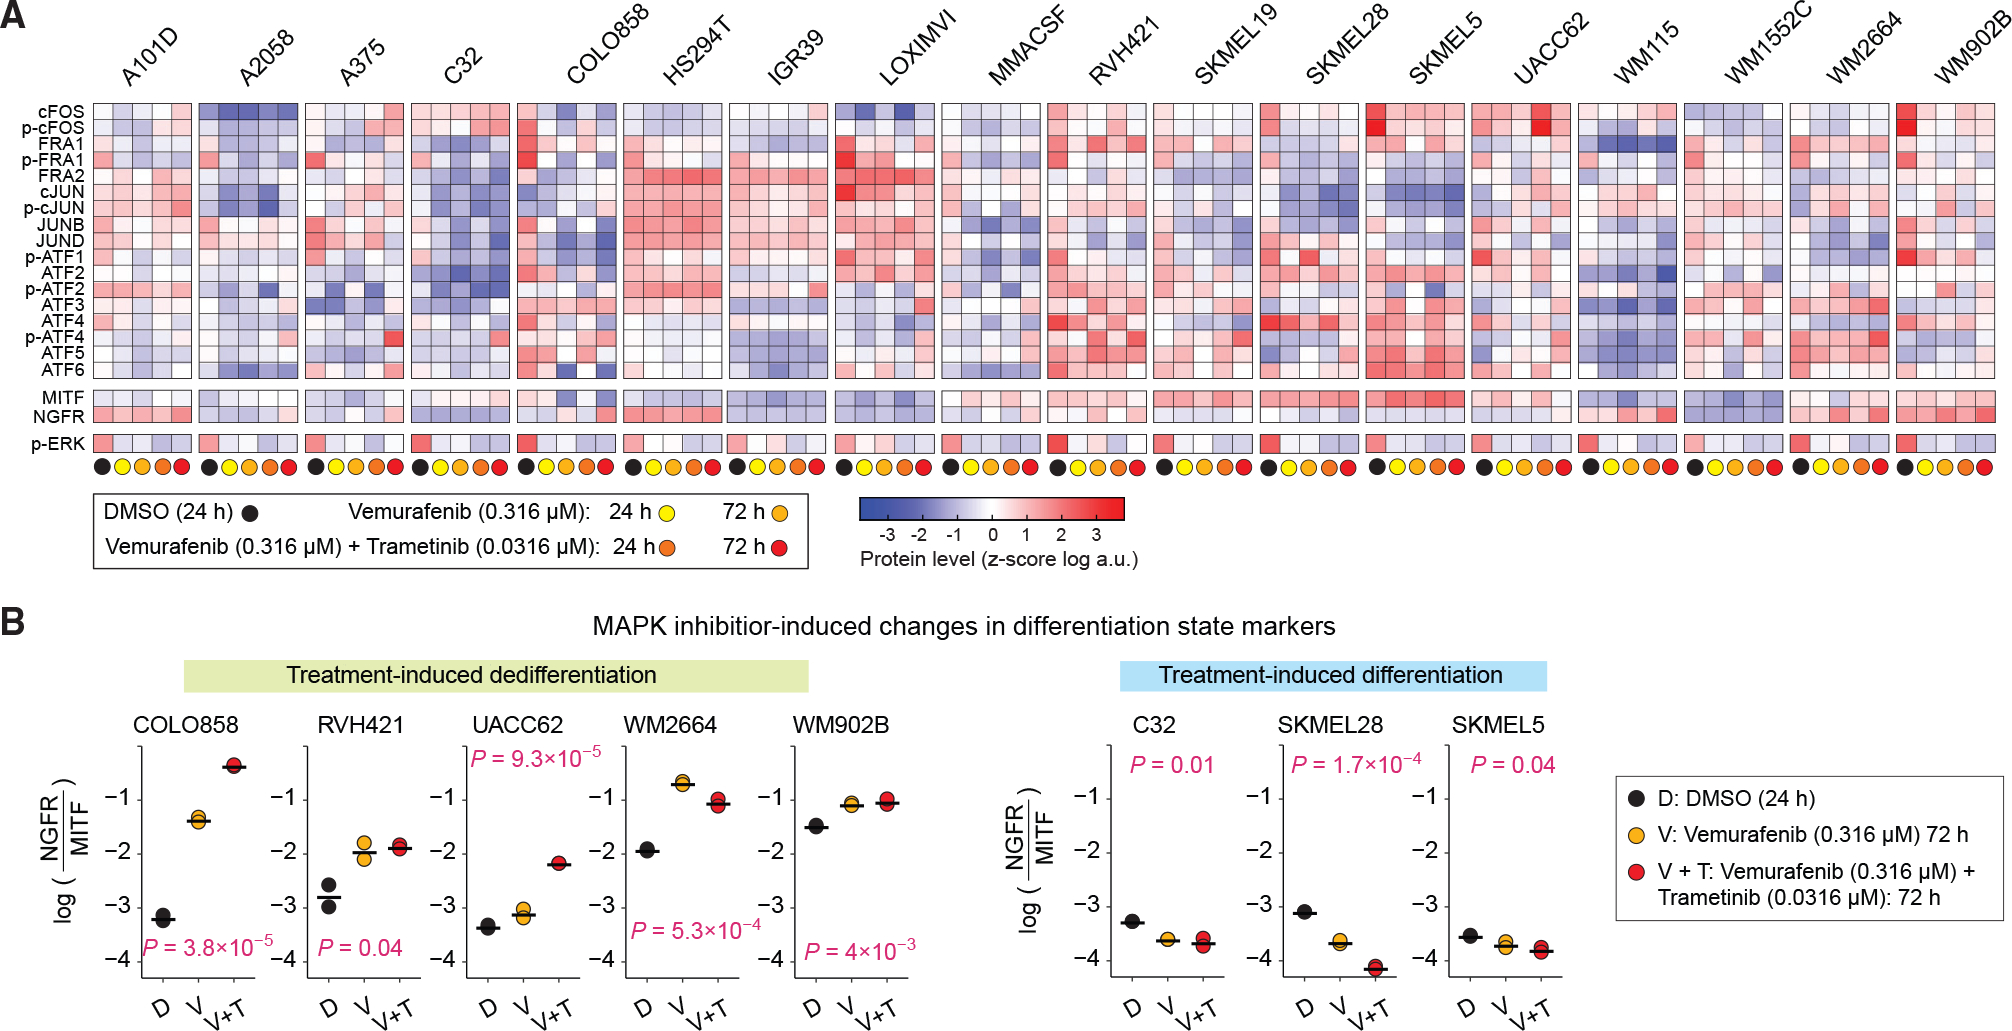
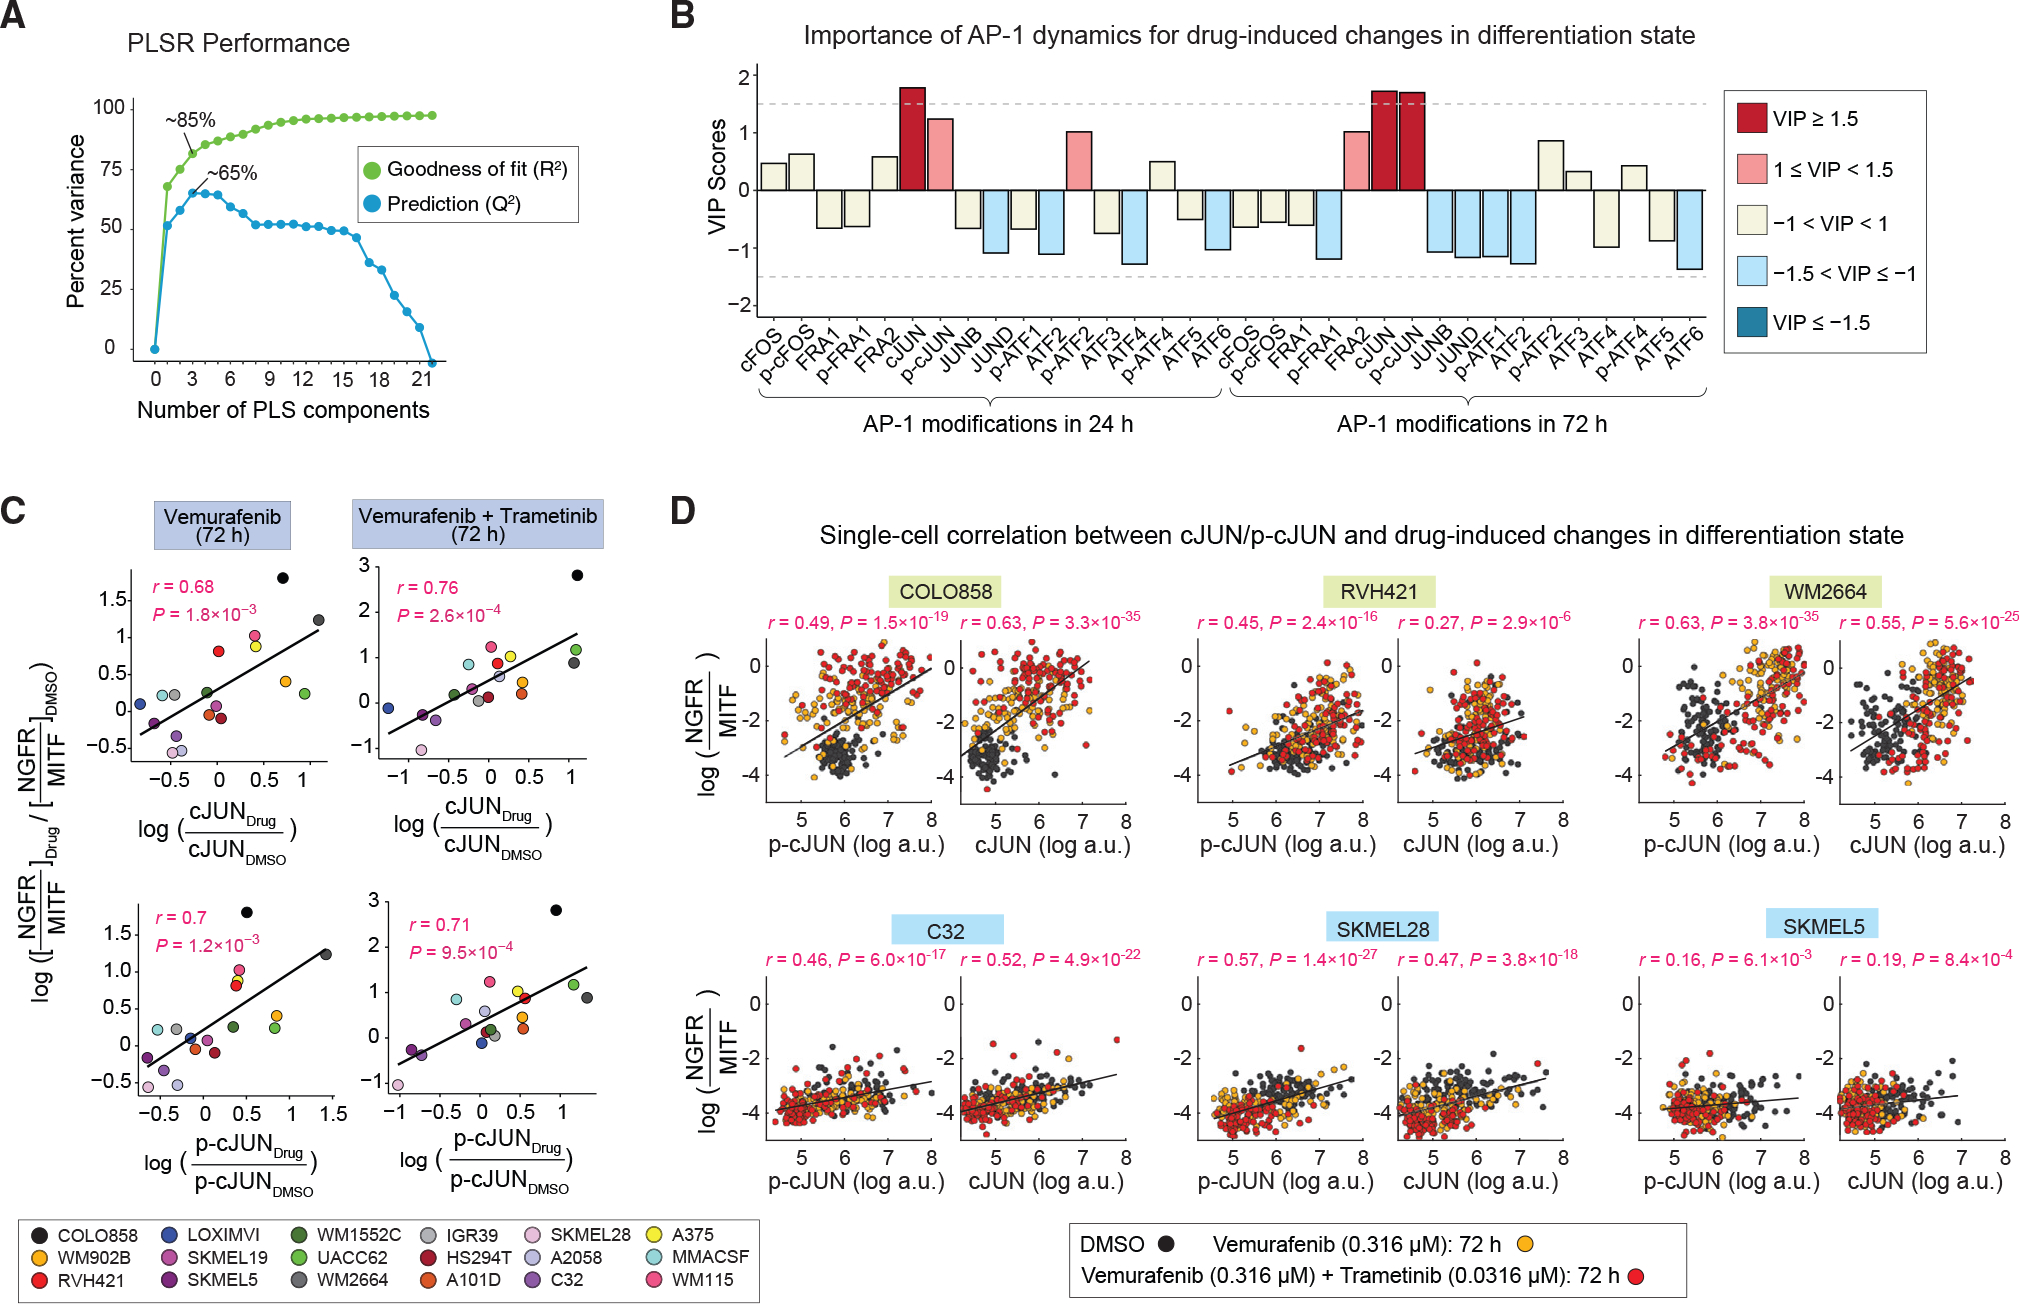
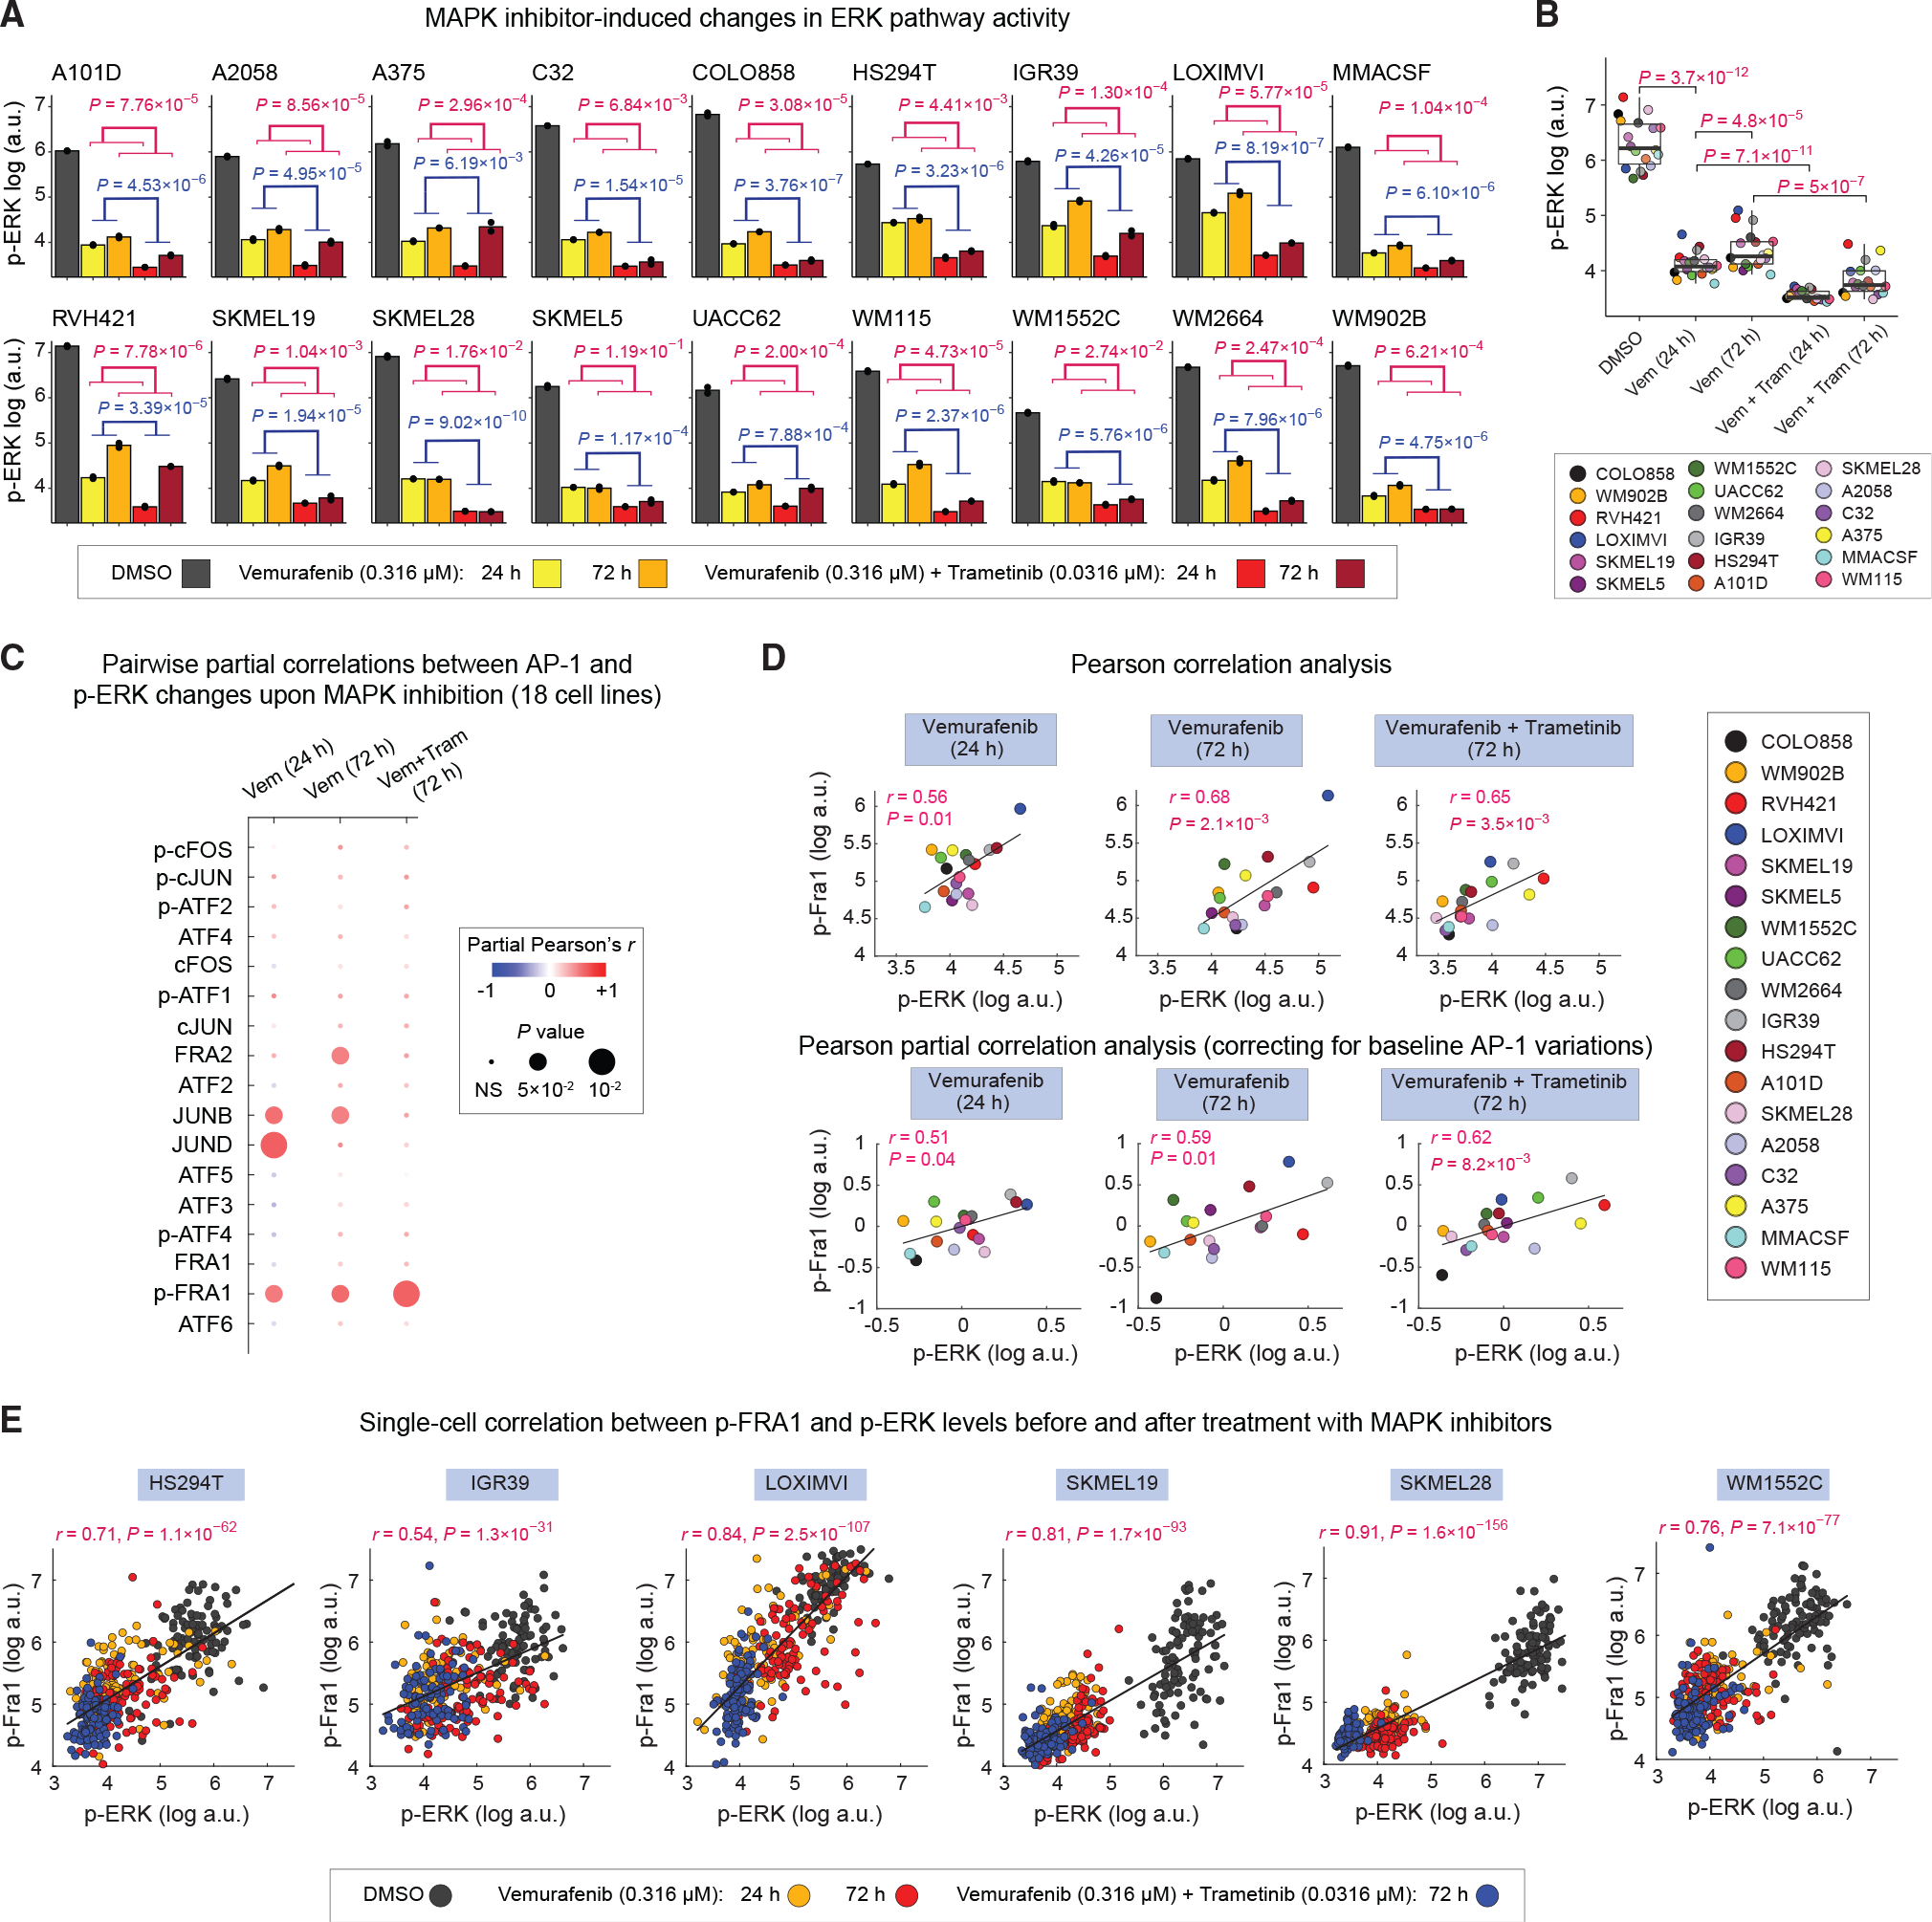
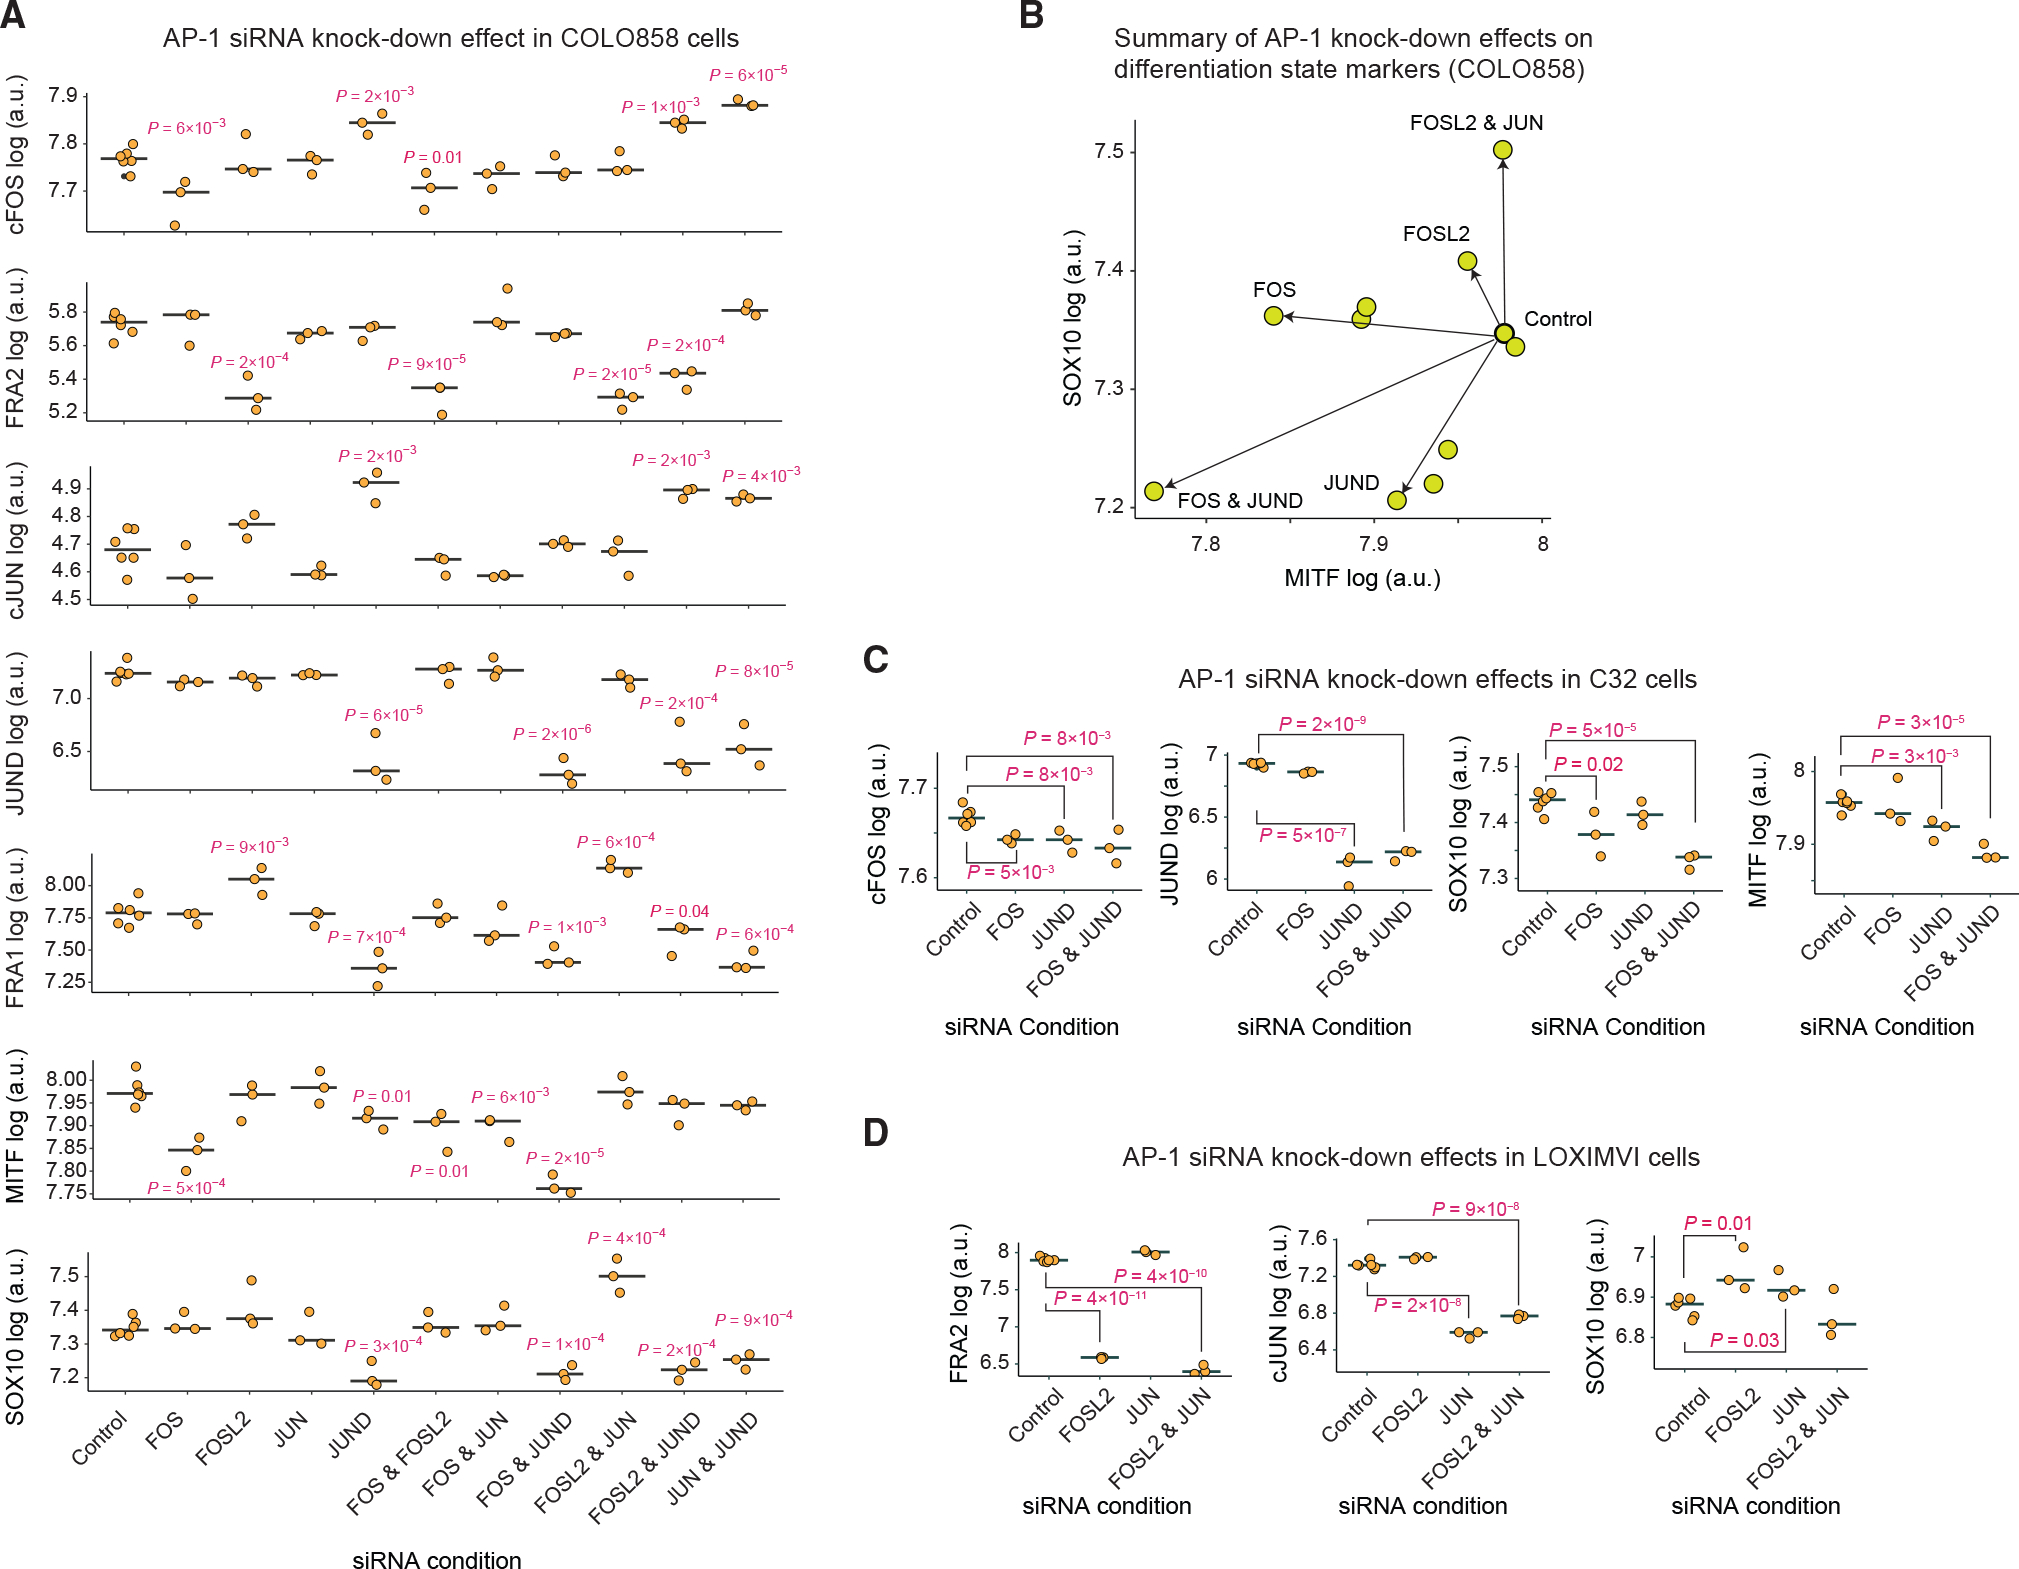
Cellular plasticity associated with fluctuations in transcriptional programs allows individual cells in a tumor to adopt heterogeneous differentiation states and switch phenotype during their adaptive responses to therapies. Despite increasing knowledge of such transcriptional programs, the molecular basis of cellular plasticity remains poorly understood. Here, we combine multiplexed transcriptional and protein measurements at population and single-cell levels with multivariate statistical modeling to show that the state of AP-1 transcription factor network plays a unifying role in explaining diverse patterns of plasticity in melanoma. We find that a regulated balance among AP-1 factors cJUN, JUND, FRA2, FRA1, and cFOS determines the intrinsic diversity of differentiation states and adaptive responses to MAPK inhibitors in melanoma cells. Perturbing this balance through genetic depletion of specific AP-1 proteins, or by MAPK inhibitors, shifts cellular heterogeneity in a predictable fashion. Thus, AP-1 may serve as a critical node for manipulating cellular plasticity with potential therapeutic implications.

Keywords: AP-1 transcription factors; BRAF-mutant melanoma; CP: Cancer; CP: Molecular biology; MAPK signaling pathway; adaptive drug resistance; cellular plasticity; computational modeling; differentiation state heterogeneity; single-cell analysis; statistical learning; targeted therapies.


Conflict of interest statement

Declaration of interests The authors declare no competing interests.

Figures

Figure 1.
Figure 1.. Single-cell AP-1 protein levels predict differentiation state heterogeneity in melanoma cells
(A) Schematic representation of the iterative indirect immunofluorescence imaging (4i) procedure used in this study to generate multiplexed single-cell data on 17 AP-1 proteins and 4 differentiation state markers. Representative images of selected AP-1 transcription factors and differentiation state markers are shown for LOXIMVI cells. Scale bars represent 20 μm. Hoechst staining of nuclei is shown in blue, while staining of the indicated protein is shown in red. (B) Population-averaged measurements of 17 AP-1 proteins and 4 differentiation state markers acquired across 19 BRAF-mutant melanoma cell lines. Protein data shown for each condition represent the log-transformed mean values for two replicates, followed by Z scoring across all cell lines. Data are organized only on the basis of hierarchical clustering of AP-1 protein measurements with Pearson correlation distance metric and the average algorithm for computing distances between clusters. (C) Natural frequency of cells in each differentiation state (defined on the basis of MITF, SOX10, NGFR, and AXL levels) across 19 BRAF-mutant melanoma cell lines. (D) The percentage of cells sampled from each of the 19 cell lines and their corresponding differentiation states used in the random forest model. (E) Confusion matrix showing the independent validation performance of the random forest classifier in predicting the differentiation state of cells on the basis of single-cell AP-1 measurements. The model was trained using a group of 8,000 cells and validated using an independent group of 2,000 cells. The prediction accuracy and area under the receiver operating characteristic curve (ROC AUC) are shown as an overall measure of the classifier performance. (F) Distributions of shapley additive explanations (SHAP) scores for each AP-1 factor across individual cells from the independent validation set. The color indicates the Z score-scaled, log-transformed level of each AP-1 protein at a single-cell level. For each differentiation state, AP-1 factors are ordered on the basis of the mean absolute values of their SHAP scores. (G) Classification performance of the random forest model on the basis of varying numbers of top AP-1 factors (on the basis of their SHAP values) used as pre-dictors. (H) UMAP analysis of the sampled melanoma cells (as shown in D) on the basis of their multiplexed levels of top 6 predictive AP-1 measurements (FRA2, p-cFOS, ATF4, cFOS, p-FRA1, and cJUN). Cells are colored on the basis of their differentiation states. (I) Single-cell levels of the top six AP-1 proteins overlaid on UMAP plots for representative cell lines.
Figure 2.
Figure 2.. AP-1 transcript levels predict variations in differentiation state across melanoma lines
(A) Comparison between differentiation signature scores computed on the basis of RNA sequencing data for 53 cell lines reported by Tsoi et al. (left) and PLSR-predicted scores (following leave-one-out cross-validation) for each cell line on the basis of their transcript levels of 15 AP-1 genes (right). M, melanocytic; MT, melanocytic-transitory; T, transitory; TN, transitory-neural crest-like; N, neural crest-like; NU, neural crest-like-undifferentiated; U, undifferentiated. (B) Performance of the PLSR model evaluated by computing the fraction of variance in differentiation signature scores explained (R2) or predicted on the basis of leave-one-out cross validation (Q2) with increasing number of PLS components. (C) Comparison between differentiation signature scores computed on the basis of RNA sequencing data of 32 CCLE cell lines (left) and predicted scores on the basis of the PLSR model built for the original set of 53 cell lines (right). (D) PLSR scores (of the first two PLS components) for each cell line colored according to their differentiation signature scores for melanocytic, transitory, neural crest-like, and undifferentiated states. (E) PLSR-derived variable importance in projection (VIP) scores, highlighting combinations of AP-1 transcripts that are predictive of differentiation signature scores for melanocytic, transitory, neural crest-like, and undifferentiated states. The sign of the VIP score shows whether the indicated variable (AP-1 transcript level) positively or negatively contributes to a given differentiation signature. Significant VIP scores (of greater than 1 or smaller than −1) are highlighted. (F) Comparison of performance (with respect to differentiation state prediction) between the PLSR model based on transcript levels of the top 8 AP-1 transcription factors with models based on transcript levels of combinations of 8 randomly chosen bZIP family transcription factors (n = 1 × 10⁵ iterations; left panel) or built on the basis of 8 randomly chosen transcription factors (n = 5 × 10⁵ iterations; right panel). Empirical p values were reported for the comparison of predicted variances on the basis of ten-fold cross-validation.
Figure 3.
Figure 3.. Single-cell network inference reveals the role of AP-1 activity in regulation of differentiation state programs
(A–D) Single-cell distributions of the activity of SCENIC regulons for FOSL2 (A), JUN (B), FOSL1 (C), and FOS (D) motifs, measured using AUCell in individual cells (from 10 melanoma cell lines profiled by Wouters et al.) across distinct differentiation states. The differentiation state of individual cells was determined on the basis of their gated levels of enrichment (quantified by AUCell) for the differentiation gene signatures as defined by Tsoi et al. (E–I) Single-cell distributions of the AUCell activity of SCENIC regulons for FOSL2 (E), JUN (F), FOSL1 (G), and FOS (H) motifs, as well as the ratio of FOS and JUN regulon activities (I), quantified in individual cells from 11 treatment-naive melanoma tumors as profiled by Tirosh et al. and Jerby-Arnon et al. Statistical comparisons were performed using two-sided unpaired t tests. Boxplot hinges correspond to the lower and upper quartiles, with a band at the median. Whiskers indicate 1.5 times interquartile ranges.
Figure 4.
Figure 4.. MAPK inhibitor-induced changes in AP-1 protein levels, p-ERK and differentiation state markers
(A) Population-averaged measurements of 17 AP-1 proteins, differentiation state markers MITF and NGFR, and p-ERKT202/Y204 levels acquired across 18 BRAF-mutant melanoma cell lines. Protein data shown for each condition represent the log-transformed mean values for two replicates, followed by Z scoring across all cell lines and treatment conditions, including DMSO, vemurafenib alone (at 0.316 μM), or the combination of vemurafenib (at 0.316 μM) and trametinib (at 0.0316 mM) for 24 or 72 h. (B) MAPK inhibitor-induced changes in differentiation state, as evaluated by log-transformed ratio of NGFR to MITF protein levels across cell lines at 72 h. Central marks on the data points indicate the mean between two replicates. p values represent one-way ANOVA test for differences across treatment conditions in each cell line.
Figure 5.
Figure 5.. MAPK inhibitor-induced changes in cJUN and p-cJUN levels correlate with drug-induced changes in differentiation states
(A) Performance of the PLSR model in predicting drug-induced changes in differentiation states on the basis of drug-induced AP-1 modifications. Model performance was evaluated by computing the fraction of variance in DMSO-normalized differentiation state changes at 72 h explained (R2) or predicted on the basis of leave-one-out cross validation (Q2) with increasing number of PLS components. (B) PLSR-derived variable importance in projection (VIP) scores, highlighting combinations of DMSO-normalized AP-1 modifications at 24 and 72 h, and their importance for predicting the DMSO-normalized differentiation state changes at 72 h. The sign of the VIP score shows whether the indicated variable (DMSO-normalized AP-1 protein levels at 24 or 72 h) positively or negatively contributes to the response (DMSO-normalized change in differentiation state). (C) Pearson’s correlation between DMSO-normalized changes in differentiation state and DMSO-normalized cJUN or p-cJUN levels at indicated time points and drug treatment conditions. Each data point represents population-averaged measurements across two replicates for each cell line. (D) Analysis of covariance between the levels of p-cJUN or c-JUN and drug-induced changes in differentiation state (as evaluated by NGFR-MITF ratio) at the single-cell level across indicated treatment conditions. For each cell line, Pearson’s correlation coefficient was calculated on the basis of 300 randomly sampled cells (100 cells from each treatment condition).
Figure 6.
Figure 6.. MAPK inhibitor-induced changes in p-FRA1 levels correlate with efficiency of ERK pathway inhibition across cell lines
(A) Population-averaged measurements of p-ERKT202/Y204 levels in 18 cell lines following indicated MAPK inhibitor treatments for 24 or 72 h. Bar height indicates mean values between two replicates shown as black dots. p values show the statistical significance of the impact of MAPK inhibitor treatment (blue) or time (red) on p-ERK levels on the basis of two-way ANOVA. (B) Statistical comparison (using two-sided paired t test) of p-ERK levels across 18 cell lines following indicated MAPK inhibitor treatments for 24 or 72 h. Each data point represents population mean of p-ERK levels between two replicates for each cell line. (C) Pairwise partial correlations (evaluated across 18 cell lines) between each of the 17 AP-1 measurements and p-ERK levels following 24 or 72 h of treatment with MAPK inhibitors, while correcting for the corresponding baseline (drug-naive) AP-1 levels in the same cell lines. (D) Pearson’s correlation (top row) and partial correlation (bottom row) between p-ERK and p-FRA1 levels following MAPK inhibitor treatments at indicated time points. Each data point represents population mean of p-ERK levels between two replicates for each cell line. (E) Analysis of covariance between p-FRA1 and p-ERK levels across indicated MAPK inhibitor treatment conditions at the single-cell level. For each cell line, Pearson’s correlation coefficient was calculated on the basis of 400 randomly sampled cells (100 cells from each treatment condition).
Figure 7.
Figure 7.. Perturbation of AP-1 state by siRNA confirms its role in driving differentiation state heterogeneity
(A) The effect of siRNA-mediated depletion (for 96 h) of AP-1 proteins cFOS, FRA2, cJUN, and JUND, either individually or in pairwise combinations, on protein levels of cFOS, FRA1, FRA2, cJUN, and JUND and differentiation state markers MITF and SOX10 in COLO858 cells. Protein data shown for each condition represent the log-transformed mean values for three and six replicates across AP-1 knockdown conditions and the control, respectively. The central mark on the plots indicates the median across replicates. Statistical comparisons were performed using two-sided unpaired t tests. (B) Two-dimensional projection of MITF and SOX10 levels (in log scale) following 96 h of siRNA knockdown in COLO858 cells. (C and D) Statistical comparison (using two-sided unpaired t test) of selected AP-1 proteins and SOX10 levels across indicated siRNA knockdown conditions in C32 (C) and LOXIMVI (D) cells. Protein data shown for each condition represent the log-transformed mean values for three and six replicates across AP-1 knock-down conditions and the control, respectively. The central mark on the plots indicates the median across replicates.

Similar articles

Cited by

References

    1. Aibar S, González-Blas CB, Moerman T, Huynh-Thu VA, Imrichova H, Hulselmans G, Rambow F, Marine J-C, Geurts P, Aerts J, et al. (2017). SCENIC: single-cell regulatory network inference and clustering. Nat. Methods 14, 1083–1086. 10.1038/nmeth.4463. - DOI - PMC - PubMed
    1. Arias AM, and Hayward P (2006). Filtering transcriptional noise during development: concepts and mechanisms. Nat. Rev. Genet. 7, 34–44. 10.1038/nrg1750. - DOI - PubMed
    1. Baron M, Tagore M, Hunter MV, Kim IS, Moncada R, Yan Y, Campbell NR, White RM, and Yanai I (2020). The stress-like cancer cell state is a consistent component of tumorigenesis. Cell Syst. 11, 536–546.e7. 10.1016/j.cels.2020.08.018. - DOI - PMC - PubMed
    1. Battich N, Stoeger T, and Pelkmans L (2015). Control of transcript variability in single mammalian cells. Cell 163, 1596–1610. 10.1016/j.cell.2015.11.018. - DOI - PubMed
    1. Becht E, McInnes L, Healy J, Dutertre C-A, Kwok IWH, Ng LG, Ginhoux F, and Newell EW (2018). Dimensionality reduction for visualizing single-cell data using UMAP. Nat. Biotechnol. 37, 38–44. 10.1038/nbt.4314. - DOI - PubMed

Publication types

Substances