. 2022 Aug 2;40(5):111153.
doi: 10.1016/j.celrep.2022.111153.

Cancer genes disfavoring T cell immunity identified via integrated systems approach

Affiliations

Cancer genes disfavoring T cell immunity identified via integrated systems approach

Rigel J Kishton et al. Cell Rep. .

Abstract

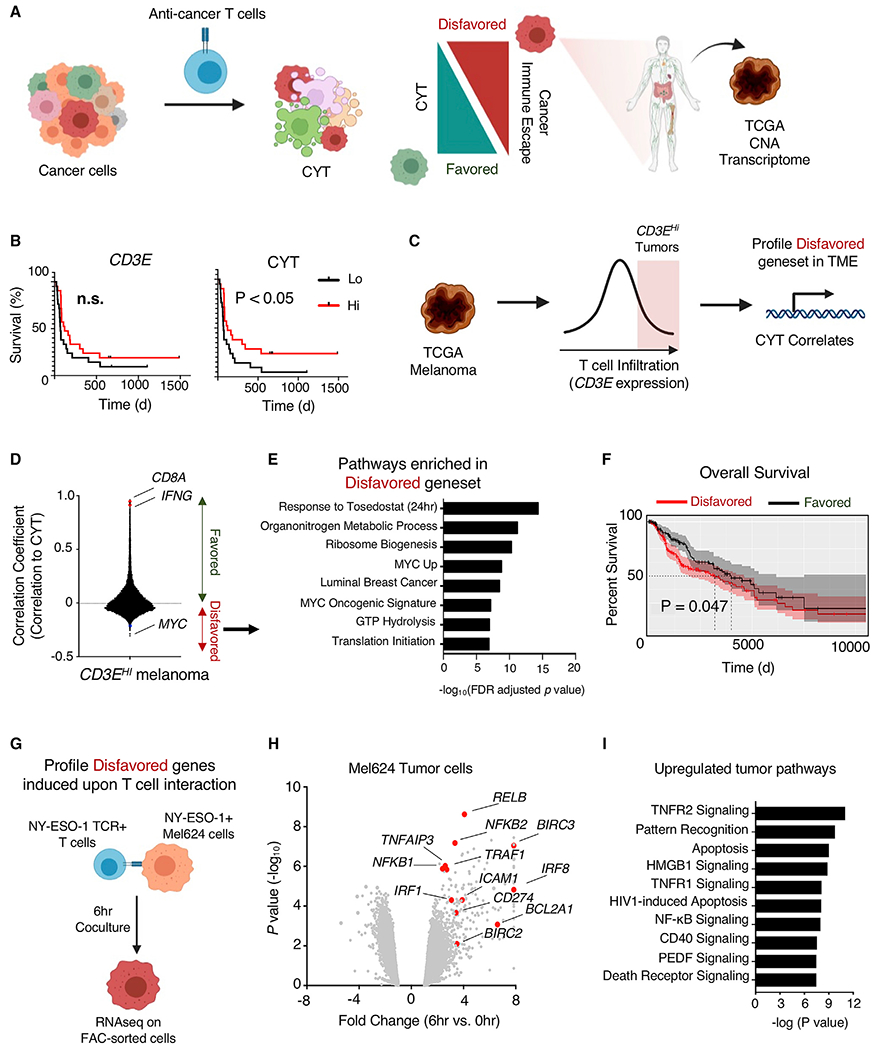
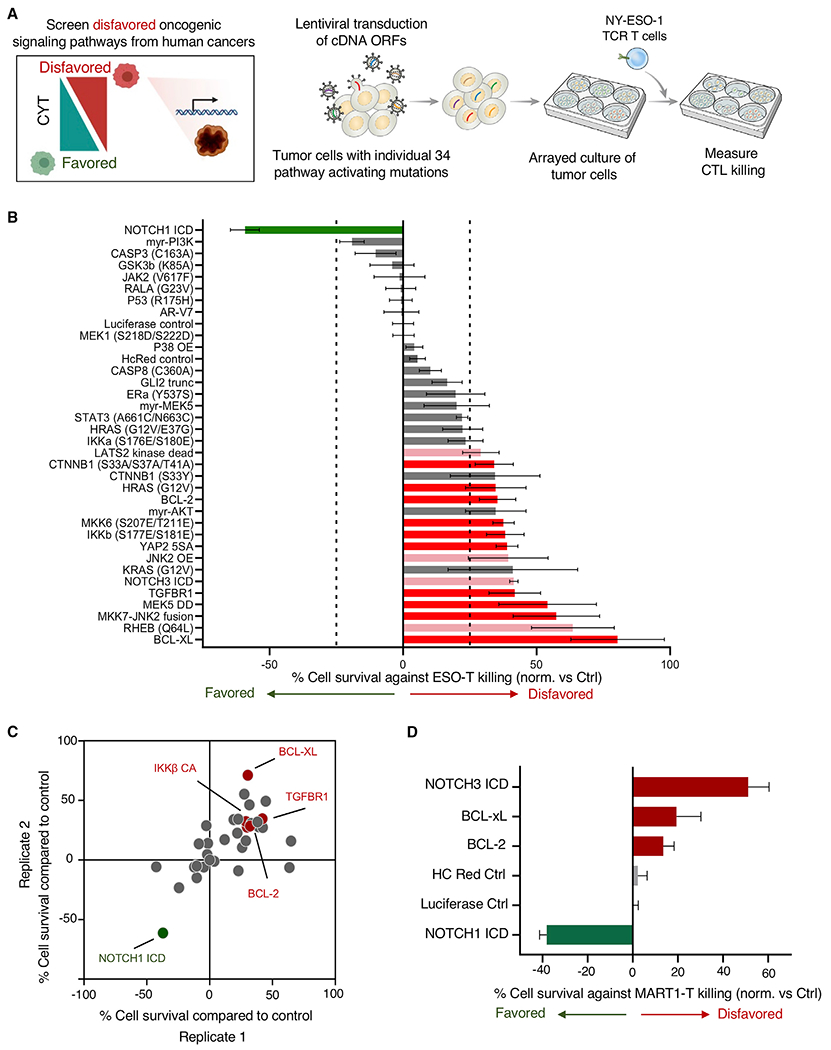
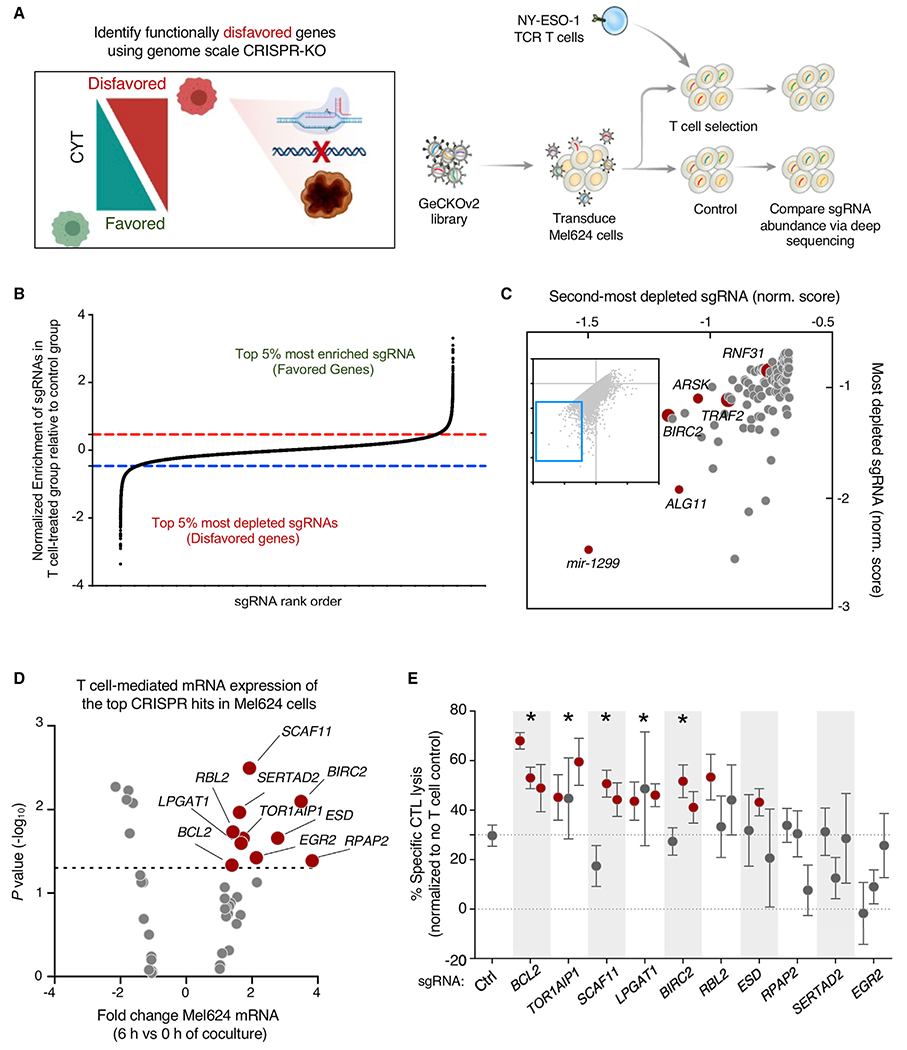
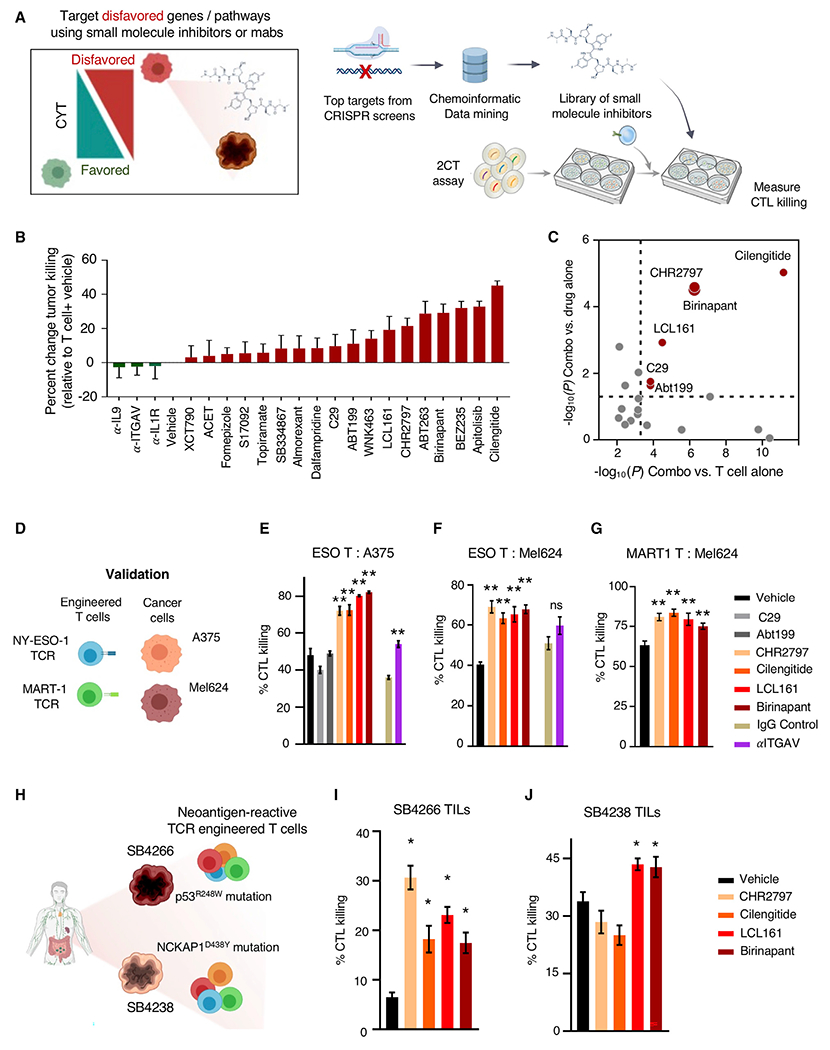
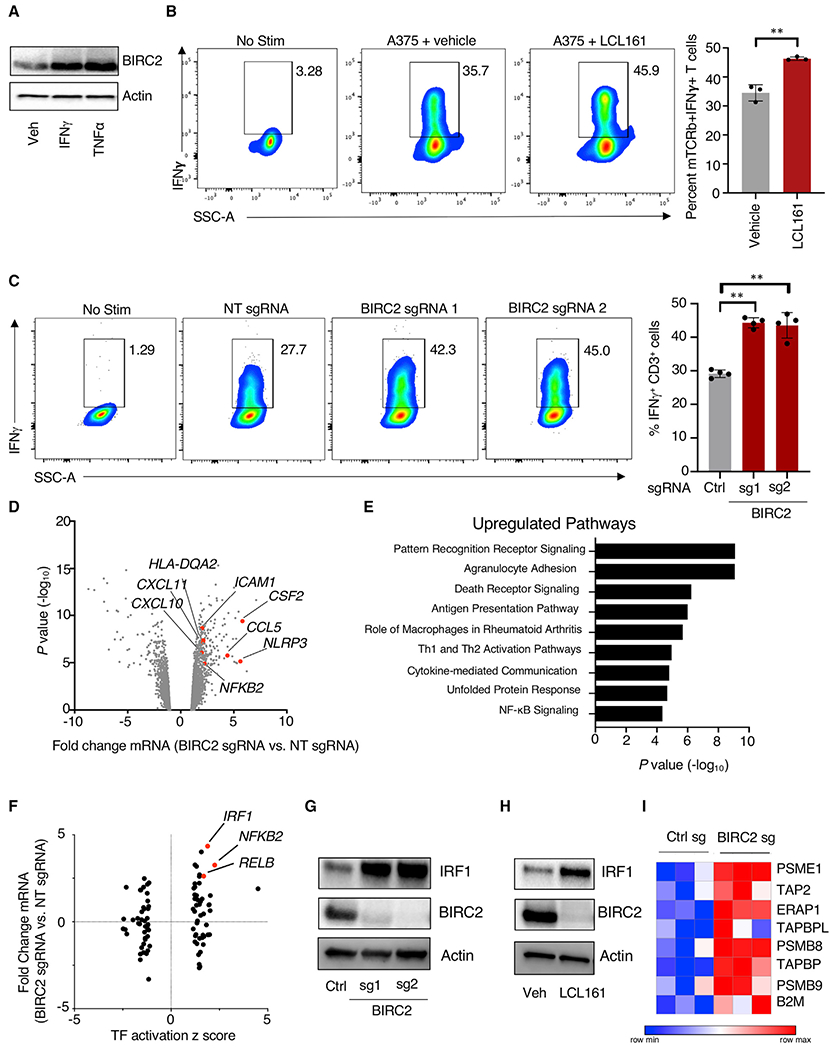
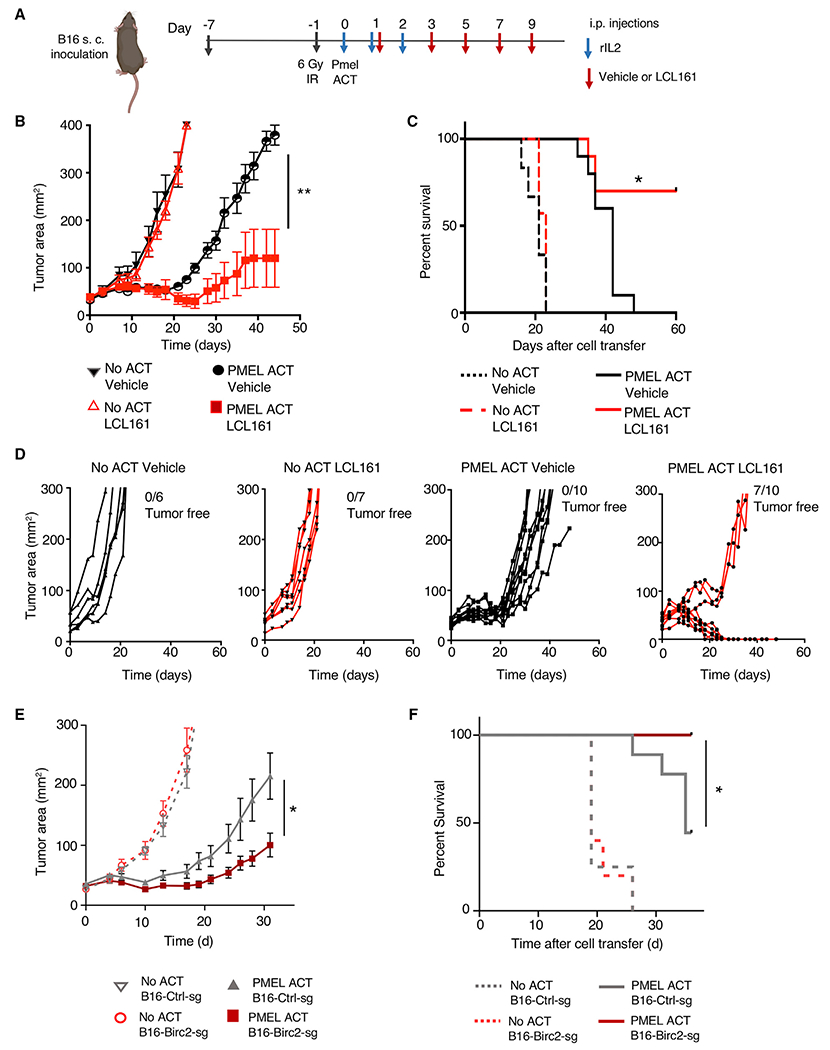
Adoptive T cell therapies (ACT) have been curative for a limited number of cancer patients. The sensitization of cancer cells to T cell killing may expand the benefit of these therapies for more patients. To this end, we use a three-step approach to identify cancer genes that disfavor T cell immunity. First, we profile gene transcripts upregulated by cancer under selection pressure from T cell killing. Second, we identify potential tumor gene targets and pathways that disfavor T cell killing using signaling pathway activation libraries and genome-wide loss-of-function CRISPR-Cas9 screens. Finally, we implement pharmacological perturbation screens to validate these targets and identify BIRC2, ITGAV, DNPEP, BCL2, and ERRα as potential ACT-drug combination candidates. Here, we establish that BIRC2 limits antigen presentation and T cell recognition of tumor cells by suppressing IRF1 activity and provide evidence that BIRC2 inhibition in combination with ACT is an effective strategy to increase efficacy.

Keywords: CP: Cancer; CP: Immunology; CRISPR screen; cell therapy; combination immunotherapy; gain-of-function screen; immunotherapy resistance.


Conflict of interest statement

Declaration of interests R.J.K., S.K.V., Y.P., and N.P.R. hold equity in and are currently employed by Lyell Immunopharma, South San Francisco, CA, USA. S.J.P. has previously held positions at Boehringer Ingelheim and NextCure Inc. and currently holds equity in NextCure Inc. N.E.S. is a scientific advisor for Vertex and Qiagen.

Figures

Figure 1.
Figure 1.. Subset of tumor-expressed genes disfavor CYT in highly immune-infiltrated human melanomas
(A) To uncover tumor-expressed genes disfavoring T cell CYT against tumor cells, the transcriptional profile of TCGA melanoma samples, copy-number alteration (CNA) of TCGA tumors, and the transcriptome of tumor cells engaged with T cells were analyzed. (B) Published data of melanoma patients treated with ipilimumab (Van Allen et al., 2015) were analyzed by stratifying patient tumors based on high and low expression of CD3E and CYT (geometric mean of GZMA and PRF1, with high and low representing above or below median values, respectively, with n = 21 patients in each group) and examining survival. Statistical analysis was performed using log rank (Mantel-Cox) test. n.s., not significant. (C) TCGA melanoma patient samples were analyzed based on expression of CD3E and stratified based on above median expression. Stratified samples were profiled for genes whose expression was significantly correlated with CYT. (D) Correlation coefficients (Pearson correlation) were calculated for all genes in tumors with above median CD3E expression. Genes with positive correlations favor T cell CYT, while genes with negative correlations disfavor CYT. (E) Pathway enrichment analysis was performed on genes with significant negative correlations, and top pathways were plotted. (F) TCGA melanoma patient survival was calculated based on normalized expression of genes favoring CYT comparing groups with below and above median gene expression. Statistical analysis was performed using log rank (Mantel-Cox) test. (G) Transcriptional analysis of tumor-expressed genes disfavoring CYT that were induced by T cell interaction was performed by co-culturing NY-ESO-1 TCR-engineered T cells with NY-ESO-1 antigen-positive Mel624 cells at a 1:3 E:T ratio for 6 h. Tumor and T cells were purified by FACS sorting, and each population was subjected to RNA sequencing (RNA-seq). (H) Volcano plot representing differentially expressed genes analyzed by RNA-seq of Mel624 cells that were co-cultured with ESO T cells for 0 or 6 h. Abundance is represented as relative fold change (x axis) versus significance (y axis). (I) Pathway enrichment analysis (Ingenuity Pathway Analysis) of Mel624 genes significantly upregulated by T cell interaction.
Figure 2.
Figure 2.. Activation of tumor oncogenic pro-growth and survival pathways alters tumor cell susceptibility to T cell CYT
(A) Systematic screening of tumor signaling pathways for potential to alter tumor vulnerability to T cell CYT was performed by transducing A375 melanoma cells with lentiviral cDNA open reading frames (ORFs) encoding proteins driving constitutive activity across pro-growth and survival signaling pathways. Transduced cells were co-cultured with NY-ESO-1 TCR-engineered T cells in an arrayed format, and cytotoxic T cell (CTL) killing of tumor cells was measured. (B) The impact of each alteration on tumor death after co-culture was determined. Modifications to tumor cells disfavoring T cell killing are shown in red and pink (red depicts modifications found to be statistically significant across 2 independent screens; pink indicates modifications driving statistically significant resistance to killing in 1 screen), and modifications increasing tumor cell killing by T cells are indicated in green. Statistical analysis was performed by 2-tailed Student’s t test, with comparison made to luciferase control. Significant hits were called with p < 0.05. Error bars depict standard deviation. (C) Results of biological replicate screens are depicted. (D) Mel624 melanoma cells were transduced with selected pathway activating constructs and susceptibility to MART-1 TCR-engineered T cells was measured. Error bars depict standard deviation.
Figure 3.
Figure 3.. Genome-scale 2CT assay uncovers tumor genes disfavoring T cell CYT
(A) Comprehensive functional genomics analysis of the potential for individual tumor genes to disfavor tumor killing by T cells. Mel624 melanoma cells were transduced with the Genome-scale CRISPR Knockout (GeCKOv2) library and cultured with ESO T cells for 6 h. sgRNA representation was measured in control and ESO T cell-treated tumor cells. Enrichment and depletion of sgRNA representation in ESO T cell-treated tumor cells was compared with control treated cells. (B) Representation of sgRNA abundance in T cell-treated tumor cells relative to control tumor cells. The top 5% most depleted sgRNAs (targeting tumor genes whose expression disfavors T cell killing of tumor) and top 5% most enriched sgRNAs (targeting tumor genes whose expression favors T cell killing of tumor) are indicated. (C) Scatterplot of the normalized enrichment of the most-depleted sgRNA versus the second-most depleted sgRNA for all genes after ESO T cell treatment (top 100 most depleted genes depicted in enlarged region. (D) Volcano plot representing differentially expressed tumor genes (identified in Figure 1H) that were identified as being significantly depleted from duplicated CRISPR 2CT screens by RIGER analysis (n = 42 genes). Expression of genes was analyzed by RNA-seq, with abundance represented as relative fold change (x axis) versus significance (y axis). Ten genes that met CRISPR screen depletion criteria were significantly induced by T cell engagement (red dots; p < 0.05, fold change >1.3. (E) The effect of gene knockout on tumor susceptibility to killing by T cells was measured by flow cytometry. Tumor genes identified in (D) were targeted with 3 independent sgRNAs. A375 melanoma cells were transduced with each sgRNA and Cas9, co-cultured with ESO T cells, and tumor killing assayed. Statistically significant sgRNAs for individual genes are indicated by red dots, as they resulted in a significant increase in tumor killing by T cells relative to non-targeting sgRNA (p < 0.05, Student’s 2-tailed t test). A gene was considered validated (indicated with *) if ≥2 sgRNAs targeting that gene resulted in statistically significant increases in T cell killing. Error bars depict standard deviation. Data are representative of 2 independent experiments, with 4 technical replicates per experiment.
Figure 4.
Figure 4.. Targeting tumor-expressed genes disfavoring T cell killing augments CYT
(A) Workflow used to identify and screen inhibitors for capacity to increase T cell-mediated destruction of tumor cells. Top 250 hits from CRISPR screen were filtered to identify targets with readily available inhibitors. Tumor cells were co-cultured with antigen-specific T cells, and tumor killing was measured. (B) A375 melanoma cells were co-cultured with ESO T cells at a 1:2 E:T ratio for 16 h in the presence or absence of inhibitors. Co-cultures were washed and tumor cell viability was measured with WST1 viability reagent. The impact of inhibitors on ESO T cells of A375 cells was measured at 500-nM inhibitor concentrations (except for α-ITGAV at 250 ng/mL and fomepizole and dalfampridine at 500 μM. (C) Plot of p values (significance threshold p < 0.05, dotted lines) between tumor elimination by the combination of inhibitor and ESO T cell treatment versus ESO T cells alone (x axis) and tumor elimination by the combination treatment versus inhibitor alone (y axis). (B and C) p values calculated by 2-tailed Student’s t test. Data are representative of 3 independent experiments, with 4 technical replicates per sample. (D) Depiction of experimental design for validation experiments. Tumor cells were co-cultured with T cells at an E:T ratio of 1:2 for 16 h in the presence or absence of inhibitors, and tumor cell viability was measured by flow cytometry. (E) A375 melanoma cells were co-cultured with ESO T cells along with inhibitors at 5 μM, except for α-ITGAV at 2.5 μg/mL, and tumor cell elimination was measured by flow cytometry. (F) Mel624 melanoma cells were co-cultured with ESO T cells along with inhibitors at 5 μM, except for α-ITGAV at 2.5 μg/mL, and tumor cell elimination was measured by flow cytometry. (G) Mel624 melanoma cells were co-cultured with MART-1 T cells along with inhibitors at 5 μM, except for α-ITGAV at 2.5 μg/mL, and tumor cell elimination was measured by flow cytometry. (H) Primary colon cancer cell lines SB4266 and SB4238 (expressing indicated mutations driving generation of neoantigens) were co-cultured with T cells engineered to express neoantigen-reactive TCRs in the presence or absence of inhibitors, and tumor killing was measured by flow cytometry. (I) Colon cancer cell line SB4266 was co-cultured with T cells transduced with a TCR reactive against p53R248W mutation along with inhibitors at 5 μM. Tumor cell death was measured by flow cytometry. (J) Colon cancer cell line SB4238 was co-cultured with T cells transduced with a TCR reactive against NCKAP1D438Y along with inhibitors at 5 μM. Tumor cell death was measured by flow cytometry. Data are representative of 4 (E and F), 3 (G), or 2 (I and J) independent experiments, with 4 technical replicates per group. Error bars depict standard deviation. Statistical significance calculated by 1-way ANOVA with multiple comparisons corrected with Dunnett’s adjustment. *p < 0.05; **p < 0.01.
Figure 5.
Figure 5.. Tumor BIRC2 expression inhibits T cell recognition of tumor through negative regulation of IRF1-mediated upregulation of antigen presentation pathway genes
(A) A375 melanoma cells were treated with IFN-γ (100 ng/mL) or TNF-α (100 ng/mL) for 8 h, and western blot analysis was performed. (B) ESO T cells were co-cultured with A375 melanoma cells in the presence or absence of 5 μM LCL161 for 5 h along with brefeldin A and monensin, and T cell intracellular production of IFN-γ was measured by flow cytometry. (C) A375 melanoma cells transduced with Cas9 and non-targeting (NT) or BIRC2-targeting sgRNAs were co-cultured with ESO T cells for 5 h in the presence of brefeldin A and monensin, and T cell intracellular production of IFN-γ was measured by flow cytometry. (D) Volcano plot representing differentially expressed genes in A375 cells transduced with Cas9 and BIRC2 targeting sgRNA versus NT sgRNA. Expression of genes was analyzed by RNA-seq and abundance represented as relative fold change (x axis) versus significance (y axis). (E) Ingenuity Pathway Analysis of genes significantly upregulated in BIRC2-targeting sgRNA transduced A375 cells. (F) Ingenuity transcription factor (TF) analysis of genes significantly upregulated in BIRC2-targeting sgRNA-transduced A375 cells. TF activation Z scores are depicted on the x axis and the fold change in mRNA for each TF is shown on the y axis. (G) A375 cells were transduced with Cas9 and NT sgRNA or BIRC2-targeted sgRNAs, and western blot analysis was performed. (H) A375 cells were treated with vehicle or 5 μM LCL161 for 16 h and western blot analysis was performed. (I) Heatmap of mRNA expression of differentially expressed genes in IRF1-related antigen presentation pathway (Rettino and Clarke, 2013) in A375 cells transduced with Cas9 and NT sgRNA or BIRC2-targeted sgRNAs. Data are representative of 3 independent experiments (A–C and G–H) or are pooled from a single experiment, with 3 biological replicates per group (D–F and I). Error bars depict standard deviation. Statistical significance was evaluated by 2-tailed Student’s t test. **p < 0.01.
Figure 6.
Figure 6.. Targeting BIRC2 in combination with adoptive transfer of T cells increases antitumor efficacy
(A) Experimental design for small-molecule in vivo combination studies. Tumor growth of hybrid gp100-expressing B16 melanoma (Hanada et al., 2019) in mice receiving adoptive cell transfer of pmel1 T cells along with vehicle or LCL161 (30 mg/kg body weight). Mice were treated with LCL161 via intraperitoneal (i.p.) injection every 2 days beginning 24 h after pmel1 T cell infusion for a total of 5 doses. Mice also received 3 doses of rIL-2. (B–D) Tumor area (B), (C) mouse survival, and (D) individual outcomes for each treated mouse are depicted. (E and F) Tumor growth curve (E) and (F) survival of mice with subcutaneous B16 melanoma tumors modified with Cas9 and non-targeting sgRNA or BIRC2-targeting sgRNA treated with pmel1 T cells. Data are representative of 3 (B–F) experiments, with at least 5 mice per group. Error bars depict SEM. Statistical significance was calculated using Wilcoxon rank-sum test (B and E) or log rank test (C and F). *p < 0.05; **p < 0.01.

References

    1. Chen S, Sanjana NE, Zheng K, Shalem O, Lee K, Shi X, Scott DA, Song J, Pan JQ, Weissleder R, et al. (2015). Genome-wide CRISPR screen in a mouse model of tumor growth and metastasis. Cell 160, 1246–1260. - PMC - PubMed
    1. Consortium, G.T (2013). The genotype-tissue expression (GTEx) project. Nat. Genet 45, 580–585. - PMC - PubMed
    1. Dougan M, Dougan S, Slisz J, Firestone B, Vanneman M, Draganov D, Goyal G, Li W, Neuberg D, Blumberg R, et al. (2010). IAP inhibitors enhance co-stimulation to promote tumor immunity. J. Exp. Med 207, 2195–2206. - PMC - PubMed
    1. Eil R, Vodnala SK, Clever D, Klebanoff CA, Sukumar M, Pan JH, Palmer DC, Gros A, Yamamoto TN, Patel SJ, et al. (2016). Ionic immune suppression within the tumour microenvironment limits T cell effect or function. Nature 537, 539–543. - PMC - PubMed
    1. Facciabene A, Motz GT, and Coukos G (2012). T-regulatory cells: key players in tumor immune escape and angiogenesis. Cancer Res. 72, 2162–2171. - PMC - PubMed

Publication types