. 2022 Sep;298(9):102288.
doi: 10.1016/j.jbc.2022.102288. Epub 2022 Aug 1.

Interactions between mTORC2 core subunits Rictor and mSin1 dictate selective and context-dependent phosphorylation of substrate kinases SGK1 and Akt

Affiliations

Interactions between mTORC2 core subunits Rictor and mSin1 dictate selective and context-dependent phosphorylation of substrate kinases SGK1 and Akt

Zanlin Yu et al. J Biol Chem. 2022 Sep.

Abstract

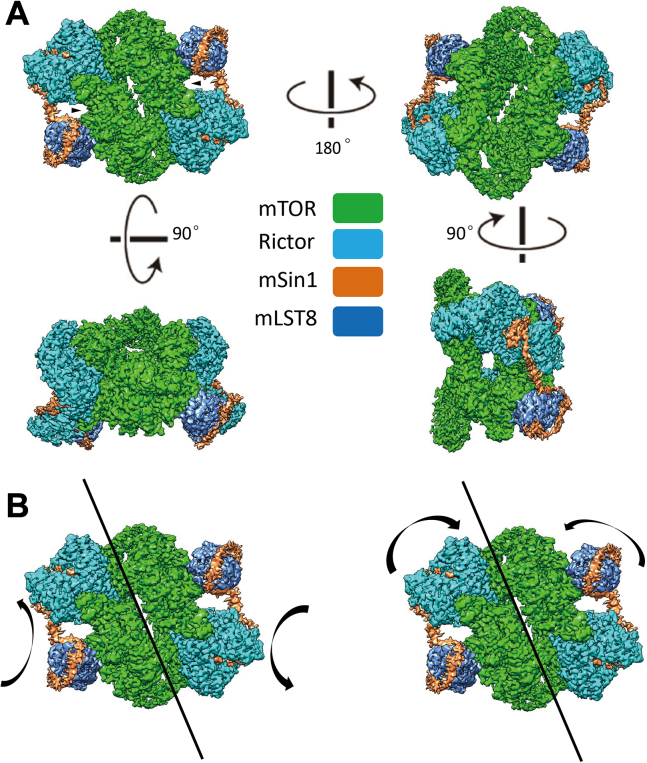
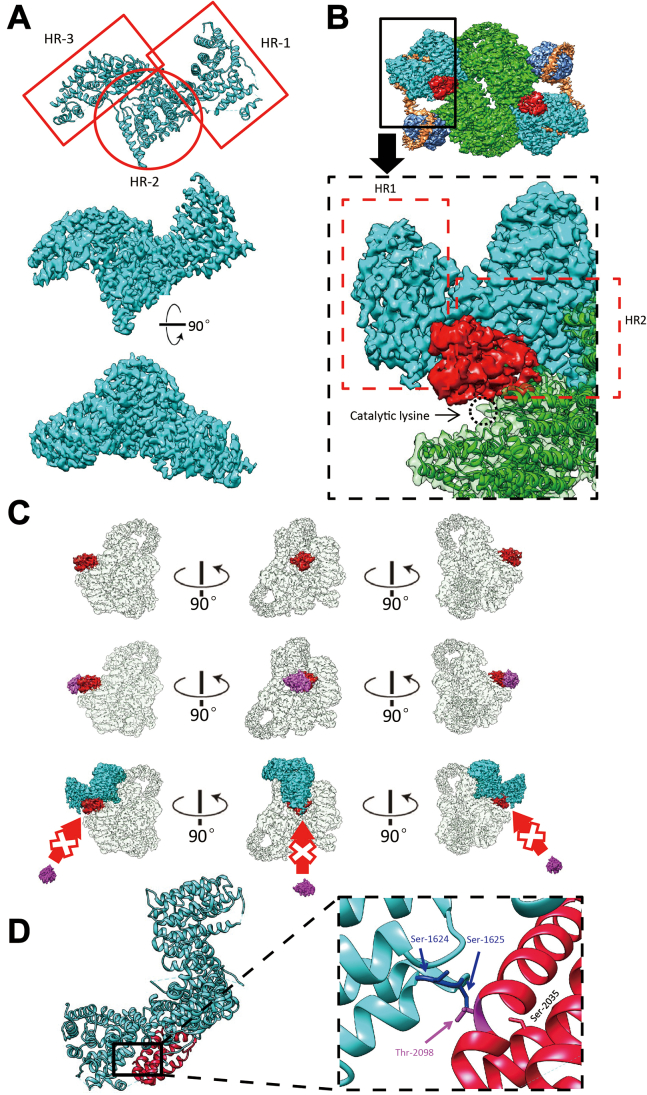
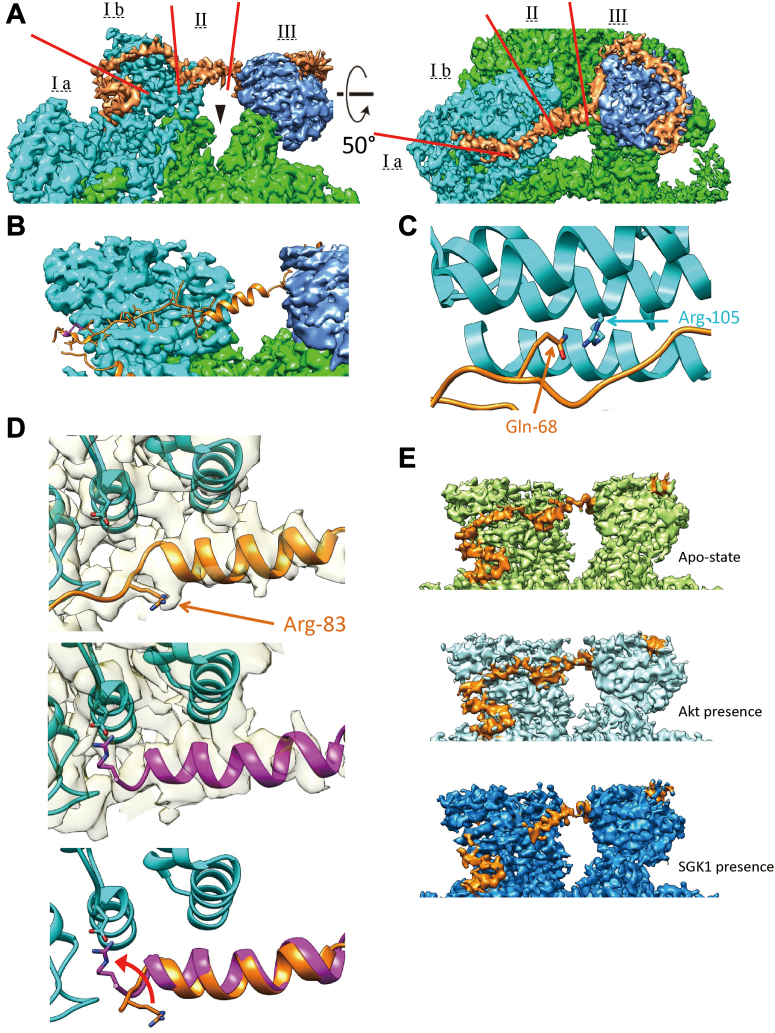
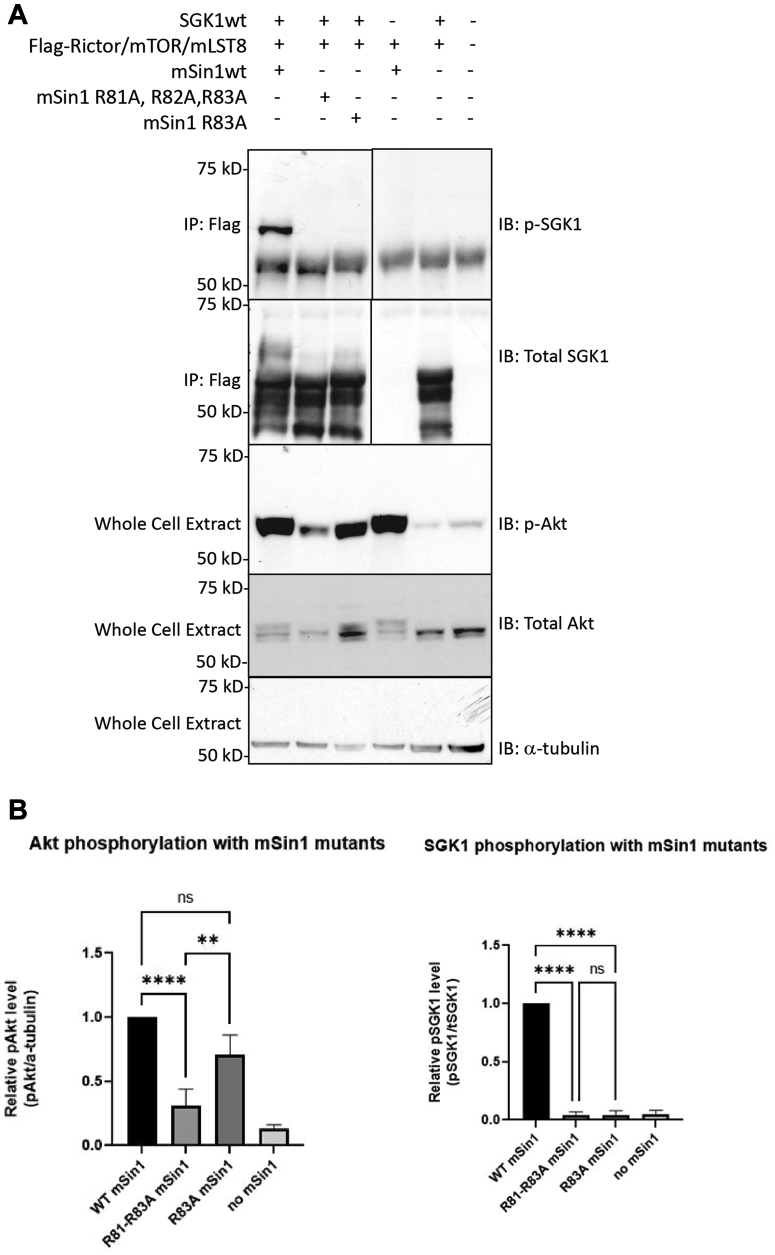
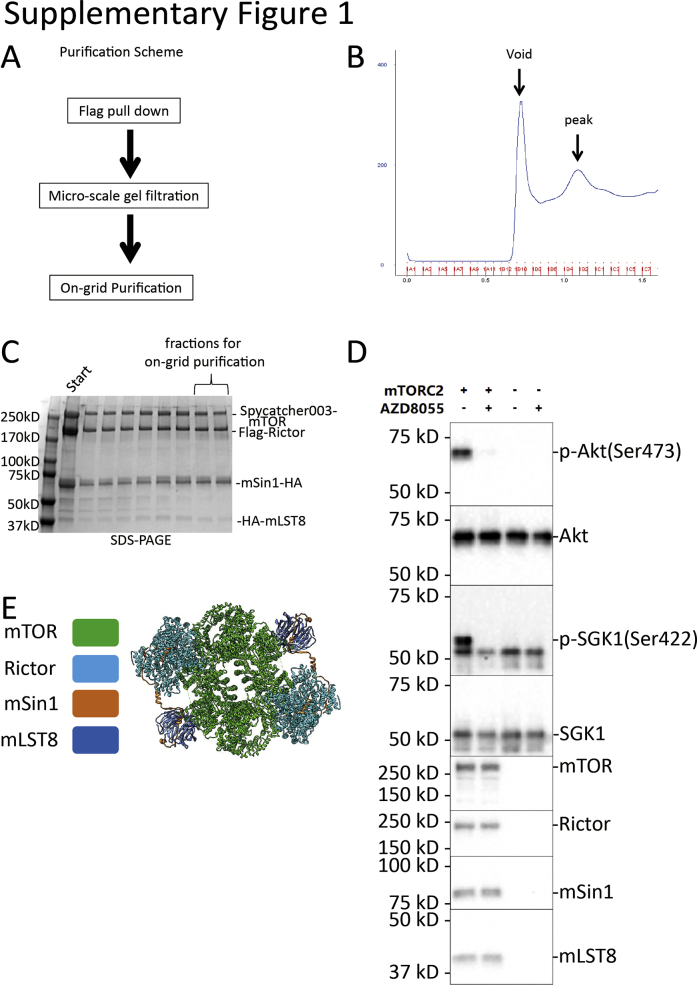
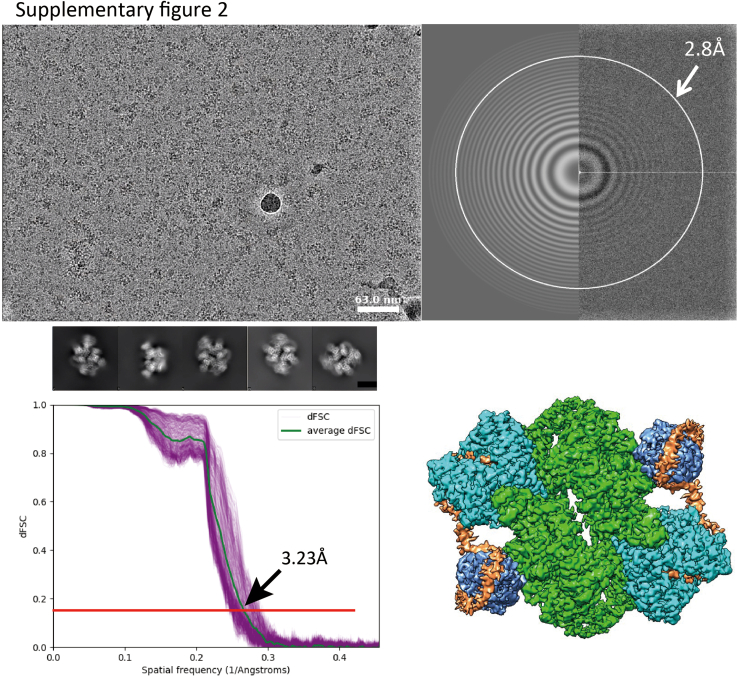
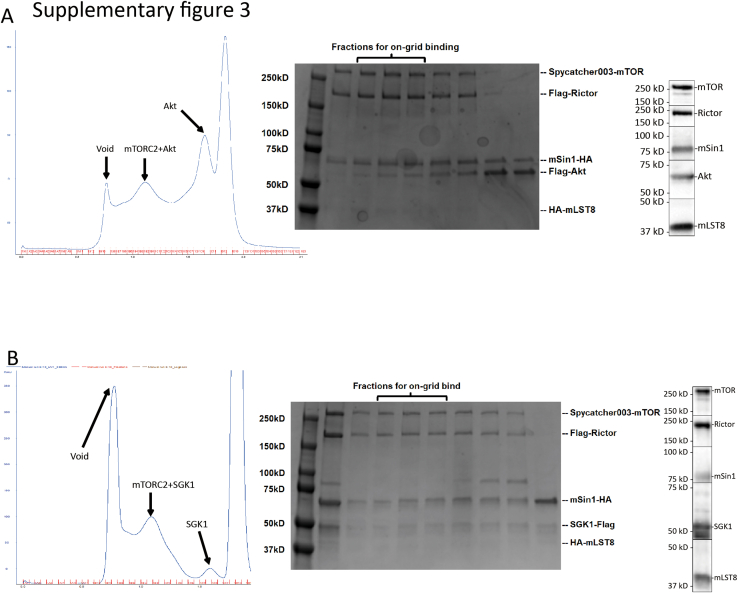
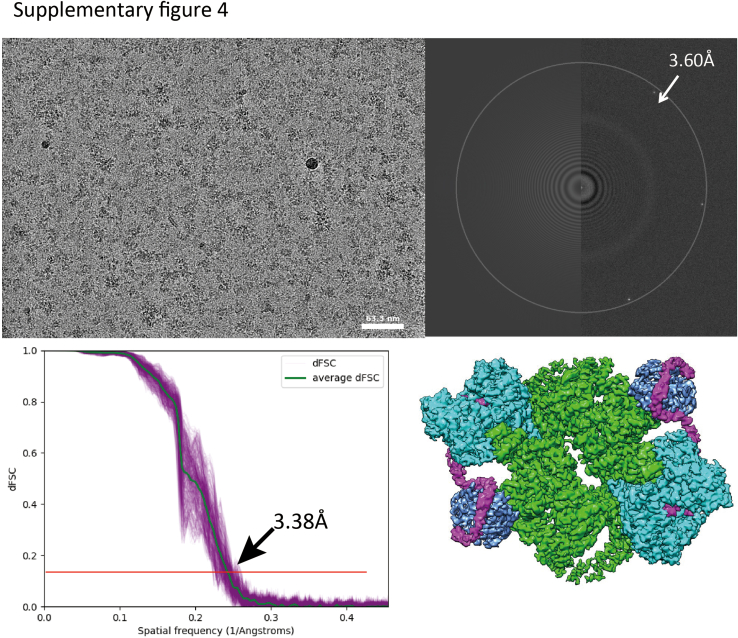
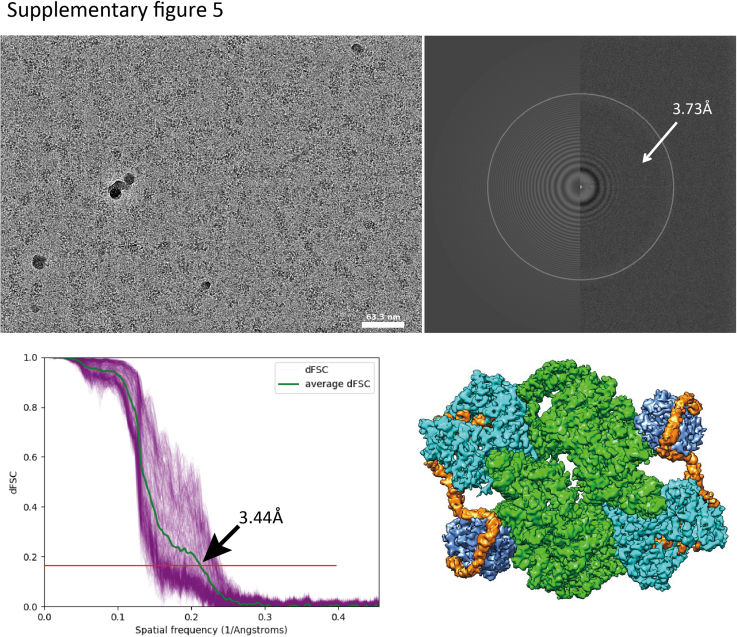
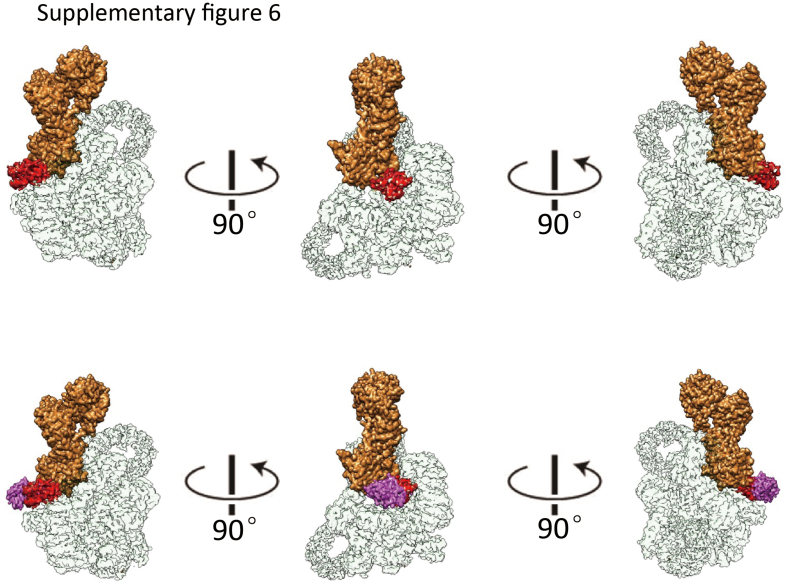
Mechanistic target of rapamycin complex 2 (mTORC2) is a multi-subunit kinase complex, central to multiple essential signaling pathways. Two core subunits, Rictor and mSin1, distinguish it from the related mTORC1 and support context-dependent phosphorylation of its substrates. mTORC2 structures have been determined previously; however, important questions remain, particularly regarding the structural determinants mediating substrate specificity and context-dependent activity. Here, we used cryo-EM to obtain high-resolution structures of the human mTORC2 apo-complex in the presence of substrates Akt and SGK1. Using functional assays, we then tested predictions suggested by substrate-induced structural changes in mTORC2. For the first time, we visualized in the apo-state the side chain interactions between Rictor and mTOR that sterically occlude recruitment of mTORC1 substrates and confer resistance to the mTORC1 inhibitor rapamycin. Also in the apo-state, we observed that mSin1 formed extensive contacts with Rictor via a pair of short α-helices nestled between two Rictor helical repeat clusters, as well as by an extended strand that makes multiple weak contacts with Rictor helical cluster 1. In co-complex structures, we found that SGK1, but not Akt, markedly altered the conformation of the mSin1 N-terminal extended strand, disrupting multiple weak interactions while inducing a large rotation of mSin1 residue Arg-83, which then interacts with a patch of negatively charged residues within Rictor. Finally, we demonstrate mutation of Arg-83 to Ala selectively disrupts mTORC2-dependent phosphorylation of SGK1, but not of Akt, supporting context-dependent substrate selection. These findings provide new structural and functional insights into mTORC2 specificity and context-dependent activity.

Keywords: Akt; SGK1; conformation change; cryo-EM; mTORC2; structure; substrate specificity.


Conflict of interest statement

Conflict of interest Y. C. is an Investigator of Howard Hughes Medical Institute. All other authors claim no conflict of interest.

Figures

Figure 1
Figure 1
The overall structure of mTORC2. A, cryo-EM structure of mTORC2 at overall resolution 3.2 Å was reconstructed. The sample was prepared in the apo-state. Four views of the structure are presented, and the rotation axis and degree between views are indicated. The subunits are colored as indicated: mTOR (green), Rictor (cyan), mLST8 (blue), and mSin1 (orange). The kinase loop of mTOR is shown by arrows. B, movement of the two heterotetramers of mTORC2 along the central axis are in two directions, twisting (left panel) and squeezing (right panel) toward the geometric core of mTORC2. See also supplementary data for movies. mTORC2, mTOR complex 2; mTOR, mechanistic target of rapamycin.
Figure 2
Figure 2
Rictor interaction with mTOR blocks rapamycin accessibility and influences mTORC2 substrate specificity. A, the atomic model based on density map generated by cryo-EM (upper panel). The high-resolution density map ensures the accuracy of the model fitted from two representative views (mid and lower panel). B, the cryo-EM density of FRB domain is colored in red in the overall density map (upper panel). In the close-up view, HR1 and HR2 of Rictor are highlighted by red-dashed rectangle frames, and the mTOR catalytic lysine is highlighted by a black-dashed circle located in the kinase cleft as indicated. To focus on the interaction of Rictor with FRB domain, mSin1 is not shown here. C, upper panel: three views of the density map of mTOR (transparent except FRB domain shown in red). Middle panel: putative FKBP12-rapamycin binding with FRB domain regardless of Rictor. Lower panel: FRB domain becomes inaccessible to FKBP12-rapamycin in the presence of Rictor. D, the atomic model of Rictor (cyan) and FRB domain of mTOR (red), as shown in the left panel. The close-up view of the local area illustrates where Thr-2098 on FRB domain and its relevant Ser-1624 and Ser-1625 of Rictor are located (right panel). Ser-2035 is shown as well. mTORC2, mTOR complex 2; mTOR, mechanistic target of rapamycin; FRB, FKBP12-rapamycin binding domain; HR, helical repeat.
Figure 3
Figure 3
Structural details of the N-terminal domain of mSin1 (orange).A, the N-terminus of mSin1 is shown in two views, comprising a Rictor-interacting section (I), a bridge section connecting Rictor and mLST8 (II) and an mLST8-interacting section (III). The Rictor-interacting section is divided into a pair of short α-helices (I a) and an extended “string” domain (I b, see text for details). The kinase cleft of mTOR is shown by arrowhead. B, string domain stays at the periphery of Rictor HR1, shown in the atomic model. C, mSin1/Gln-68, as a key amino acid to mediate SGK1 interaction with and phosphorylation by mTORC2, points toward Rictor/Arg-105 in the apo-state. D, the mSin1 Arg-83 side chain and nearby backbone with density map semi-transparent in the background are shown (upper and middle panels); nearby Rictor sequences are also seen (colored in cyan), including side chain of Asp-1679. Note marked difference in position of Arg-83 side chain in the absence (top panel) and presence (middle panel) of SGK1. mSin1 is modeled in orange in the apo-complex and purple in the SGK1 co-complex. Lower panel shows a superposition of the apo- and co-complexes (with density map hidden for clarity), emphasizing the SGK1-induced rotation in Arg-83 and formation of a salt bridge with Rictor/Asp-1679. E, mSin1 string domain is observed in the apo-complex (top panel) and co-complex with Akt (middle panel) of mTORC2 but becomes unobservable in the co-complex with SGK1 (bottom). mTORC2, mTOR complex 2; mTOR, mechanistic target of rapamycin; HR, helical repeat; string, SGK-Targeting, Rictor-InteractING.
Figure 4
Figure 4
mSin1/Arg-83 is required for SGK1 but not Akt phosphorylation.A, Western blot analysis of FLAG-immunoprecipitates (IPs) and whole-cell extracts (WCEs) derived from mSin1 KO HEK293T cells cotransfected with Myc-tagged Rictor, SpyCatcher003-tagged mTOR, HA-tagged mLST8, HA-tagged mSin1 (WT, R81A/R82A/R83A triple mutant and R83A single mutant), and FLAG-tagged SGK1. Cells were transfected and then serum starved overnight and stimulated with 100 nM insulin for 60 min. Whole cell extracts were prepared and subjected to immunoprecipitation with anti-FLAG antibody followed by immunoblotting (IB) as shown and further described in “Experimental procedures”. Blots were probed with antibodies against phosphorylated SGK1 S422 (Fig. 4A-source data 1), total SGK1 (Fig. 4A-source data 2), phosphorylated Akt (Fig. 4A-source data 3), total Akt (Fig. 4A-source data 4), and α-tubulin (Fig. 4A-source data 5), respectively. B, quantification of band intensities from the Western Blot data in (A), presented as column graph of mean ± SD from three independent experiments. ∗∗p < 0.01; ∗∗∗∗p < 0.0001 by one-way ANOVA. NS, not significant. mTOR, mechanistic target of rapamycin.
Supplementary Figure 1
Supplementary Figure 2
Supplementary Figure 3
Supplementary Figure 4
Supplementary Figure 5
Supplementary Figure 6

References

    1. Heitman J., Movva N.R., Hall M.N. Targets for cell cycle arrest by the immunosuppressant rapamycin in yeast. Science. 1991;253:905–909. - PubMed
    1. Sabatini D.M., Erdjument-Bromage H., Lui M., Tempst P., Snyder S.H. RAFT1: a mammalian protein that binds to FKBP12 in a rapamycin-dependent fashion and is homologous to yeast TORs. Cell. 1994;78:35–43. - PubMed
    1. Fu W., Hall M.N. Regulation of mTORC2 signaling. Genes (Basel) 2020;11:1045. - PMC - PubMed
    1. Saxton R.A., Sabatini D.M. mTOR signaling in growth, metabolism, and disease. Cell. 2017;169:361–371. - PubMed
    1. Luo Y., Xu W., Li G., Cui W. Weighing in on mTOR complex 2 signaling: the expanding role in cell metabolism. Oxid. Med. Cell Longev. 2018;2018 - PMC - PubMed

Publication types

MeSH terms

Substances