. 2022 Aug 4;5(12):e202201492.
doi: 10.26508/lsa.202201492.

Ubiquitome profiling reveals a regulatory pattern of UPL3 with UBP12 on metabolic-leaf senescence

Affiliations

Ubiquitome profiling reveals a regulatory pattern of UPL3 with UBP12 on metabolic-leaf senescence

Wei Lan et al. Life Sci Alliance. .

Abstract

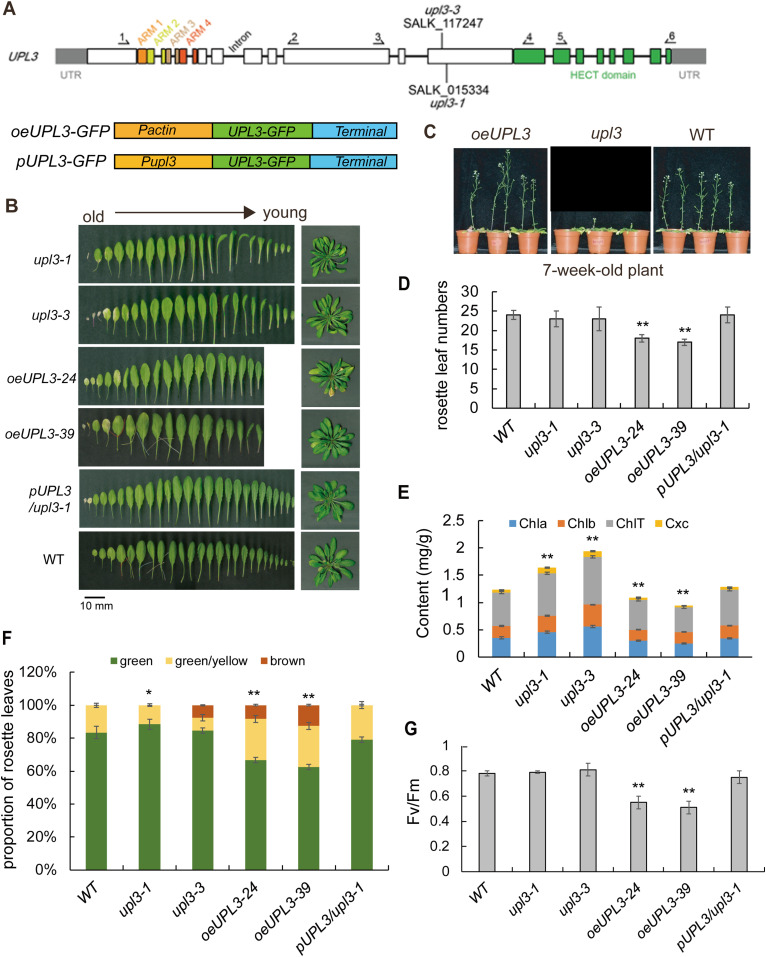
The HECT-type UPL3 ligase plays critical roles in plant development and stress protection, but understanding of its regulation remains limited. Here, the multi-omics analyses of ubiquitinated proteins in <i>upl3</i> mutants were performed. A landscape of UPL3-dependent ubiquitinated proteins is constructed: Preferential ubiquitination of proteins related to carbon fixation represented the largest set of proteins with increased ubiquitination in the <i>upl3</i> plant, including most of carbohydrate metabolic enzymes, BRM, and variant histone, whereas a small set of proteins with reduced ubiquitination caused by the <i>upl3</i> mutation were linked to cysteine/methionine synthesis, as well as hexokinase 1 (HXK1) and phosphoenolpyruvate carboxylase 2 (PPC2). Notably, ubiquitin hydrolase 12 (UBP12), BRM, HXK1, and PPC2 were identified as the UPL3-interacting partners in vivo and in vitro. Characterization of <i>brm</i>, <i>upl3</i>, <i>ppc2</i>, <i>gin2</i>, and <i>ubp12</i> mutant plants and proteomic and transcriptomic analysis suggested that UPL3 fine-tunes carbohydrate metabolism, mediating cellular senescence by interacting with UBP12, BRM, HXK1, and PPC2. Our results highlight a regulatory pattern of UPL3 with UBP12 as a hub of regulator on proteolysis-independent regulation and proteolysis-dependent degradation.


Conflict of interest statement

The authors declare that they have no conflict of interest.

Figures

Figure 1.
Figure 1.. Phenotype of representative 6-wk-old wild-type and upl3 plants.
(A) Organization of the UPL3 gene and plasmid constructs for transgenic plants. (B) Phenotype of representative 6-wk-old wild-type, upl3, and oeUPL3 transgenic plants, as well as complemented line (pUPL3/upl3-1). Leaf senescence and curled leaves are indicated. Bars = 10 mm. (C) Representative images showing the bolting of plants in the seventh week after germination. (D) Rosette leaf numbers of the wild-type, upl3-1, oeUPL3-24, and pUPL3/upl3-1 plants (n > 20), indicating flowering time. (E) Chlorophyll content and carotenoid content measured in the rosettes of 6-wk-old wild-type, upl3-1, and oeUPL3-24 plants. Chla, chlorophyll a; Chlb, chlorophyll b; ChlT, total chlorophyll; Cxc, carotenoid. (F) Proportion of green and yellow leaves of whole rosette of 8-wk-old plants (n = 12). Error bars represent the SD of six biological replicates. Asterisks denote statistically significant differences from the WT, calculated using t test: *P < 0.05; **P < 0.01; and ***P < 0.001. (G) Photosystem II fluorescence activity (Fv/Fm) of the fifth rosette leaf of 6-wk-old plants (n = 9).
Figure S1.
Figure S1.. Transcript level of UPL3 detected in the upl3 mutants by semi-qRT-PCR.
(A) Schematic of T-DNA insertion site of UPL3 gene in genome. (B) Transcript level of the upl3 mutants detected by semi-qRT-PCR. GAPC2 is used as a control. (A) Primer (P) pairs’ position is indicated in (A). Primer sequences are listed in Table S2. (C) Protein level of the upl3 mutants (upl3-1, upl3-3) and oeUPL3 lines (oe-39, oe-24) and complement line (pUPL3/upl3-1) detected by Western blot using an antibody against GFP. The predicted size of the entire protein is ∼250 kD appeared in oeUPL3-24/-39 lines, along with an additional 100-kD band (possible proteolysis statue). Yellow arrowhead presents UPL3-GFP.
Figure S2.
Figure S2.. The expression pattern of UPL3 in different tissue during plant development.
(A) Expression level of UPL3 from the Arabidopsis Information Resource (TAIR) eFP Browser dataset (https://bar.utoronto.ca/efp/cgi-bin/efpWeb.cgi). (B) GUS staining of PUPL3:GUS plants. (a) Three days after germination (dag), (b) 4 dag, (c) 52 dag, (d) and (g) 10 dag, (e) and (h) 21 dag, (f) and (i) 35 dag, (j) 1 dag seedlings. Bar = 5 mm. (C) Flowering rate of the upl3 and the oeUPL3 plants relative to WT. Hundred plants are used to calculate. (D) Transcript level of early senescence marker gene (WRKY53) and floral transition marker gene (FT) in the upl3 and the oeUPL3 plants relative to WT. Asterisk indicates significant differences (*P < 0.05, **P < 0.01) based on the t test compared with WT plants.
Figure 2.
Figure 2.. Identification of ubiquitin conjugates in 6-wk-old upl3 plants compared with the wild type.
(A) A label-free mass spectrometry–based analysis procedure of protein ubiquitination using K-epsilon-GG remnant antibody enrichment approach. (B) Venn diagrams showing the enrichment of differentially ubiquitinated proteins in the upl3 background. (C) Immunodetection of global ubiquitinated proteins in plants of WT and mutants using an antibody against ubiquitin. The upl5 plant is included for a comparison. WB of β-tubulin is used as protein-loading controls. The gray intensity of three replicates was calculated by ImageJ. (D) Distribution of enriched proteins within differential fold-change levels by upl3 relative to WT. (E) Volcano plot of individual ubiquitination site showing their P-value and the log2FC. Dark-gray points are conjugates considered to be “abundant” by their detection in three biological replicates in either background (upl3 and/or the wild type). Proteins with a significant decrease or increase in ubiquitination in the upl3 mutant compared with the wild type (P-value < 0.05) are highlighted in red and blue, respectively. Ubiquitinated targets identified in all wild-type biological replicates and never or only once in the upl3 mutant but that were above the significance threshold of P-value > 0.05 are in yellow. The dashed line represents the theoretical situation, where conjugate abundance in the wild type and upl3 is equal. The horizontal dashed line highlights a P-value = 0.05. The vertical dashed lines highlight a 1.2-fold (log2FC = 0.26) increase or decrease. Source data are available for this figure.
Figure S3.
Figure S3.. Quality detection of the tryptic peptides of ubiquitin conjugates in the 6-wk-old upl3 plants and wild-type plants.
(A) Detection of the mass error of all identified peptides (mass error). The quality error takes 0 as the central axis and is concentrated in the range of less than 10 ppm, indicating that the quality error meets the requirements. (B) The length of most peptide segments is distributed between 8– and 20–amino acid residues, which is in line with the law of trypsin-digesting peptide segments, indicating that the sample preparation meets the standard. (C) Detection of statistically significant similarity of two replicates by heatmap of Pearson’s correlation coefficient. rep: replicate, A: WT, B: upl3. (D) Detection of statistically significant similarity of two replicates by scatter diagram. rep: replicate, A: WT, B: upl3-1. This coefficient is a measure of the degree of linear correlation between the two groups of data: when the Pearson coefficient is closer to −1, it is negative correlation; closer to 1, it is positive correlation; and closer to 0, it is irrelevant.
Figure 3.
Figure 3.. GO term and KEGG pathway enrichments for the UPL3-associated ubiquitin conjugates (|FC| > 1.2, P-value < 0.05).
(A) GO term enrichment in categories of molecular functions of UPL3-associated ubiquitin conjugates. (B) Bubble plots showing the KEGG pathway of UPL3-associated ubiquitin conjugate differentially ubiquitin conjugates. (C) The UPL3-regulated ubiquitin conjugates of the upl3/WT mapped in the carbon fixation pathway. (D) The UPL3-ubiquitinated conjugates of the upl3/WT mapped in cysteine and methionine metabolism pathway. (E) Distribution of UPL3-associated differentially ubiquitin conjugates associated with cellular components. (F) Subcellular localization of UPL3 in the nucleus of Arabidopsis leaves transiently expressing a C-terminal GFP fusion. The GFP-alone expressing leaves sample is used as the control. The nucleus is counter-stained with DAPI. Bars = 20 μm.
Figure S4.
Figure S4.. The UPL3-related ubiquitin conjugates.
(A, B) The list of the UPL3-influenced ubiquitin conjugates (A) and UPL3-dependent ubiquitin conjugates (B) in the upl3/WT. Pink color indicates ubiquitin enriched in the upl3 relative to the wild type, and blue color indicates ubiquitin down-regulated in the upl3 relative to the wild type.
Figure S5.
Figure S5.. Gene Ontology (GO) enrichment of genes with differential ubiquitinated conjugates (fold-change > 1.5) of upl3/WT.
(A) Ubiquitin-enriched targets. (B) Ubiquitin–down-regulated targets. Cytoscape analysis exhibited a biological network of differentially ubiquitin conjugates in many clustered interaction network with broadly distinct hubs. Functionally clustered network with terms as nodes linked based on their kappa score level (≥0.3). Edge weight indicates intensity of clustered interaction. The red gradient of nodes represents the term enrichment significance. Cluster without any interaction partners within the network indicate singletons. The size of node indicates the gene proportion of each cluster associated with the term.
Figure 4.
Figure 4.. Protein domains and lysine footprints of UPL3-associated differentially ubiquitin conjugates (|FC| > 1.2, P-value < 0.05).
(A) GO terms enrichment analysis of enriched protein domains of differentially ubiquitin conjugates (|FC| > 1.2, P-value < 0.05) via InterProScan. (B) The consensus ubiquitin attachment motif identified by the MEME Suite. (C) List of apparent ubiquitin attachment sites and motif in identified proteins (|FC| > 1.5, P-value < 0.05). R1 and R2 are two replicates. Those up-regulated and down-regulated in upl3 relative to WT were highlighted in red and blue, respectively.
Figure S6.
Figure S6.. The protein domain analysis of differential ubiquitinated conjugates within different fold-change regions by the upl3 relative to WT by heatmap.
Red color indicates up-regulated, and blue color indicates down-regulated.
Figure S7.
Figure S7.. Preparation and quality detection of the GFP-binding protein (GBP) bead.
GFP protein (∼30 kD) isolated from ACTIN3:GFP plants was immunodetected by an antibody against GFP (left), and the protein was stained by Coomassie (right). M: protein marker, lane1: GFP input, lane2: GFP-IP, lane3: washing solution (supernatant after immunoprecipitation); ∼30-kD signal indicated GFP protein.
Figure 5.
Figure 5.. UPL3-interacting proteins overlapping with differentially ubiquitin conjugates (DUCs) identify potential UPL3-ubiquitinated substrates ABCG36, MS2, OEP6, PPC2, and LOS1.
(A) Immunodetection of protein samples isolated from GFP- and UPL3-GFP–expressing plants with an antibody against GFP. (B) Nano-trapped proteins for MS analysis. (C) Overlapping proteins between UPL3-interacting candidates and the DUCs. Eighty-one putative interacting proteins were identified as specific to UPL3-GFP, which contained 29 and 11 DUCs with a fold-change |FC| > 1.2 or 1.5, respectively. (D) Enrichment of the KEGG pathway in the overlapping genes highlights an involvement of potential UPL3-ubiquitinated substrates in the IP3K pathway and in ribosomal activity. Red color indicates up-regulated, and blue color indicates down-regulated. (E) List of most notable interacting candidates of UPL3 with their respective fold-change of ubiquitination level in upl3 versus wild-type plants. Orange indicates up, and blue color indicates down. The fold-change is indicated with the data. Source data are available for this figure.
Figure 6.
Figure 6.. Confirmation and characterization of UPL3 interaction with its targets.
(A) Domain structure of the UPL3 protein showing the full-length and the N-terminus used in Y2H assay. (B) Confirmation of UPL3 interaction with its targets in a yeast two-hybrid assay. The AD or BD empty vector was used as a negative control, and the interacting pair UPL5-WRKY53 was used as a positive control. SD/-LT: SD media minus Leu and Trp, SD/-ALTH: SD media minus Ade, Leu, Trp, and His. Bars = 10 mm. (C) UBP12 interacts with BRM, PPC2, but not HXK1 in a yeast two-hybrid assay. SD/-LT: SD media minus Leu and Trp, SD/-LTH: SD media minus Leu, Trp, and His, SD/-ALTH: SD media minus Ade, Leu, Trp, and His. Bars = 10 mm. (D, E) The detection of bimolecular fluorescence complementary assay; an empty vector was used as a negative control (Fig S8B). Bars = 20 μm. (F) CoIP detection of ubiquitin conjugates (representation: HXK1 and PPC2) in the overexpression UPL3-GFP and UBP12-GFP plants compared with wild-type plants. Antibodies against HXK1 and PPC2 (Agrisera) and anti-GFP (Rothe) are used. Source data are available for this figure.
Figure S8.
Figure S8.. Interaction of UPL3 with its putative interacting partners.
(A) Interaction of UPL3 with its putative interacting partners by yeast two-hybrid. Bars = 10 mm. (B) Interaction of UPL3 or UBP12 with an empty vector of BiFC is used as negative controls. Bars = 20 μm. (C) Detection of antibodies against HXK1, PPC2, and BRM in the gin2, the ppc2, and the brm mutants compared with WT by Western blotting; Ponceau staining is used as loading controls.
Figure 7.
Figure 7.. The protein levels of representation: BRM, HXK1, and PPC2 in the UPL3 or UBP12 mutants.
(A) A total of 3,557 Arabidopsis proteins could be reproducibly identified and quantified in both samples by our liquid chromatography–mass spectrometry (LC–MS) regime analyzed in total triplicate, 3,445 of which were described here as targets of UPL3-associated DEPs (cutoff, P-value < 0.05). (B) Numbers of differentially expression proteins (DEPs) (|FC| > 1.5, P-value < 0.05) of upl3 relative to WT (Left). Numbers of differentially ubiquitinated conjugates (|FC| > 1.2, P-value < 0.05) normalized to DEPs (|FC| > 1.5, P-value < 0.05) (Right). Orange, up-regulated; blue, down-regulated. (C) The fold-change of UBP proteins and BRM, PPC1, PPC2, UBC2, UBC7, HXK1 from proteome dataset of upl3/WT (Supplemental Data 5). (D) Immuno-detection of ubiquitin conjugates (representation: BRM, HXK1, and PPC2) in the upl3 and the ubp12; overexpression UPL3 and UBP12 plants compared with wild-type plants. Antibodies against BRM (provided by Dr. Rongcheng Lin), PPC2, and HXK1 (Agrisera) and polyubiquitin (Cell Signaling Tech) are used, and the tubulin level is used as protein-loading controls. (E) Immuno-detection of ubiquitin conjugates (representation: BRM, HXK1, and PPC2) in the upl3 and the ubp12; overexpression UPL3 and UBP12 plants compared with wild-type plants after treatment of ubiquitination inhibitor MG132. (F, G, H) Starch staining with KI and quantification of starch and sucrose in 18–21-d-old rosettes (n = 5). Error bar represents the SD of triplicates. Asterisks denote the statistically significant level different with the wild type, as verified via t test: *P, 0.05; **P, 0.01, n = 5. Source data are available for this figure.
Figure S9.
Figure S9.. Quality detection of the tryptic peptides of proteomes in the 6-wk-old upl3 plants and wild-type plants.
(A) Detection of the mass error of all identified peptides (mass error). The quality error takes 0 as the central axis and is concentrated in the range of less than 10 ppm, indicating that the quality error meets the requirements. (B) The length of most peptide segments is distributed between 8– and 20–amino acid residues, which is in line with the law of trypsin digesting peptide segments, indicating that the sample preparation meets the standard. (C) Detection of statistically significant similarity of two replicates by heatmap of Pearson’s correlation coefficient. rep: replicate, A: WT, B: upl3. (D) Detection of statistically significant similarity of two replicates by scatter diagram. rep: replicate, A: WT, B: upl3. This coefficient is a measure of the degree of linear correlation between the two groups of data: when the Pearson coefficient is closer to −1, it is negative correlation; closer to 1, it is positive correlation; and closer to 0, it is irrelevant.
Figure S10.
Figure S10.. The transcript level of BRM, PPC2, and HXK1 in the in loss- or gain-of-UPL3 and -UBP12 mutants.
The value represents average value of three replicates.
Figure 8.
Figure 8.. The brm, ppc2, ubp12, and oeUPL3 plants show similar early leaf senescence and early-flowering phenotypes.
(A) Phenotypes of 5-wk-old plants. Bars = 5 mm. (B) Bolting and flowering phenotype of the 5-wk-old plants. Bars = 40 mm. (C) Rosette leaf numbers of different genotypes at indicated time (n > 20). (D) Chlorophyll content in rosette leaves of 6-wk-old plants (n = 3). (E) Photosystem II fluorescence activity (Fv/Fm) of rosette leaves of 6-wk-old plants (n = 5). (F) Proportion of green and yellow leaves of the whole rosette of 8-wk-old plants (n = 12). (G) Quantitative real-time PCR of gene expression from 6-wk-old upl3 and wild-type plants for 13 selected plant aging and senescence-related transcription factors. Error bars represent the SD of three biological replicates. (H) GO terms enrichment analysis of 1,467 differential display genes (DEGs, |FC| > 2, P-value < 0.05) of upl3/WT.
Figure S11.
Figure S11.. Flowering rates of upl3, brm, gin2, ppc2, and ubp12 lines compared with wild type.
A total of 120 plants were used to calculate.
Figure S12.
Figure S12.. Co-analysis of UPL3-dependent transcriptome highlights stress-related genes.
(A) Venn diagrams showing overlaps of differentially ubiquitin conjugates (fold-change > 1.5) and transcriptome DEGs (log2FC > 1.3) of upl3 relative to WT, RNA-seq data released from the ArrayExpress database at EMBL-EBI (www.ebi.ac.uk/arrayexpress) under the accession number E-MTAB-7374 (Furniss et al, 2018). (A, B) List of the 26 overlapping genes of differentially ubiquitin conjugates and DEGs, as in (A). Text in blue and orange denotes a down- or up-regulation in the upl3 plants, respectively.
Figure 9.
Figure 9.. A noncanonical working model of UPL3 in regulating cell senescence of Arabidopsis by multi-omics and genetics analysis.
Based on integrative datasets of ubiquitome, proteome, and transcriptome. Preferential ubiquitination of proteins related to carbon fixation represented the largest set of proteins with increased ubiquitination in the upl3 plant, whereas a small set of proteins with reduced ubiquitination caused by the upl3 mutation were linked to cysteine/methionine synthesis processes. Notably, ubiquitin hydrolase 12 (UBP12), BRM, HXK1, and PPC2 were among the UPL3-interacting partners identified as the UPL3-interacting partners by both GFP nanotrap–mass spectrometry analyses and yeast two-hybrid assay; characterization of upl3-, brm-, ppc2-, gin2-, and ubp12-mutant plants and transcriptome analysis suggested that UPL3 fine-tunes carbon metabolism, mediating cellular senescence via proteolysis-independent regulation and proteolysis-dependent degradation on metabolism-mediated cell senescence. Red color represents up-regulated, blue color represents down-regulated, thick frame represents more numbers of ubiquitinated proteins.

Similar articles

Cited by

References

    1. An Z, Liu Y, Ou Y, Li J, Zhang B, Sun D, Sun Y, Tang W (2018) Regulation of the stability of RGF1 receptor by the ubiquitin-specific proteases UBP12/UBP13 is critical for root meristem maintenance. Proc Natl Acad Sci U S A 115: 1123–1128. 10.1073/pnas.1714177115 - DOI - PMC - PubMed
    1. Archacki R, Yatusevich R, Buszewicz D, Krzyczmonik K, Patryn J, Iwanicka-Nowicka R, Biecek P, Wilczynski B, Koblowska M, Jerzmanowski A, et al. (2017) Arabidopsis SWI/SNF chromatin remodeling complex binds both promoters and terminators to regulate gene expression. Nucleic Acids Res 45: 3116–3129. 10.1093/nar/gkw1273 - DOI - PMC - PubMed
    1. Bensussan M, Lefebvre V, Ducamp A, Trouverie J, Gineau E, Fortabat MN, Guillebaux A, Baldy A, Naquin D, Herbette S, et al. (2015) Suppression of dwarf and irregular xylem phenotypes generates low-acetylated biomass lines in Arabidopsis. Plant Physiol 168: 452–463. 10.1104/pp.15.00122 - DOI - PMC - PubMed
    1. Berndsen CE, Wolberger C (2014) New insights into ubiquitin E3 ligase mechanism. Nat Struct Mol Boil 21: 301–307. 10.1038/nsmb.2780 - DOI - PubMed
    1. Besche HC, Sha Z, Kukushkin NV, Peth A, Hock EM, Kim W, Gygi S, Gutierrez JA, Liao H, Dick L, et al. (2014) Autoubiquitination of the 26S proteasome on Rpn13 regulates breakdown of ubiquitin conjugates. EMBO J 33: 1159–1176. 10.1002/embj.201386906 - DOI - PMC - PubMed

Publication types

MeSH terms