Cardiovascular Disease Projections in the United States Based on the 2020 Census Estimates
- PMID: 35926929
- PMCID: PMC9396356
- DOI: 10.1016/j.jacc.2022.05.033
Cardiovascular Disease Projections in the United States Based on the 2020 Census Estimates
Abstract
Background: Understanding trends in cardiovascular (CV) risk factors and CV disease according to age, sex, race, and ethnicity is important for policy planning and public health interventions.
Objectives: The goal of this study was to project the number of people with CV risk factors and disease and further explore sex, race, and ethnical disparities.
Methods: The prevalence of CV risk factors (diabetes mellitus, hypertension, dyslipidemia, and obesity) and CV disease (ischemic heart disease, heart failure, myocardial infarction, and stroke) according to age, sex, race, and ethnicity was estimated by using logistic regression models based on 2013-2018 National Health and Nutrition Examination Survey data and further combining them with 2020 U.S. Census projection counts for years 2025-2060.
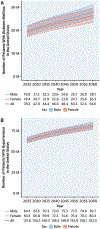
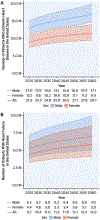
Results: By the year 2060, compared with the year 2025, the number of people with diabetes mellitus will increase by 39.3% (39.2 million [M] to 54.6M), hypertension by 27.2% (127.8M to 162.5M), dyslipidemia by 27.5% (98.6M to 125.7M), and obesity by 18.3% (106.3M to 125.7M). Concurrently, projected prevalence will similarly increase compared with 2025 for ischemic heart disease by 31.1% (21.9M to 28.7M), heart failure by 33.0% (9.7M to 12.9M), myocardial infarction by 30.1% (12.3M to 16.0M), and stroke by 34.3% (10.8M to 14.5M). Among White individuals, the prevalence of CV risk factors and disease is projected to decrease, whereas significant increases are projected in racial and ethnic minorities.
Conclusions: Large future increases in CV risk factors and CV disease prevalence are projected, disproportionately affecting racial and ethnic minorities. Future health policies and public health efforts should take these results into account to provide quality, affordable, and accessible health care.
Keywords: ethnicity; heart disease; population health; projection; race; sex.
Copyright © 2022 American College of Cardiology Foundation. Published by Elsevier Inc. All rights reserved.
Conflict of interest statement
Funding Support and Author Disclosures Dr Mohebi is supported by the Barry Fellowship. Dr McCarthy is supported by a National. Heart, Lung, and Blood Institute T32 postdoctoral training grant (5T32HL094301-12). Dr Hyle is supported by the National Institute on Aging (R01 AG069575). Dr Januzzi is supported by the Hutter Family Professorship. Dr Ibrahim has received honoraria from Cytokinetics, Medtronic, Novartis, and Roche. Dr Gaggin has received research grant support from Roche Diagnostics, Jana Care, Ortho Clinical, Novartis, Pfizer, Alnylam, and Akcea; has received consulting income from Amgen, Eko, Merck, Roche Diagnostics, and Pfizer; has stock ownership for Eko; has received research payments for clinical endpoint committees from Radiometer; and has received research payment for clinical endpoint committees from the Baim Institute for Clinical Research for Abbott, Siemens, and Beckman Coulter. Dr Singer receives research support from Bristol Myers Squibb; and has received consulting income from Bristol Myers Squibb, Fitbit, Medtronic, and Pfizer. Dr Wasfy is supported by a grant from the American Heart Association (18 CDA 34110215); and has received consulting income from Pfizer and Biotronik. Dr Januzzi is supported by the Hutter Family Professorship; is a Trustee of the American College of Cardiology; is a board member of Imbria Pharmaceuticals; has received grant support from Abbott Diagnostics, Applied Therapeutics, Innolife, and Novartis; has received consulting income from Abbott Diagnostics, Boehringer Ingelheim, Janssen, Novartis, and Roche Diagnostics; and participates in clinical endpoint committees/data safety monitoring boards for AbbVie, Siemens, Takeda, and Vifor. All other authors have reported that they have no relationships relevant to the contents of this paper to disclose.
Figures


Comment in
-
Worsening Cardiovascular Disease Epidemiology in the United States: The Time for Preparation Is Now.J Am Coll Cardiol. 2022 Aug 9;80(6):579-583. doi: 10.1016/j.jacc.2022.05.035. J Am Coll Cardiol. 2022. PMID: 35926930 Free PMC article.
References
-
- Olshansky SJ, Ault AB. The fourth stage of the epidemiologic transition: the age of delayed degenerative diseases. Milbank Q. 1986:355–391. - PubMed
-
- Ogden CL, Carroll MD, Curtin LR, Lamb MM, Flegal KM. Prevalence of high body mass index in US children and adolescents, 2007–2008. JAMA. 2010;303(3):242–249. - PubMed
Publication types
MeSH terms
Grants and funding
LinkOut - more resources
Full Text Sources
Medical

