. 2022 Sep;150(1):21-30.
doi: 10.1016/j.jphs.2022.06.002. Epub 2022 Jun 13.

Serum stratifin and presepsin as candidate biomarkers for early detection of COVID-19 disease progression

Affiliations

Serum stratifin and presepsin as candidate biomarkers for early detection of COVID-19 disease progression

Noriaki Arakawa et al. J Pharmacol Sci. 2022 Sep.

Abstract

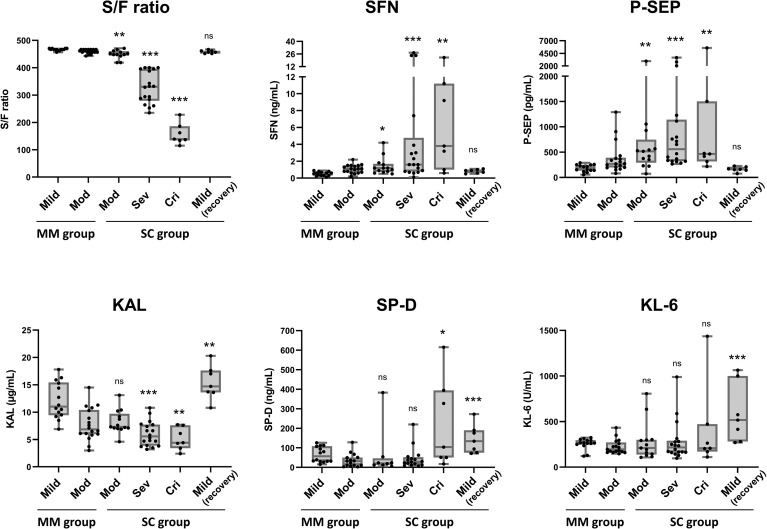
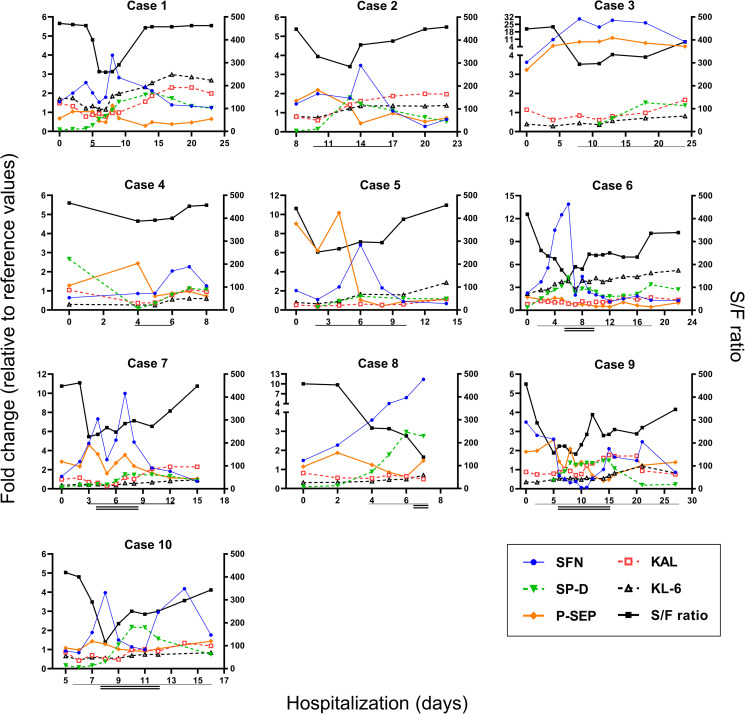
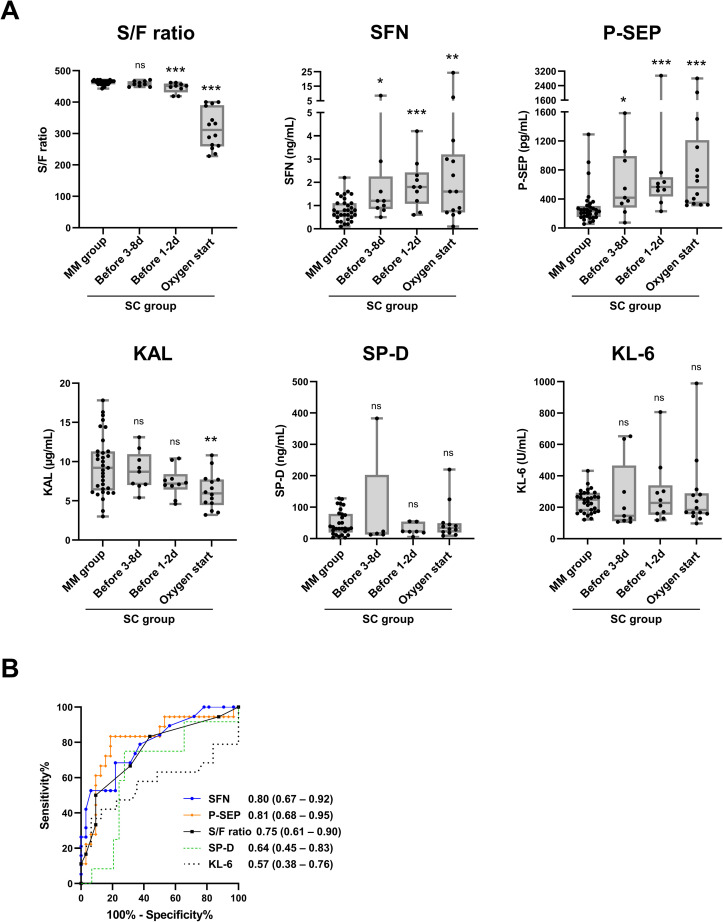
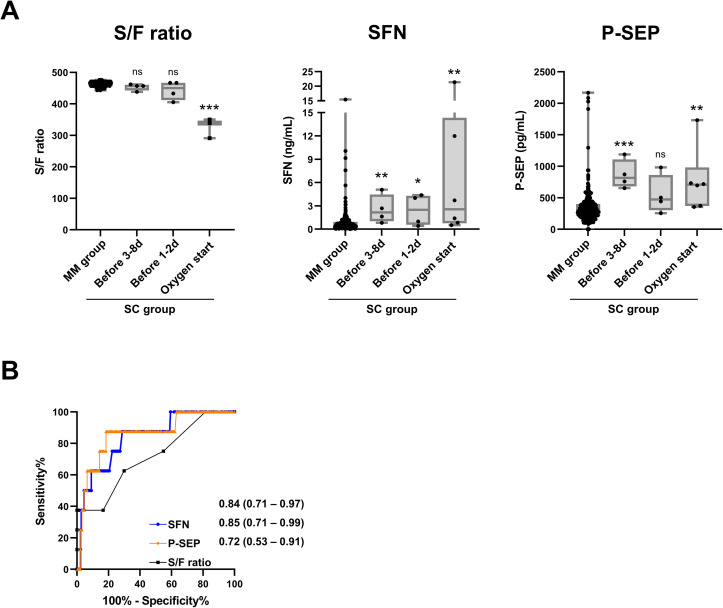
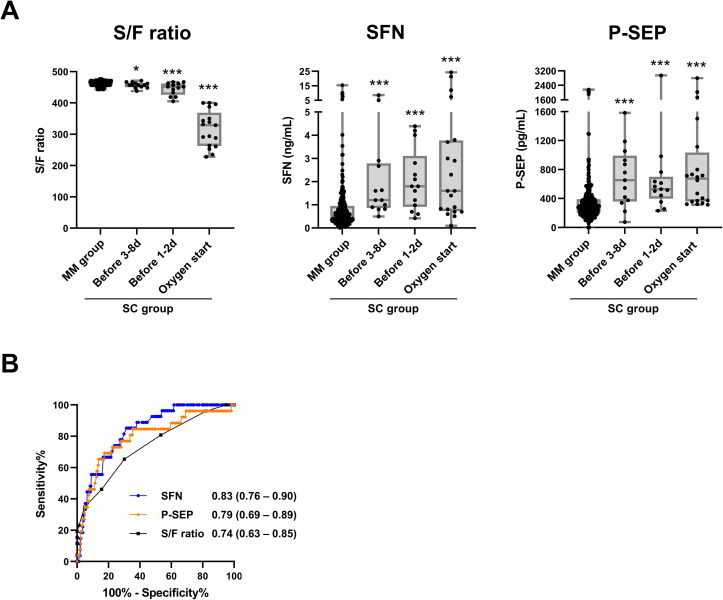
The prognosis of patients with severe cases of COVID-19 is poor; thus, biomarkers for earlier prediction of COVID-19 progression are vital. We measured levels of five lung injury-related biomarkers, SP-D, KL-6, presepsin, kallistatin and stratifin, in serum samples collected serially during hospitalization from 31 patients with mild/moderate or severe/critical COVID-19 pneumonia, and their predictive performances were compared. Like the previously reported presepsin, a new biomarker candidate, stratifin, was significantly elevated with the onset of severe or critical symptoms in COVID-19 patients and decreased with symptom improvement. Notably, changes in stratifin and presepsin levels were distinctly earlier than those in SP-D, KL-6 and even SpO2/FiO2 values. Furthermore, serum levels of these biomarkers were significantly higher at the pre-severe stage (before the start of oxygen support) of patients who eventually advanced to severe/critical stages than in the patients who remained at the mild/moderate stage. These results were confirmed in an independent cohort, including 71 mild/moderate and 14 severe/critical patients, for whom the performance of stratifin and presepsin in discriminating between mild/moderate and pre-severe conditions of COVID-19 patients was superior to that of the SpO2/FiO2 ratio. Therefore, we concluded that stratifin and presepsin could be used as prognostic biomarkers for severe COVID-19 progression.

Keywords: COVID-19; Predictive biomarker; Presepsin; Stratifin.


Conflict of interest statement

Declaration of competing interest The authors declare no conflicts of interest in this work.

Figures

Fig. 1
Fig. 1
Biomarker levels and COVID-19 severity. Data of cohort-1 are shown. The mild, moderate (Mod), severe (Sev) and critical (Cri) indicate stages of COVID-19 pneumonia symptom at sample taken. For the MM group, data of all samples taken during hospitalization are shown. For the SC group, data of samples taken on the first day of the indicated stages are shown. Mild (recovery) indicates a recovered stage within the post-severe stage in the SC group. The boxes indicate interquartile ranges (75% and 25%) and medians. Differences from the non-severe group by the Mann–Whitney U-test: ∗: p < 0.05, ∗∗: p < 0.01, ∗∗∗: p < 0.001.
Fig. 2
Fig. 2
Change in biomarker levels on consecutive days. Data of representative 10 patients who developed severe- and/or critical-stage disease from initial moderated status are shown (Cases 1–5: the moderate-to-severe cases, 6–10: the moderate-to-critical cases). The left Y axis shows the fold change value relative to the reference value of each biomarker (1.0 indicates the reference value). The reference values were determined as the upper (SFN, SP-D, KL-6. P-SEP) or lower (KAL) 2SD values from mean concentration for each biomarker at the mild stage in the MM group (ref. Supplementary Table 1). The right Y-axis shows the SpO2/FiO2 (S/F) ratio, while the X axis shows the number of days of hospitalization. Horizontal single and double lines indicate duration of severe stage (oxygen support) and critical stage (invasive ventilation), respectively.
Fig. 3
Fig. 3
Comparison of predictive performances for severe/critical COVID-19 patients. Data of cohort-1 are shown. A, S/F ratio, serum levels of SFN, P-SEP, KAL, SP-D, KL-6 in all samples from the MM group, and samples taken at the pre-severe stage (1–8 days before start of oxygen support) and the severe stage (start day of oxygen support) in the moderate-to-severe and moderate-to-critical cases of the SC group are shown. The boxes indicate interquartile ranges (75% and 25%) and medians. B, ROC curves in discrimination of the MM group samples and samples at the pre-severe stage (1–8 days before start of oxygen support) in the SC group. Numbers indicate the area under the curve (AUC) derived from ROC curves, and the 95% confidence intervals (95% CIs). Differences from the MM group by the Mann–Whitney U-test: ∗: p < 0.05, ∗∗: p < 0.01, ∗∗∗: p < 0.001.
Fig. 4
Fig. 4
Validation of serum SFN and P-SEP levels using cohort-2. Serum S/F ratio, SFN levels and P-SEP levels for each symptom stage (mild, moderate (Mod), severe (Sev) and critical (Cri)) in the MM and SC groups. For the MM group, data of all samples taken during hospitalization are shown. For the SC group, data of samples taken at the first day of indicated stages are shown. The boxes indicate interquartile ranges (75% and 25%) and medians. Differences to the non-severe group by the Mann–Whitney U-test: ∗: p < 0.05, ∗∗: p < 0.01, ∗∗∗: p < 0.001.
Fig. 5
Fig. 5
Validation of prognostic performance for serum SFN and P-SEP using cohort-2. A, Serum S/F ratio, SFN levels and P-SEP levels in all samples from the MM group, and samples at the pre-severe stage (1–8 days before start of oxygen support) and severe stage (start day of oxygen support) in the moderate-to-severe and moderate-to-critical cases of the SC group. The boxes indicate interquartile ranges (75% and 25%) and medians. Differences from the MM group by the Mann–Whitney U-test: ∗: p < 0.05, ∗∗: p < 0.01, ∗∗∗: p < 0.001. B, ROC curves in discrimination of the MM group samples and samples at pre-severe stage in severe group.
Fig. 6
Fig. 6
Combined analysis using cohort-1 and -2 on prognostic performance for serum SFN and P-SEP. A, Serum S/F ratio, SFN levels and P-SEP levels in all samples from the MM group, and samples at the pre-severe stage (1–8 days before start of oxygen support) and severe stage (start day of oxygen support) in the moderate-to-severe and moderate-to-critical cases of the SC group. The boxes indicate interquartile ranges (75% and 25%) and medians. Differences from the MM group by the Mann–Whitney U-test: ∗: p < 0.05, ∗∗: p < 0.01, ∗∗∗: p < 0.001. B, ROC curves in discrimination of the MM group samples and samples at pre-severe stage in severe group.

References

    1. https://www.who.int/publications/i/item/WHO-2019-nCoV-clinical-2021-2
    1. https://www.mhlw.go.jp/content/000815065.pdf
    1. Malik P., Patel U., Mehta D., et al. Biomarkers and outcomes of COVID-19 hospitalisations: systematic review and meta-analysis. BMJ Evid Based Med. 2021;26(3):107–108. - PMC - PubMed
    1. Ishikawa N., Hattori N., Yokoyama A., Kohno N. Utility of KL-6/MUC1 in the clinical management of interstitial lung diseases. Respir Investig. 2012;50(1):3–13. - PubMed
    1. d'Alessandro M., Cameli P., Refini R.M., et al. Serum KL-6 concentrations as a novel biomarker of severe COVID-19. J Med Virol. 2020;92(10):2216–2220. - PMC - PubMed